Volume 60, 2019, Pages 150–160
Proceedings of 11th International Conference on Bioinformatics and Computational Biology
Petri nets and ODE as complementary tools in analysis of
signaling pathways
Daria Kogut
1, Kaja Gutowska
2, Aleksandra Poterala-Hejmo
1, Jaroslaw Smieja
1,
Dorota Formanowicz
3, and Piotr Formanowicz
241
Institute of Automatic Control, Silesian University of Technology, Gliwice, Poland
[email protected],[email protected],[email protected]
2
Institute of Computing Science, Poznan University of Technology, Poznan, Poland
[email protected],[email protected]
3 Department of Clinical Biochemistry and Laboratory Medicine, Poznan University of Medical
Sciences, Poznan, Poland
4
Institute of Bioorganic Chemistry, Polish Academy of Sciences, Poznan, Poland
Abstract
Regulation of gene expression is one of the most important problems analyzed in sys-tems biology. It involves, among other, interactions of mRNA with miRNA - a small (21-25 nt) single–stranded non–coding RNA molecule. Its main function is post-transcriptional regulation of gene expression leading to gene silencing. It is achieved either by inhibition of translation or by degradation of mRNA. The detailed mechanisms employed include in-hibition of attaching the 60s ribosomal subunit, premature ribosome drop-off or inin-hibition of protein elongation process, cleavage of mRNA or destabilization of mRNA. Another mechanism of regulation of gene expression involves reactive oxygen species (ROS - radical and non-radical oxygen species formed by the partial reduction of oxygen) which, being released from mitochondrium cytochrome C and inducing DNA damage, induce the apop-tosis pathway. ROS level can be regulated by antioxidant systems existing in a cell. This paper presents analysis of a model of gene regulation based on these molecules, in which Petri net is used to find the key reactions and, subsequently, an ODE-based model is used to verify these conclusions.
1
Introduction
Parkinson’s disease, or diabetes (see, e.g., [7, 9]). Decreased level of ROS leads to impaired proliferation and immune functions, while overproduction results in damage of DNA, proteins, and lipids within the cell, and, in consequence, mutations and apoptosis [17].
To maintain redox balance, cells are equipped with several antioxidative mechanisms, includ-ing one based on glutathione. Glutathione is a low molecular weight thiol compound considered one of the most important antioxidants synthesized in cells, and the most abundant one [2]. This tripeptide, known also asγ-L-glutamyl-L-cysteinylglycine, is a product of a two-step re-action: addition of cysteine to glutamate, followed by the addition of glycine. The first, rate limiting, step is catalyzed by two proteins: glutamate-cysteine ligase catalytic subunit (GCLC) and glutamate-cysteine ligase modifier subunit (GCLM) forming a complex called GCL. Second reaction is catalyzed by glutathione synthetase (GSS) [8].
Glutathione exists in oxidized (GSSG) and reduced (GSH) form, and it is mainly accumu-lated in the cytoplasm (over 80%) with the rest located in mitochondria, endoplasmic reticulum, and nucleus [8, 1]. GSH is the main form, which can be used to reduce H2O2 into H2O and
GSSG (reaction catalyzed by proteins from glutathione peroxidase (GPx) family) or sponta-neously reacts with other radicals to neutralize them. Oxidized glutathione can be reduced back to GSH form either by glutathione reductase (GSR) or thioredoxin, and used again to eliminate ROS. GSH:GSSG ratio is an important indicator of oxidoreductive conditions and increased GSSG level serve as a marker of oxidative stress [1].
Another molecular specie, involved in the processes under investigation, is p53 protein, known best for its role in the regulation of cell death. Recently, it has been identified as a factor bidirectionally regulating redox environment (it serve as a pro- and antioxidant) [15]. Multiple elements associated with glutathione–based antioxidative pathway have been proved to be p53-dependent, including GCLC gene regulated at the transcription level by p53 and proteins regulated indirectly through the transcription factor NRF2 and miRNAs [11].
The aim of this work is to use two different methods for modeling and analysis of signaling pathways. The first method based on Petri net allows to create an interaction network with no quantitative parameters. Analysis of such model leads, among other, to determine the most significant subprocesses, or reactions, for the entire biological system. This approach allows to focus on selected issues in simulations of the second model based on differential equations.
2
Methods
2.1
Petri net-based approach
Formally a Petri net is defined as a 5-tuple of the form: Q= (P, T, F, W, M0), where: P = {p1, ..., pn}is a finite set of places, T={t1, ..., tm} is a finite set of transitions,F ⊆(P×T)∪
(T×P) is a finite set of arcs, W : F → Z+ is a weight function, M
0 : P → N is an initial
marking,P∩T =∅ ∧P∪T 6=∅[10].
is governed by a transitions firing rule. A transition can be fired, when the number of tokens in each preceding place is equal or grater than the weight of the arc connecting the place with the transition [4, 10,16]. The graphical representation of a Petri net helps to understand the complex network of dependencies, as well as its behavior, during simulation. However, it is a mathematical representation, called incidence matrix, that is crucial for the analysis. Such matrixA is composed of n rows, corresponding to places, and m columns, corresponding to transitions. The entryaijof matrixAis an integer number, equal to the difference between the
numbers of tokens present in place pi before and after firing transitiontj [10]. The incidence
matrix enables the determination of t-invariants, that are the basis for the analysis [5,6]. Such an invariant is a vectorx∈ Nm, which is a solution of equation A·x= 0, and it represents some subprocess occurring in the modeled system, which does not change its state. With every t-invariantx, there is associated setsupp(x) ={tj:xj >0, j= 1,2. . . , m}, called its support.
Firing every transitiontj ∈supp(x)xj times does not change the distribution of tokens in the
net.
The analysis of t-invariants is based on searching for similarities between them, which in the biological context corresponds to the similarities between subprocesses. Each transition corresponds to a certain elementary process, hence searching for intersection of t-invariants supports is a key point of analysis. Transitions being elements of such intersection correspond to some elementary processes, which may be crucial for the modeled process. Moreover, they can also be a source of interesting, previously unknown properties of the analyzed biological system, because subprocesses containing such transitions can interact with each other.
Additionally, t-invariants can be grouped into t-clusters, while transitions can be grouped into MCT sets (Maximal Common Transition sets). Each such set contains transitions belonging to supports of exactly the same t-invariants. Both MCT sets and clusters correspond to certain functional blocks of the model system, for which biological meaning should be determined [4, 6, 16]. A more detailed description of the methods of analyzing models based on Petri net was described in [3].
2.2
A pathway modeling with using differential equations
Biology and medicine are increasingly using various technical devices and approaches to learn more and understand biochemical and physical processes behind cellular responses to stress factors and, ultimately, use this knowledge to treat diseases more effectively, including designing gene therapies or targeting particular signaling pathways. On the other hand, technology may also benefit from biological knowledge, as the latter provides inspiration for developing new methods to solve technical problems.
In this work, we present a particular regulatory system, involving ROS and miRNA species. Figure1shows the proposed diagram of the ROS level control pathway with glutathione. The sharp-pointed arrows represent stimulation of the process, to which the arrowhead is directed, and the blunt ends represent inhibition of the process. In the diagram two groups of compounds are distinguished - an oval is used to represent proteins, while the other shapes - other groups of compounds. The system has been described in two ways - by using the Petri net and by using differential equations. Differential equations describe the changes in the concentrations/quan-tities of molecules taken into account due to interactions between them.
Figure 1: The proposed model of ROS regulation with glutathione.
3
The Models
Two models have been proposed as a part of the research described in this paper. The first one is based on the Petri net theory, while the other one is based on differential equations. The analysis of Petri net allows to determine which of the modeled subprocesses is the most important for the whole biological system, what in turn can be used in a model based on differential equations.
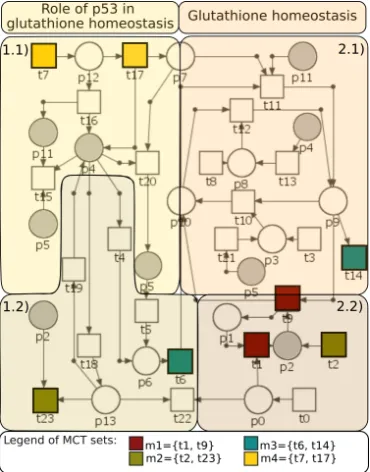
The proposed Petri net model of the biological system has been built using standalone Java application called Holmes [12]. The model shown in Figure 2 consists of several functional parts: 1.1) corresponding to relation between p53 and NRF2, 1.2) corresponding to relation be-tween p53 and miR34a, 2.1) corresponding to oxidation-reduction reactions of GSH and GSSG, and 2.2) corresponding to oxidation-reduction reactions of TRXred and TRXox. The modeled
system contains 4 non-trivial MCT sets, each containing more than one transition. Transitions belonging to these sets are marked in different colors. The names of all model components, both places and transitions, are included in Tables1and2. The names of transitions from the Petri net based model, are contained in column called ”Biological meaning (PN)”, while col-umn called ”Biological meaning (ODE)” contains a description of coefficients in the differential equations model.
The proposed ODE model is a deterministic model based on mass-action law. This is a clas-sic method of signaling pathway simulations. The equations were based on the scheme on Fig. 1. The model contains twelve equations, which represent concentration of each molecule in the system and their interactions with another molecules. The coefficients (ti) are describing
reac-tion speed, which depends on another molecules. Output of the model represents concentrareac-tion of molecules in stationary state. The results also show the number of compound molecules in the steady state after dimensionless time t.
activates NRF2. Additional simplification of the models is the positive feedback loop between p53 and miR34a. In the proposed models miR34a directly leads to activation of p53, however in a cell this is a more complex process, and not well explored.
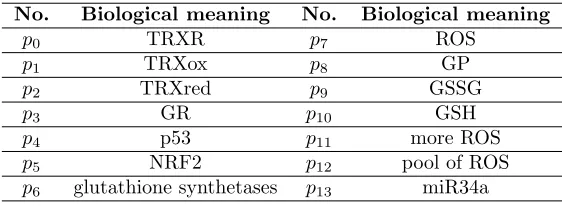
No. Biological meaning No. Biological meaning
p0 TRXR p7 ROS
p1 TRXox p8 GP
p2 TRXred p9 GSSG
p3 GR p10 GSH
p4 p53 p11 more ROS
p5 NRF2 p12 pool of ROS
p6 glutathione synthetases p13 miR34a
Table 1: List of places
4
Analyses and results
The analysis of the Petri net model is mainly based on t-invariants whose number depends on the nature of the modeled system. The presented model consists of 14 places, 24 transitions, 4 non-trivial MCT sets and it is covered by 22 t-invariants. Biological meaning for MCT sets is included in Table3.
Similar t-invariants are grouped into 12 t-clusters for which biological significance is de-scribed. The notification used in descriptions is as follows: c12 = {x21, x22}, where c12 is a
symbol of a cluster andx21,x22are a symbols of t-invariants belonging to this cluster:
• c1 ={x1}: p53 activation influenced by cytotoxic ROS level leads to NRF2 inhibition,
while p53 activation influenced by physiological ROS level leads to enhancement protein level of NRF2.
• c2={x2}: Positive feedback between p53 and miR34a (the model contains simplification,
miR34a does not directly affect the enhancement of p53 activity).
• c3 = {x3}: GSH is oxidized to GSSG by GP, while reduction of GSSG to GSH occurs
with simultaneous TRXredoxidation to TRXox.
• c4 ={x4}: GSH is oxidized to GSSG by GP and by ROS, while reduction of GSSG to
GSH occurs with simultaneous TRXredoxidation to TRXox.
• c5 = {x5, x9, x13, x17}: p53 activation influenced by physiological ROS levels leads to
enhancement protein level of NRF2, which is involved in GSH synthesis by regulation of GCL activity. GSH is oxidized to GSSG by ROS, while reduction of GSSG to GSH by GR. Moreover, reduction to GSH occurs also with simultaneous TRXredoxidation to TRXox.
Additionally, p53 has influence on transcription of miR34a, which inhibits TRXred.
• c6={x6, x10, x14, x18}: This cluster contains all of the subprocesses described in cluster
c5, with one difference in which miR34a inhibits TRXR expression.
• c7={x7}: GSH oxidation to GSSG by GP, and reduction to GSH by GR.
• c8 = {x8}: GSH is oxidized to GSSG by GP (activation by p53) and by ROS, while
reduction of GSSG to GSH is catalysed by GR.
• c9={x11, x12}: GSH oxidation to GSSG by GP (which may be additionally activated by
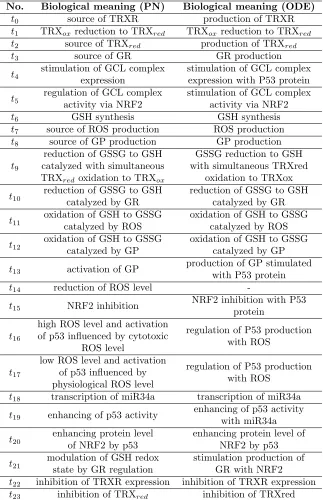
No. Biological meaning (PN) Biological meaning (ODE)
t0 source of TRXR production of TRXR
t1 TRXoxreduction to TRXred TRXoxreduction to TRXred
t2 source of TRXred production of TRXred
t3 source of GR GR production
t4
stimulation of GCL complex expression
stimulation of GCL complex expression with P53 protein
t5
regulation of GCL complex activity via NRF2
stimulation of GCL complex activity via NRF2
t6 GSH synthesis GSH synthesis
t7 source of ROS production ROS production
t8 source of GP production GP production
t9
reduction of GSSG to GSH catalyzed with simultaneous TRXred oxidation to TRXox
GSSG reduction to GSH with simultaneous TRXred
oxidation to TRXox
t10
reduction of GSSG to GSH catalyzed by GR
reduction of GSSG to GSH catalyzed by GR
t11
oxidation of GSH to GSSG catalyzed by ROS
oxidation of GSH to GSSG catalyzed by ROS
t12
oxidation of GSH to GSSG catalyzed by GP
oxidation of GSH to GSSG catalyzed by GP
t13 activation of GP
production of GP stimulated with P53 protein
t14 reduction of ROS level
-t15 NRF2 inhibition
NRF2 inhibition with P53 protein
t16
high ROS level and activation of p53 influenced by cytotoxic
ROS level
regulation of P53 production with ROS
t17
low ROS level and activation of p53 influenced by physiological ROS level
regulation of P53 production with ROS
t18 transcription of miR34a transcription of miR34a
t19 enhancing of p53 activity
enhancing of p53 activity with miR34a
t20
enhancing protein level of NRF2 by p53
enhancing protein level of NRF2 by p53
t21
modulation of GSH redox state by GR regulation
stimulation production of GR with NRF2 t22 inhibition of TRXR expression inhibition of TRXR expression
t23 inhibition of TRXred inhibition of TRXred
No. Biological meaning
m1 Thioredoxin redox reaction.
m2 Inhibition of TRXredvia miR34a.
m3 GSH synthesis
m4
Pool of ROS (the model has certain simplification, therefore it contains 2 situations: cytotoxic level of ROS and physiological level of ROS which
are associated with particular places from model, respectivelyp11 - more ROS, andp7 - ROS).
Table 3: List of MCT sets
• c10 ={x15, x16}: p53 activation influenced by physiological ROS level enhances protein
level of NRF2, which may influence on GSH synthesis via GCLC activity regulation. GSH is oxidized to GSSG through ROS and also by GP (which may be additionally activated by p53).
• c11={x19, x20}: Influence of p53 on GSH synthesis via regulation of GCLC expression.
GSH is oxidized to GSSG through ROS and also by GP (which may be additionally activated by p53).
• c12={x21, x22}: Influence of p53 on GSH synthesis via regulation of GCLC expression.
GSH is oxidized to GSSG through ROS. Moreover, p53 is involved in transcription of miR34a, what inhibits TRXredand TRXR expression.
Analysis of t-invariants corresponding to the oxidation and reduction of glutathione showed the following frequencies:
• reaction of GSH oxidation to GSSG by ROS which represents about 73% of all subpro-cesses (16 out of 22 t-invariants),
• reaction of GSH oxidation to GSSG by GP which represents about 46% of all subprocesses (10 out of 22 t-invariants),
• reaction of GSSG reduction to GSH by GR which represents about 36% of all subprocesses (8 out of 22 t-invariants),
• reaction of GSSG reduction to GSH occurs with simultaneous TRXredoxidation to TRXox
which represents about 18% of all subprocesses (4 out of 22 t-invariants).
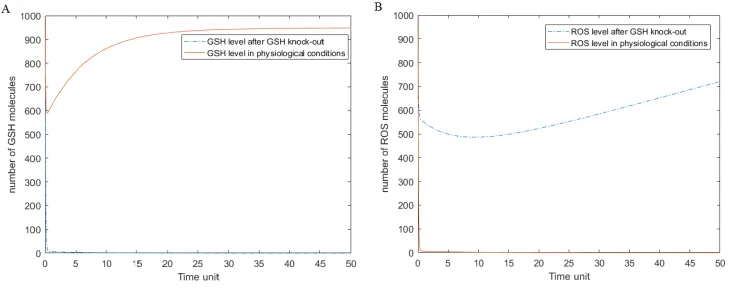
The results of t-invariants and knockout analysis were used to simulation of a model based on differential equations, which was focused on the reaction of GSH oxidation to GSSG by ROS. This reaction turned out to be the most significant in the proposed system. To validate whether this reaction plays a key role in the proposed model, simulations were carried out in two scenarios: in physiological conditions and with GSH knockout (a strong GSH degradation factor was inserted into the model). As the output we assumed ROS level due to the strongest relationships between those variables. The knowledge about this pathway allows to provide the result of the simulation, and confirm or deny the validity of the thesis, that knockout of GSH will disrupt the system.
Figure 3: Results of the simulation of ODE model. The solid line represents level of ROS and GSH after GSH knockout, and the dotted line shows level of ROS and GSH in physiological conditions. Figure A shows the differences between GSH level before and after knockout; B represents ROS level before and after GSH knockout.
On Fig. 3 we can observe very different simulation results for each condition. For physio-logical condition, the ROS level is very low, because high level of GSH wiped out the ROS by oxidation processes. When the GSH is knockouted, the ROS level is rapidly increasing, because oxidation is the only way to remove reactive oxygen species from the system. We can conclude, that the knockout of glutathione can dysregulate the system, and lack of this dipeptide can lead to necrosis or apoptosis.
5
Conclusions
results, discovered properties can be confirmed by simulations of model based on differential equations.
Acknowledgments
This work was funded by NCN grant DEC -2015/19/B/ST7/02984 and funded by BKM /RAU1/2018 (02/010/BKM18/0136).
References
[1] Nazzareno Ballatori, Suzanne M Krance, Sylvia Notenboom, Shujie Shi, Kim Tieu, and Chris-tine L Hammond. Glutathione dysregulation and the etiology and progression of human diseases.
Biological Chemistry, 390(3), 2009.
[2] Henry Jay Forman, Hongqiao Zhang, and Alessandra Rinna. Glutathione: overview of its protec-tive roles, measurement, and biosynthesis. Molecular Aspects of Medicine, 30(1-2), 2009.
[3] Dorota Formanowicz, Kaja Gutowska, and Piotr Formanowicz. Theoretical studies on the engage-ment of interleukin 18 in the immuno-inflammatory processes underlying atherosclerosis. Interna-tional Journal of Molecular Sciences, 19(11), 2018.
[4] Dorota Formanowicz, Adam Kozak, Tomasz G lowacki, Marcin Radom, and Piotr Formanowicz. Hemojuvelin–hepcidin axis modeled and analyzed using petri nets. Journal of Biomedical Infor-matics, 46(6), 2013.
[5] Eva Grafahrend-Belau, Falk Schreiber, Monika Heiner, Andrea Sackmann, Bj¨orn H Junker, Ste-fanie Grunwald, Astrid Speer, Katja Winder, and Ina Koch. Modularization of biochemical net-works based on classification of petri net t-invariants. BMC Bioinformatics, 9(1), 2008.
[6] Ina Koch, Wolfgang Reisig, and Falk Schreiber. Modeling in systems biology: the Petri net ap-proach, volume 16. Springer Science & Business Media, 2010.
[7] Geou-Yarh Liou and Peter Storz. Reactive oxygen species in cancer.Free Radical Research, 44(5), 2010.
[8] Shelly C Lu. Glutathione synthesis. Biochimica et Biophysica Acta (BBA)-General Subjects, 1830(5), 2013.
[9] Shanmugam Manoharan, Gilles J Guillemin, Rajagopal Selladurai Abiramasundari, Musthafa Mo-hamed Essa, Mohammed Akbar, and Mohammed D Akbar. The role of reactive oxygen species in the pathogenesis of alzheimer’s disease, parkinson’s disease, and huntington’s disease: a mini review.Oxidative Medicine and Cellular Longevity, 2016.
[10] Tadao Murata. Petri nets: Properties, analysis and applications. Proceedings of the IEEE, 77(4), 1989.
[11] Francisco Navarro and Judy Lieberman. mir-34 and p53: new insights into a complex functional relationship.PloS One, 10(7), 2015.
[12] Marcin Radom, Agnieszka Rybarczyk, Bart lomiej Szawulak, Hubert Andrzejewski, Piotr Chabel-ski, Adam Kozak, and Piotr Formanowicz. Holmes: a graphical tool for development, simulation and analysis of petri net based models of complex biological systems.Bioinformatics, 33(23), 2017. [13] Paul D Ray, Bo-Wen Huang, and Yoshiaki Tsuji. Reactive oxygen species (ros) homeostasis and
redox regulation in cellular signaling. Cellular Signalling, 24(5), 2012.
[14] Wolfgang Reisig. Understanding petri nets: modeling techniques, analysis methods, case studies.
Springer, 2013.
[16] Andrea Sackmann, Monika Heiner, and Ina Koch. Application of petri net based analysis tech-niques to signal transduction pathways.BMC Bioinformatics, 7(1), 2006.
[17] Michael Schieber and Navdeep S Chandel. Ros function in redox signaling and oxidative stress.