VOLUME 40, ARTICLE 2, PAGES 27
,
48
PUBLISHED 15 JANUARY 2019
https://www.demographic-research.org/Volumes/Vol40/2/ DOI: 10.4054/DemRes.2019.40.2
Research Article
Weak support for a U-shaped pattern between
societal gender equality and fertility when
comparing societies across time
Martin Kolk
© 2019 Martin Kolk.
This open-access work is published under the terms of the Creative Commons Attribution 3.0 Germany (CC BY 3.0 DE), which permits use, reproduction, and distribution in any medium, provided the original author(s) and source are given credit.
1 Introduction 28
2 Data and methods 29
3 Results 30
4 Conclusion 35
5 Acknowledgments 37
References 38
http://www.demographic-research.org 27
Weak support for a U-shaped pattern between societal gender
equality and fertility when comparing societies across time
Martin Kolk1
Abstract
BACKGROUND
A number of recent theories in demography suggest a U-shaped relationship between gender equality and fertility. Fertility is theorized to be high in societies with low levels of gender equality, as well as in societies with high gender equality, with lower fertility in a transition phase.
OBJECTIVE
This study estimates the relationship between gender equality (as operationalized through female political empowerment) and fertility within societies over time, using yearly information on gender equality and fertility for 35 countries.
RESULTS
When examining societies across time there is no evidence of a U-shaped relationship between gender equality and fertility. In cross-sectional analyses across countries for recent periods, such a U-shaped relationship can be observed. For within-society analyses a negative relationship is clear at lower levels of gender equality, while no pattern can be observed in societies with high gender equality.
CONTRIBUTION
Theories that fertility would increase following increasing gender equality are not supported for changes over time within countries. Implications and robustness of the findings are discussed.
1 Demography Unit, Department of Sociology, Stockholm University; Center for the Study of Cultural
1. Introduction
Several recent theories in demography suggest that while initially societies that have more gender equality also have falling fertility levels, but that at higher levels of fertility this relationship reverses. The relationship between gender equality in a society and fertility therefore have a U-shape. Several articles suggesting a U-shaped pattern are among the most cited articles in social demography in the last decade and are increasingly important when family demographers theorize about current and future fertility developments.
In most countries there has been a strong shift towards gender-egalitarian preferences and behavior over the last few decades (Inglehart and Norris 2003; Knight and Brinton 2017). Peter McDonald (2000a, 2000b) suggests that increases in gender equality will reduce fertility in societies with gender inequality, but also that with higher gender equality, institutions will develop that can support increasing fertility in a society (resulting in an overall U-shape). The lowest fertility is found in societies with some public sphere gender equality, where women are increasingly equal in the labor market but where equality within the household is low with most responsibility falling on women. Fertility increases when equality in the private sphere increases. Chesnais (1996) compared Italy and Sweden to make a similar argument. In a later article, McDonald (2013) is explicit in that his theories are predictive for the macro-level association between fertility and gender equality and not for couple-level measures of gender equality. A theoretical account of a U-shaped fertility–gender equality relationship is given by Esping-Andersen (2016). Esping-Andersen and Billari (2015) argue similarly for a U-shaped relationship between fertility and gender equality. Goldscheider, Bernhardt, and Lappegård (2015) make similar predictions in their theories of a gender revolution, stressing the role of male involvement in family life.
http://www.demographic-research.org 29
Theorizing on fertility-equality reversal has likely been spurred by the fact that the most developed countries with high gender equality have had higher fertility than slightly less affluent societies (Myrskylä, Kohler, and Billari 2009). This pattern is most apparent when making cross-sectional comparisons across countries, and gender equality has been argued to explain a U-shaped pattern (Myrskylä, Kohler, and Billari 2011). Mills (2010) examined the relationship between gender equality and fertility for several different indicators of gender equality. She used individual-level data but relied on country-level measures of gender equality and found only weak support for an association with fertility for most measures. The research design analyzes between-country variation in how gender equality is related to fertility. One study has taken a longitudinal perspective on the relationship between fertility and attitudes toward female labor force participation (Arpino, Esping-Andersen, and Pessin 2015). They have measured gender-egalitarian views across three waves (1990–1993, 1999–2000, and 2006–2009) of the World Value Survey to examine relative change in gender equality and how such change is associated with changes in childbearing. They find an ambiguous relationship, though some countries show a U-shaped pattern. They cannot examine changes over time in the most countries with gender equality, as everyone expresses high gender equality in all periods.
A large number of studies have also examined how childbearing is related to gender equality within relationships (such as share of household work or preferences toward gender equality) with divergent findings (e.g., Goldscheider, Bernhardt, and Brandén 2013; Kaufman 2000; Neyer, Lappegård, and Vignoli 2013). Also when examining if men with different attitudes about gender equality have different fertility preferences, the findings are divergent (Goldscheider, Oláh, and Puur 2010; Puur et al. 2008; Westoff and Higgins 2009). However, theories of gender equality at the individual level are beyond the scope of this article, as the mechanisms likely are quite different when compared to the relationship at the societal level. Just as the fertility gradient between rich and poor individuals within a society can be different from the fertility gradient between rich and poor countries, there is no reason to assume that societal- and individual-level traits display the same gradient.
2. Data and methods
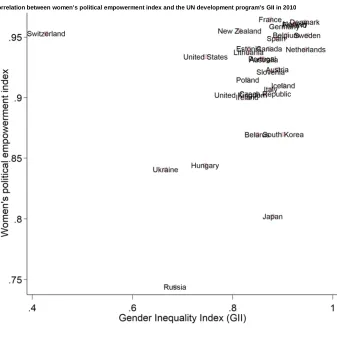
of developed countries. The measure of gender equality, Women’s Political Empowerment Index (WPEI), is based on yearly information and is a multifaceted measure on women’s civil liberties, civil society participation, and political participation across the world. For a further description of the index, see Sundström et al. (2017). For the countries in the study, the measure correlates well with public and scholarly accounts of gender equality, as well as other measures of gender equality across the world (e.g., Matysiak and Węziak-Białowolska 2016; Therborn 2004). The variable is available for a long period of time, is carefully constructed, and has a meaningful interpretation and appropriate amount of variation also for societies with more gender equality, something not always applicable to other gender equality indices (cf. Klasen 2006; Sundström et al. 2017). A comparison with other common nonlongitudinal gender equality indices are available in Supplemental Figure A-1 and show a strong correspondence for year 2010. All input data, code to produce figures and regressions, and some further discussion of how the data was constructed are available in the supplemental materials.
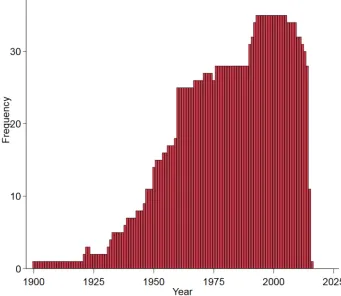
The unit of analysis in the examination is a country-year, with yearly information available for most countries from 1960–2015, with some countries having earlier information. In total, the data for the study includes 35 countries and 1993 country-years. This data is analyzed using bivariate scatter plots examining the association of TFR, WPEI, and year, within and across countries. This is followed by ordinary least squares (OLS)–regressions with controls for year and country. The distribution of country-years and WPEI is available in Supplemental Figures A-2 and A-3.
3. Results
http://www.demographic-research.org 31
Figure 1: Association between TFR and female political empowerment in 35
In Figure 2, the same association is shown for a given country; in other words, this figure examines how the relationship between gender equality and fertility has covaried within a society (for readability I show period on the x-axis, Figure A-4 shows WPEI on the x-axis). The picture is clearly different. While many countries show an overall negative relationship, as in Figure 1a, most countries do not show a pattern of increasing fertility together with increasing equality. The countries with the highest WPEI are found in northwestern Europe (and New Zealand and the Czech Republic) and do not show a U-shaped pattern. Only four countries in the data set (Belgium, Denmark, France, and the Netherlands) show for some periods an (ambiguous) U-shaped pattern of increasing fertility together with increasing gender equality. Another group that has a U-shaped pattern are postcommunist countries that have very low fertility in the immediate post-transitional phase followed by a weak recovery (cf. Billingsley 2010). This pattern does not however fit the general theoretical explanations described by authors of fertility equality theories, as fertility is low and WPEI at all stages is modest in all postcommunist countries.
It seems that the cross-sectional pattern shown in Figure 1b is driven by the fact that high fertility and WPEI countries consistently have both higher fertility and WPEI than other countries in the sample. However, within these high fertility and WPEI countries gender equality is not positively related to fertility. In between-country analyses, such a pattern produces a cross-sectional U-shaped relationship between fertility and gender equality.
http://www.demographic-research.org 33
Figure 2: Association between TFR and female political empowerment in 35
Using data from all countries and periods, there is a negative cross-sectional relationship between fertility and WPEI (model 1). When introducing controls for period trends (and falling fertility) comparing data points across countries (model 2), there is a U-shaped pattern similar to what is predicted by fertility-equality reversal theories and shown earlier in scatter plots (Figure 1a and 1b). The U-shape is particularly marked post-1990 (model 3), where compared to the lowest fertility at intermediate gender equality, fertility is about 0.6 children higher at low WPEI and 0.35 children higher at the highest WPEI. However, in all models in which country characteristics are taken into account (models 4–6) – and only within-society variation is modeled – the relationship is largely negative. When controlling for a general decline in fertility over time (model 5), there is some evidence of slightly higher fertility at the very highest levels of WPEI, though the effect is small and nonsignificant. This pattern is not found for the post-1990 period (model 6). As such, the regression analyses are consistent with the interpretation of the absence of a curvilinear relationship between gender equality and fertility when studying change within societies.
Figure 3: OLS Regression between TFR and WPEI (female empowerment
http://www.demographic-research.org 35
4. Conclusion
The main finding of this study is that there is no clear pattern between fertility and gender equality – when operationalized as female political empowerment – in developed countries with high gender equality. A curvilinear relationship is found in cross-sectional comparisons between countries after the 1980s, but such patterns disappear when focusing on changes within countries over time. The explanation for this pattern is that countries with high gender equality relative to other contemporaneous countries (mostly in northwestern Europe) have also had stable high fertility in the last few decades.
These findings stand in contrast to recent theories in family demography – referred to as fertility-equality reversal theories in this study (Esping-Andersen and Billari 2015; Goldscheider et al. 2015; McDonald 2013) – that predicts a U-shaped pattern between fertility and the level of gender equality (and family-friendly institutions) in a society. Such theories suggest that fertility in societies will first respond negatively to increases in gender equality but that at higher levels of gender equality, the relationship will be the opposite. The theories are based on the evolution of the relationship between fertility levels and gender equality within a society over time.
gender quality over time, for both the private and public sphere and with a separate focus on men and women (cf. Goldscheider et al. 2010).
The positive cross-sectional correlations originate in that some northwestern European countries have both high gender equality and high fertility over a long period of time. Therefore, the presented empirical results are likely not due to measurement choices. Instead, they reflect the countries that are universally seen as globally among the most gender equal have not seen concurrent rises in fertility and gender equality. The high fertility (relative to other rich countries) in these societies goes back to the 1960s and earlier, even though surveys show massive value changes over this time and many policies and behavioral changes, such as public day care and male-parental leave, which were rare before the 1980s. Even though fertility-equality reversal theories are modeled on experiences in Nordic countries, these countries have not had an experience that fits the causal model suggested in fertility-equality reversal theories.
Note that the absence of a relationship between fertility over time in a country and the overall progress toward gender equality does not rule out a relationship where, at the couple level, equality such as division of labor and share of housework is positively associated with fertility. If the population is heterogeneous according to their relative gender equality, many patterns could exist, even if there is no relationship at the aggregated level. Fertility-equality reversal theories may be more productive in predicting the gradient of fertility across couples with gendered household arrangements within a society.
http://www.demographic-research.org 37
differ from other societies culturally, and why did they have high fertility in the 1950s and 1960s, when they were less gender egalitarian than many countries with low fertility today? The apparently spurious relationship between measures of gender equality and fertility in cross-sectional data, which is not reflected in empirical longitudinal time series, is a cautionary tale to the dangers of cross-sectional analyses to model longitudinal processes and theories.
5. Acknowledgments
References
Arpino, B., Esping-Andersen, G., and Pessin, L. (2015). How do changes in gender role attitudes towards female employment influence fertility? A macro-level analysis.
European Sociological Review 31(3): 370–382.doi:10.1093/esr/jcv002.
Billingsley, S. (2010). The post-communist fertility puzzle.Population Research and Policy Review 29(2): 193–231.doi:10.1007/s11113-009-9136-7.
Chesnais, J.-C. (1996). Fertility, family, and social policy in contemporary Western Europe. Population and Development Review 22(4): 729–739. doi:10.2307/ 2137807.
Coppedge, M., Gerring, J., Lindberg, S.I., Skaaning, S.-E., Teorell, J., Altman, D., Bernhard, M., Fish, M.S., Glynn, A., Hicken, A., Knutsen, C.H., Krusell, J., Lührmann, A., Marquardt, K.L., McMann, K., Mechkova, V., Olin, M., Paxton, P., Pemstein, D., Pernes, J., Petrarca, C.S., von Römer, J., Saxer, L., Seim, B., Sigman, R., Staton, J., Stepanova, N., and Wilson, S. (2017). Varieties of Democracy (V-Dem) project: V-Dem [Country-Year/Country-Date] dataset v7.1 [electronic resource]. Gothenburg: V-Dem Institute. https://www.v-dem.net/en/ data/data-version-7-1.
Esping-Andersen, G. (2016).Families in the 21st century. Stockholm: SNS Förlag.
Esping-Andersen, G. and Billari, F.C. (2015). Re-theorizing family demographics.
Population and Development Review 41(1): 1–31. doi:10.1111/j.1728-4457. 2015.00024.x.
Ferrarini, T. and Duvander, A.-Z. (2009). Swedish family policy: Controversial reform of a success story (Referat Westliche Industrieländer 3). Stockholm: Friedrich Ebert Stiftung.
Goldscheider, F., Bernhardt, E., and Brandén, M. (2013). Domestic gender equality and childbearing in Sweden. Demographic Research 29(40): 1097–1126. doi:10. 4054/DemRes.2013.29.40.
http://www.demographic-research.org 39
Human Fertility Database (2018). Human fertility database [electronic resource]. Rostock and Vienna: Max Planck Institute for Demographic Research and Vienna Institute of Demography.www.humanfertility.org.
Inglehart, R. and Norris, P. (2003).Rising tide: Gender equality and cultural change around the world: Cambridge: Cambridge University Press. doi:10.1017/ CBO9780511550362.
Kaufman, G. (2000). Do gender role attitudes matter? Family formation and dissolution among traditional and egalitarian men and women. Journal of Family Issues
21(1): 128–144.doi:10.1177/019251300021001006.
Klasen, S. (2006). UNDP’s gender-related measures: Some conceptual problems and possible solutions.Journal of Human Development 7(2): 243–274.doi:10.1080/ 14649880600768595.
Knight, C.R. and Brinton, M.C. (2017). One egalitarianism or several? Two decades of gender-role attitude change in Europe. American Journal of Sociology 122(5): 1485–1532.doi:10.1086/689814.
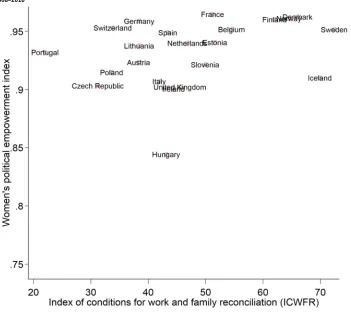
Matysiak, A. and Węziak-Białowolska, D. (2016). Country-specific conditions for work and family reconciliation: An attempt at quantification. European Journal of Population 32(4): 475–510.doi:10.1007/s10680-015-9366-9.
McDonald, P. (2000a). Gender equity in theories of fertility transition.Population and Development Review 26(3): 427–439.doi:10.1111/j.1728-4457.2000.00427.x. McDonald, P. (2000b). Gender equity, social institutions and the future of fertility.
Journal of the Australian Population Association 17(1): 1–16. doi:10.1007/ BF03029445.
McDonald, P. (2013). Societal foundations for explaining fertility: Gender equity.
Demographic Research 28(34): 981–994.doi:10.4054/DemRes.2013.28.34. Mills, M. (2010). Gender roles, gender (in) equality and fertility: An empirical test of
five gender equity indices. Canadian Studies in Population 37(3–4): 445–474. doi:10.25336/P6131Q.
Myrskylä, M., Kohler, H.-P., and Billari, F.C. (2009). Advances in development reverse fertility declines.Nature 460(7256): 741–743.doi:10.1038/nature08230.
Neyer, G., Lappegård, T., and Vignoli, D. (2013). Gender equality and fertility: Which equality matters?European Journal of Population 29(3): 245–272.doi:10.1007/ s10680-013-9292-7.
Puur, A., Oláh, L.S., Tazi-Preve, M.I., and Dorbritz, J. (2008). Men’s childbearing desires and views of the male role in Europe at the dawn of the 21st century.
Demographic Research 19(56): 1883–1912.doi:10.4054/DemRes.2008.19.56. Stanfors, M. and Goldscheider, F. (2017). The forest and the trees: Industrialization,
demographic change, and the ongoing gender revolution in Sweden and the United States, 1870–2010.Demographic Research 36(6): 173–226.doi:10.4054/ DemRes.2017.36.6.
Sundström, A., Paxton, P., Wang, Y.-T., and Lindberg, S.I. (2017). Women’s political empowerment: A new global index, 1900–2012. World Development 94: 321– 335.doi:10.1016/j.worlddev.2017.01.016.
Therborn, G. (2004). Between sex and power: Family in the world, 1900–2000. London: Routledge.doi:10.4324/9780203643297.
Westoff, C.F. and Higgins, J.A. (2009). Relationships between men’s gender attitudes and fertility: Response to Puur et al.’s “Men’s childbearing desires and views of the male role in Europe at the dawn of the 21st century.”Demographic Research
http://www.demographic-research.org 41
Supplemental material
Figure A-1: Correlations between different gender indices (See supplemental files for input data and sources.)
Figure A-1: (Continued)
http://www.demographic-research.org 43
Figure A-1: (Continued)
Figure A-1: (Continued)
http://www.demographic-research.org 45
http://www.demographic-research.org 47