VOLUME 39, ARTICLE 29, PAGES 835
,
854
PUBLISHED 10 OCTOBER 2018
https://www.demographic-research.org/Volumes/Vol39/29/ DOI: 10.4054/DemRes.2018.39.29
Descriptive Finding
Educational selectivity of internal migrants:
A global assessment
Aude Bernard
Martin Bell
© 2018 Aude Bernard & Martin Bell.
This open-access work is published under the terms of the Creative Commons Attribution 3.0 Germany (CC BY 3.0 DE), which permits use, reproduction, and distribution in any medium, provided the original author(s) and source are given credit.
1 Introduction 836
2 Data and methods 838
3 Results 839
4 Discussion and conclusion 847
5 Acknowledgements 848
Educational selectivity of internal migrants: A global assessment
Aude Bernard1
Martin Bell2
Abstract
BACKGROUND
It is well established that migrants are a selected group with respect to a number of characteristics, including education. However, the extent to which the degree of educational selectivity varies between countries remains unclear.
OBJECTIVE
We assess the educational selectivity of internal migrants for a global sample of 56 countries that represent over 65% of the world population.
METHODS
We fit binomial logistic regression to individual-level census data drawn from the Integrated Public Use Microdata Series-International (IPUMS). For each country, we regress migration against educational attainment and include a set of individual-level control variables and urban status of current place of residence. We report results for individual countries and estimate global and regional population-weighted means. RESULTS
Globally, compared to individuals with no formal education, those with primary education are 1.7 times more likely to move, those with secondary education 2.9 times, and those with tertiary education 4.2 times. Once control variables are added, the effect of education decreases to 1.1, 1.2, and 2.3 times for primary, secondary, and tertiary education respectively. In all countries but Haiti tertiary education has a positive, statistically significant impact on migration, and in 80% of countries both secondary and tertiary education significantly increase the odds of migrating.
CONCLUSIONS
The results lend unequivocal support to the hypothesis that the likelihood to move increases with educational attainment while revealing significant variations between and within regions.
CONTRIBUTION
This study has uncovered a near universal empirical regularity in the effect of education on migration while revealing limited educational selectivity in Latin America. Variations in the degree of educational selectivity indicate that the effect of education on migration decision is subtle, varied, and specific to the national context and is not a function of the level of human development as originally anticipated.
1. Introduction
Migration is widely acknowledged to be integral to the process of human development. At an individual level, migration is essential to economic and social well-being by allowing individuals to pursue their goals and aspirations, including education. At the same time, education can facilitate migration by lowering the costs and barriers to moving and increasing economic returns – wages in particular – to migration. As a result, migrants tend to exhibit a high level of education compared with the general population (Borjas 1994; Massey et al. 1993). At the regional and national level, migration underpins the efficient functioning of the economy by bringing knowledge and skills to the locations where they are needed (Blanchard et al. 1992). The linkages between migration and education are therefore complex and multifaceted, as there are multiple channels through which migration and education can influence one another. Understanding the reciprocal relationship between migration and education, in particular the educational selectivity of migrants, is essential to ensure appropriate planning and policy response to shifts in the distribution of human capital at both origin and destination.
(Lucas 1997), including educational attainment, which is a primary determinant of internal migration, including from rural to urban areas in developing countries (World Bank 2009).
As countries develop and education expands – first in urban areas as cities provide greater educational opportunities (UNFPA 2007) – the degree of educational selectivity of migrants may evolve in two possible directions (Long 1973). Because of the expansion of education, individuals with little education may be trapped in areas with limited opportunities (Catney and Simpson 2010; Gould 1982). If their propensity to migrate declines while the migration rate of other groups remains unchanged or declines less, then the education–migration gradient will have increased. On the other hand, if it becomes increasingly difficult for less educated people to find employment, they may be out of work, and it is well established that unemployed individuals tend to show higher levels of internal migration (Greenwood 1997). Thus, if the propensity to migrate of the less educated increases while the rates for other groups remain unchanged or increase at a slower rate, the education–migration gradient will have diminished. According to these hypotheses, cross-national differences in the degree of educational selectivity of migration could be interpreted as reflecting differences in levels of human capital.
or whether the more educated move more, even as the average level of educational attainment increases (White and Lindstrom 2005).
2. Data and methods
We address the question of the educational selectivity of working age migrants by drawing on individual-level census data from the Integrated Public Use Microdata Series-International (IPUMS) database maintained by the Minnesota Population Centre at the University of Minnesota (IPUMS 2017). At the time of writing, IPUMS held census micro sample files for 85 countries, of which 65 included migration data, and 55 of these recorded the urban status of the current place of residence.3 For Turkey, data
was drawn from the Demographic and Health Survey (Hacettepe University 2004). We focus primarily on data from the 2010 census round (2005–2014), but for countries that that did not collect internal migration data at their latest census, such as Argentina, we use data from their previous census. While this means that the data cited for some countries is not the most recent, this approach serves to improve cross-national comparability by comparing the educational selectivity of migrants in countries at different levels of development.
Our sample comprises 18 countries located in Africa, 15 in Asia, 7 in Europe and North America, and 16 in Latin America and the Caribbean, which together encompass over 90 million individual observations that represent more than 65% of the world population.
We have selected countries that measure migration either by comparing place of residence at two points in time (transition data) or by combining duration of residence in the current location with previous place of residence (duration data), which are directly comparable (Bell et al. 2015). While most countries collect migration over a five-year interval, six countries in our sample measure migration over a one-year interval (Canada, Italy, Poland, the United States, Tanzania, and Zimbabwe). In order to capture long-distance migration rather than residential mobility, we use migration between the largest administrative units in each country, which corresponds to states in Brazil, the United States, and Mexico; provinces in China, Mozambique, and Spain; and regions in Cameroon and Morocco. Transition data measure migrant characteristics at the end of the observation period, rather than at the time of migration, so it is not entirely clear whether observed levels of education are a cause or a consequence of migration. In the absence of a comparable longitudinal study for a global sample of
3 Ten countries in IPUMS collect migration data but not urban status, namely Botswana, Cuba, Greece, Italy,
countries, this link cannot be clearly established. However, data on reasons for moving from a range of countries indicate that only a small proportion of long-distance moves among young adults are for educational purposes (UNESCO forthcoming). Thus, migration differentials between educational groups most likely reflect underlying differences in the propensity to migrate, which are a product of their educational status.
For each of the 56 countries in our sample, we fit a series of binomial logistic regressions to individual-level data and define migration as a binary outcome, that is, individuals have migrated or not during the observation period. In model 1, we regress migration against educational attainment classified into four levels – less than primary, primary, secondary, and tertiary education – based on the International Standard Classification of Education of six years of primary schooling, three years of lower secondary schooling, three years of higher secondary schooling, so that exit for secondary education occurs after 12 years of schooling (UNESCO 2011), as constructed in IPUMS. We use less than primary education as the reference category so that odds ratios for primary, secondary, and tertiary education are used as measures of educational selectivity, and we restrict the analysis to individuals aged 20 to 65 years at the time of census. In model 2, we add control variables identified in the literature as significant in shaping migration decisions, namely age, sex, marital status, labour force status, and urban status of current place of residence.
3. Results
We now examine the direction and degree of educational selecitvity by reporting regional and global means for both models. Figures 1a and 1b display population-weighted mean odds ratios for five broad world regions, with error bars representing standard deviations. Results from model 1 in Figure 1a shows that the likelihood of migrating increases significantly with the level of education in all world regions. Globally, compared to individuals with no formal education, those with primary education are 1.7 times more likely to move, those with secondary education 2.1 times, and those with tertiary education 4.2 times. The strength of this gradient is particularly pronounced in Asia and Africa, where individuals with tertiary education on average are about five times more likely to move than individuals with no formal education. The gradient moderates in Europe and North America, where individuals with tertiary education are 4.1 times more likely to migrate. The association is much weaker in Latin America, with a mean ratio of 1.4 for primary education, 1.8 for secondary education, and 2.0 for tertiary education. For all levels of education, standard deviations are smaller in Latin America than in other regions, indicating that the limited educational selectivity of migrants is characteristic of countries across the continent. In other regions, large standard deviations indicate sharper variations between countries in the degree of educational selectivity, particularly for tertiary education.
Figure 1a: Population-weighted mean odds ratios by world region (model 1)
Note: Individuals with no formal education represents the reference category. Error bars represent the standard deviation from the regional mean. 0 2 4 6 8 10
Africa (n=18) Asia (n=15) Europe and North
America (n=7) Latin America (n=16) World (n=56) Primary education Secondary education Tertiary education
Figure 1b: Population-weighted mean odds ratios by world region (model 2)
Note: Individuals with no formal education represents the reference category. Error bars represent the standard deviation from the regional mean.
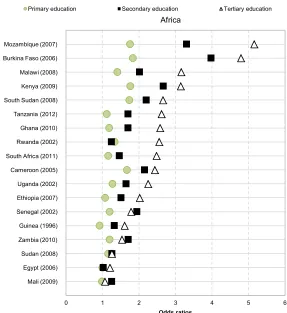
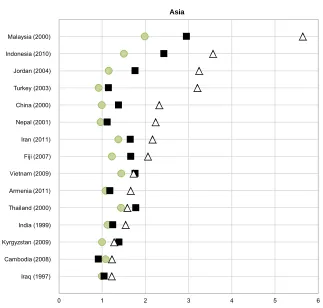
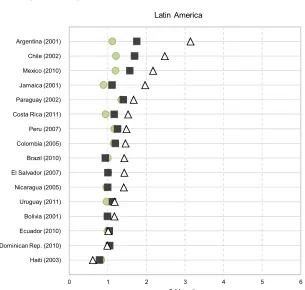
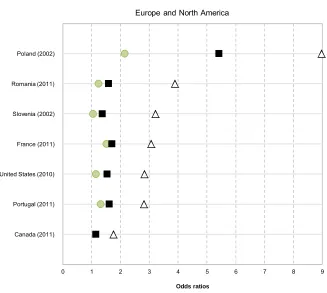
To elucidate cross-national variations in the educational selectivity of migration, Figure 2 reports odds ratios for individual countries grouped into four quadrants by broad region. Care is needed when comparing regions because of the different scales for Europe and North America. The general pattern is one of a positive effect of education on migration. In the 42 countries where odds ratios are statistically significant, the likelihood of migrating increases progressively with each level of educational attainment in a broadly linear fashion. For example in Indonesia, primary education raises the likelihood of moving 1.5 times, secondary education 2.4 times, and tertiary education 3.6 times. In Kenya, the respective odds ratios are 1.8, 2.7, and 3.1, while in Chile the values are 1.2, 1.7, and 2.5. Only Thailand, Vietnam, and Zambia fail to show this linear rise. In the seven countries where primary education is not statistically significant, tertiary education has a higher impact on the odds of migrating than secondary education, confirming that the likelihood to migrate rises with the level of educational attainment, with Kyrgyzstan standing as the sole exception.
0 2 4 6 8 10
Africa (n=18) Asia (n=15) Europe and North
America (n=7) Latin America (n=16) World (n=56)
M
e
a
n
o
d
d
s
ra
ti
o
s
Figure 2: Odds ratios for individual countries (model 2)
Mozambique (2007)
Burkina Faso (2006)
Malawi (2008)
Kenya (2009)
South Sudan (2008)
Tanzania (2012)
Ghana (2010)
Rwanda (2002)
South Africa (2011)
Cameroon (2005)
Uganda (2002)
Ethiopia (2007)
Senegal (2002)
Guinea (1996)
Zambia (2010)
Sudan (2008)
Egypt (2006)
Mali (2009)
0 1 2 3 4 5 6
Odds ratios
Africa
Figure 2: (Continued)
Malaysia (2000)
Indonesia (2010)
Jordan (2004)
Turkey (2003)
China (2000)
Nepal (2001)
Iran (2011)
Fiji (2007)
Vietnam (2009)
Armenia (2011)
Thailand (2000)
India (1999)
Kyrgyzstan (2009)
Cambodia (2008)
Iraq (1997)
0 1 2 3 4 5 6
Figure 2: (Continued)
Argentina (2001)
Chile (2002)
Mexico (2010)
Jamaica (2001)
Paraguay (2002)
Costa Rica (2011)
Peru (2007)
Colombia (2005)
Brazil (2010)
El Salvador (2007)
Nicaragua (2005)
Uruguay (2011)
Bolivia (2001)
Ecuador (2010)
Dominican Rep. (2010)
Haiti (2003)
0 1 2 3 4 5 6
Odds ratios
Figure 2: (Continued)
Note: Individuals with no formal education represents the reference category. Within each region, countries are ranked in decreasing order of odds ratios for tertiary education. No individuals in the primary education category were reported in Canada.
Only six countries report a negative relationship between migration and education. Completion of primary education reduces the likelihood of migration in Guinea, China, and Costa Rica. This tendency is, however, reversed by completion of secondary and tertiary education, both of which have a positive effect in these countries. This broadly corresponds to the J-shaped curve anticipated by Gould (1982), where those with no education or only a few years of schooling have higher migration propensities than those with primary education. In Brazil and Cambodia secondary education has a negative impact, while in Haiti all levels of education reduce the likelihood of migrating. This effect is especially pronounced for tertiary education, which reduces the odds of migrating by nearly 40%.
Poland (2002)
Romania (2011)
Slovenia (2002)
France (2011)
United States (2010)
Portugal (2011)
Canada (2011)
0 1 2 3 4 5 6 7 8 9
Odds ratios
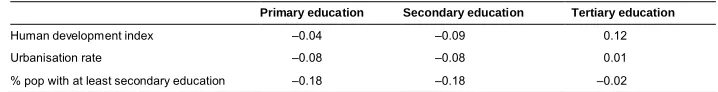
These results provide unequivocal confirmation that the relationship between migration and education holds across the development spectrum. Odds ratios reveal a consistent increase in the likelihood of migration with rising levels of education for countries at all levels human development. Moreover, comparisons across a global sample of countries provide no support for earlier propositions (Gould 1982; Long 1973) that the effect of education on migration diminishes with educational expansion. As is evident from Figure 2, the tertiary-educated remain strongly differentiated from other groups in countries at all levels of development. As Table 1 shows, no association was found between the strength of the educational gradient, as measured by odds ratios, and levels of human development, urbanisation, and educational attainment when correlation analysis was performed.
Table 1: Pearson correlation coefficients between odds ratios (model 2) and national indicators
Primary education Secondary education Tertiary education
Human development index –0.04 –0.09 0.12
Urbanisation rate –0.08 –0.08 0.01
% pop with at least secondary education –0.18 –0.18 –0.02
Note: No coefficient is statistically significant.
4. Discussion and conclusion
Our analysis of 56 countries shows that the positive educational selectivity of internal migrants is a near universal empirical regularity. In all countries except Haiti tertiary education has a positive, statistically significant impact on migration; in 80% of countries both secondary and tertiary significantly increase the odds of migrating, and in nearly 70% of countries all three levels of education raise the likelihood of moving compared with individuals with no formal education. Globally, compared with individuals with no formal education, those with primary education are 1.1 times more likely to move, those with secondary education 1.2 times more likely, and those with tertiary education 2.3 times more likely,ceteris paribus. While we found that migrants in nearly all countries are more educated than stayers, countries vary significantly in the degree of selectivity, and it is the impact of tertiary education on migration that most strongly differentiates countries from one another.
across the development spectrum and are found in all regions, including Africa (Burkina Faso, Kenya, Malawi, and Mozambique), Asia (Indonesia, Jordan, Malaysia, and Turkey), Europe (Poland and Slovenia), and Latin America (Argentina).
The presence of marked differences between and within regions demonstrates that the effect of education on migration behaviour is shaped by the national and local context in which migrants’ lives are embedded. Perhaps migrants respond differently to similar forces in individual national settings. Or perhaps the factors underpinning migration decisions, such as economic returns to migration, wage differentials, and labour market structures, vary from one country to the next in such a way as to alter the role of education in migration decisions.
Other factors that might play a role are differences in geographic size and settlement patterns, which have been found to contribute to cross-national variations in migration intensity and redistribution (Bell et al. 2015). These questions are particularly relevant to neighbouring countries in our sample that differ widely in the degree of educational selectivity, including Canada and the United States, Malaysia and Indonesia, Malawi and Zambia, or Argentina and Brazil.
While it is clearly evident that education stimulates migration, our results provide no information as to its spatial manifestation. The impact of migration on the redistribution of human capital incontestably depends on educational selectivity, but its net effect is also the product of the relative size of flows and counter flows. Recent findings indicate that the redistributive effect of migration on populations is much stronger outside the developed world (Rees et al. 2017). Thus, differences in the spatial imbalance of flows and counter-flows, coupled with variations in migration intensity, when combined with wide variations in educational selectivity suggest that the impact of migration on the redistribution of human capital may differ significantly from one country to the next. Further work is needed to quantify systematically, for a global sample of countries, the impact of internal migration in transforming the distribution of human capital. This would be a logical sequel to the current paper and would represent an important step forward in our understanding of links between migration, education, and development.
5. Acknowledgements
References
Adams, J. and Richard, H. (1993). The economic and demographic determinants of international migration in rural Egypt. The Journal of Development Studies 30(1): 146–167.doi:10.1080/00220389308422308.
Amuakwa-Mensah, F., Boakye-Yiadom, L., and Baah-Boateng, W. (2016). Effect of education on migration decisions in Ghana: A rural-urban perspective. Journal of Economic Studies 43(2): 336–356.doi:10.1108/JES-09-2013-0138.
Bell, M., Charles-Edwards, E., Kupiszewska, D., Kupiszewski, M., Stillwell, J., and Zhu, Y. (2015). Internal migration and development: Comparing migration intensities around the world.Population and Development Review 41(1): 33–58.
doi:10.1111/j.1728-4457.2015.00025.x.
Bernard, A., Bell, M., and Charles-Edwards, E. (2014a). Improved measures for the cross-national comparison of age profiles of internal migration. Population Studies 68(2): 179–195.doi:10.1080/00324728.2014.890243.
Bernard, A., Bell, M., and Charles-Edwards, E. (2014b). Life-course transitions and the age profile of internal migration. Population and Development Review 40(2): 231–239.doi:10.1111/j.1728-4457.2014.00671.x.
Blanchard, O.J., Katz, L.F., Hall, R.E., and Eichengreen, B. (1992). Regional evolutions. Brookings Papers on Economic Activity 1992(1): 1–75. doi:10. 2307/2534556.
Borjas, G.J. (1994). The economics of immigration. Journal of Economic Literature 32(4): 1667–1717.
Catney, G. and Simpson, L. (2010). Settlement area migration in England and Wales: Assessing evidence for a social gradient.Transactions of the Institute of British Geographers 35(4): 571–584.doi:10.1111/j.1475-5661.2010.00400.x.
Cattaneo, C. (2007). The self-selection in the migration process: What can we learn? Castellanza: LIUC University (LIUC Papers in Economics 199).
Courgeau, D., Muhidin, S., and Bell, M. (2013). Estimating changes of residence for cross-national comparison. Population 67(4): 631–651. doi:10.3917/pope. 1204.0631.
Feliciano, C. (2005). Educational selectivity in US immigration: How do immigrants compare to those left behind? Demography 42(1): 131–152. doi:10.1353/dem. 2005.0001.
Ginsburg, C., Bocquier, P., Béguy, D., Afolabi, S., Augusto, O., Derra, K., Odhiambo, F., Otiende, M., Soura, A., and Zabré, P. (2016). Human capital on the move: Education as a determinant of internal migration in selected INDEPTH surveillance populations in Africa. Demographic Research 34(30): 845–884.
doi:10.4054/DemRes.2016.34.30.
Gould, W. (1982). Education and internal migration: A review and report.International Journal of Educational Development 1(3): 103–111. doi:10.1016/0738-0593 (82)90047-5.
Greenwood, M.J. (1975). Research on internal migration in the United States: A survey. Journal of Economic Literature 13(2): 397–433.
Greenwood, M.J. (1997). Internal migration in developed countries. Handbook of Population and Family Economics 1: 647–720. doi:10.1016/S1574-003X(97) 80004-9.
Greenwood, M.J. (2014). Migration and economic growth in the United States: National, regional, and metropolitan perspectives. Cambridge: Academic Press. Greenwood, M.J. and Hunt, G.L. (2003). The early history of migration research.
International Regional Science Review 26(1): 3–37. doi:10.1177/ 0160017602238983.
Hacettepe University and Ministry of Health (2004).Turkey Demographic and Health Survey 2003. Ankara: Hacettepe University Institute of Population Studies. Harris, J.R. and Todaro, M.P. (1970). Migration, unemployment and development: A
two-sector analysis.The American Economic Review 60(1): 126–142.
IPUMS (2017). Integrated public use microdata series: International: Versions 6.5 [dataset]. Minneapolis: University of Minnesota.
Lall, S.V. and Selod, H. (2006). Rural–urban migration in developing countries: A survey of theoretical predictions and empirical findings: Herndon: World Bank Publications.doi:10.1596/1813-9450-3915.
Lucas, R.E. (1997). Internal migration in developing countries. Handbook of Population and Family Economics 1: 721–798. doi:10.1016/S1574-003X(97) 80005-0.
Machin, S., Salvanes, K.G., and Pelkonen, P. (2012). Education and mobility.Journal of the European Economic Association 10(2): 417–450. doi:10.1111/j.1542-4774.2011.01048.x.
Malamud, O. and Wozniak, A. (2012). The impact of college on migration evidence from the Vietnam generation. Journal of Human Resources 47(4): 913–950.
doi:10.3368/jhr.47.4.913.
Massey, D.S., Arango, J., Hugo, G., Kouaouci, A., Pellegrino, A., and Taylor, J.E. (1993). Theories of international migration: A review and appraisal.Population and Development Review 19(3): 431–466.doi:10.2307/2938462.
Massey, D.S. and Espinosa, K.E. (1997). What’s driving Mexico–US migration? A theoretical, empirical, and policy analysis. American Journal of Sociology 102(4): 939–999.doi:10.1086/231037.
Palloni, A., Massey, D.S., Ceballos, M., Espinosa, K., and Spittel, M. (2001). Social capital and international migration: A test using information on family networks. American Journal of Sociology 106(5): 1262–1298.doi:10.1086/320817. Quinn, M.A. and Rubb, S. (2005). The importance of education-occupation matching in
migration decisions.Demography 42(1): 153–167.doi:10.1353/dem.2005.0008. Ravenstein, E.G. (1885). The laws of migration. Journal of the Statistical Society of
London 48(2): 167–235.doi:10.2307/2979181.
Rees, P., Bell, M., Kupiszewski, M., Kupiszewska, D., Ueffing, P., Bernard, A., Charles-Edwards, E., and Stillwell, J. (2017). The impact of internal migration on population redistribution: An international comparison. Population, Space and Place 23(6): e2036.doi:10.1002/psp.2036.
Rendall, M.S. and Parker, S.W. (2014). Two decades of negative educational selectivity of Mexican migrants to the United States.Population and Development Review 40(3): 421–446.doi:10.1111/j.1728-4457.2014.00692.x.
Sjaastad, L.A. (1962). The costs and returns of human migration. The Journal of Political Economy 70(5): 80–93.doi:10.1086/258726.
Todaro, M.P. (1969). A model of labor migration and urban unemployment in less developed countries.The American Economic Review 59(1): 138–148.
UNESCO (2011). International Standard Classification of Education: ISCED 2011. Paris: UNESCO, Institute for Statistics.
UNESCO (forthcoming).Migration, displacement and education: Building bridges, not walls. Paris: UNESCO.
UNFPA (2007). State of the world population in 2007: Unleashing the potential of urban growth. New York: UNFPA.
White, M.J. and Lindstrom, D.P. (2005). Internal migration. In: Poston Jr., D.L. and Micklin, M. (eds.). Handbook of population. Boston: Springer: 311–346.
doi:10.1007/0-387-23106-4_12.
Williams, N. (2009). Education, gender, and migration in the context of social change. Social Science Research 38(4): 883–896.
World Bank (2009). The World Development Report 2009 ‘reshapes economic geography’: Geographical reflections. Herndon: World Bank Publications.