ISSN: 2374-2348 (Print), 2374-2356 (Online) Copyright © The Author(s). 2014. All Rights Reserved. Published by American Research Institute for Policy Development DOI: 10.15640/arms.v2n2a2 URL: http://dx.doi.org/10.15640/arms.v2n2a2
The Modern Mathematics Master's Degree: A Survey of U.S. Programs
S. P. Redmond1, Patricia S. Costello2 & Lisa W. Kay3
Abstract
Unlike other postsecondary degrees in the mathematical sciences, the state of master’s level education has not received much attention. To help examine the practices, format, and requirements of M.S. and M.A. programs in the mathematical sciences in the United States, the authors conducted a nationwide survey in 2013. This article presents the findings of this survey from the institutions whose highest degree offered is a master’s level degree.
Keywords: master’s degree, mathematical sciences, mathematics
With no officially recognized accrediting body, the master’s degree in mathematics has become the forgotten middle child of postsecondary education. With annual reports on doctoral degrees (e.g.,Cleary, Maxwell, & Rose, 2013) and a multitude of studies and recommendations on undergraduate education(e.g.,Bressoud, 2014; Bressoud, Friedlander, & Levermore, 2014), the mathematical master’s degree has garnered little attention. Aside from articles and books that have considered master’s level education across multiple disciplines (e.g., Conrad, Haworth, & Millar, 1993) or applied and professional degrees (e.g.,Marano, Pedersen, Seshaiyer, &Slimowitz, 2003), it appears that the state of the “pure” mathematics degree has not been seriously examined since 1911 (as seen in Curtiss, Kasner, &Lunn, 1911).As related in Waldo, Townsend, and Bolza (1904), a committee was appointed by the American Mathematical Society (AMS) in January 1902 to “consider and report a scheme of requirements for candidates proceeding to their second degree, with mathematics as their major subject.”
1
Department of Mathematics and Statistics, 313 Wallace Building, Eastern Kentucky University, 521 Lancaster Avenue, Richmond, KY 40475.E-mail: [email protected]
2
Patricia S. Costello, Department of Mathematics and Statistics, Eastern Kentucky University
3
The committee subsequently surveyed several major programs of the day across the United States. In a 1911 article in the Bulletin of the American Mathematical Society (Curtiss et al.), a detailed description of contemporary master’s degree programs and the issues facing them is given. It is interesting to note many of the issues mentioned in this article—salaries of instructors, student preparation for graduate work, course load for students, etc.—are still issues of concern in most departments today.
In another 1911 article of the AMS (Bocher, Curtiss, Smith, & Van Vleck, 1911), the master’s degree is described as “commonly given for one year’s graduate work done largely in one subject” and “tested either by course examinations” or “by a single examination covering the whole year’s work.” A thesis is also mentioned as an option, even though it is pointed out that most master’s students will not go on to further study in mathematics.
The common perception is that this model has been followed, with a few adjustments, by most institutions for the past 100 years. But is this truly the case? With the number of institutions offering a master’s degree growing significantly since 1911, what are the current practices of such institutions?
This study follows in the footsteps of the study commissioned in 1902(Waldo et al., 1904) and collected similar data on the nature of the method in which graduate instruction at the master’s level is conducted. This study is meant to examine current practices, not to promote best practices. The focus of the study was institutions whose highest degree awarded in mathematics is a master’s degree. As institutions offering doctoral degrees often have differing practices and attitudes towards the master’s degrees, these schools were excluded from the study. (However, the authors did collect data from programs at these institutions and hope to share their findings in a future publication.)
Method
This list was further sorted into two groups, institutions offering PhDs and institutions offering master’s degrees as their highest degree. Representatives of the programs at these two sets of institutions were sent links to an online survey offered through SurveyMonkey and a letter explaining the survey through e-mail on April 10, 2013. The survey kept track of programs who completed the survey, and the survey authors tracked other programs that responded with updated e-mail addresses or
opted out of the survey. Based on correspondence from the April 10th mailings, the
list of programs to contact was revised. A second request was sent via e-mail on August 5, 2013.
Of the 325 master’s programs and 493 doctoral programs in mathematical sciences who were sent e-mails, 201 institutions consented to participate in the survey. This included 83 institutions offering master’s degrees as their highest degree, and 118 institutions offering PhDs. In this study, the authors chose to examine only the responses from the programs at institutions offering master’s degrees as their highest degree.
The authors further restricted the study to programs which answered the question “Which of the following terms best fits the degree you are describing?” as Mathematics, Mathematical Sciences, or Applied Mathematics. Programs which left the question blank or answered the question as Mathematics Education, Statistics, Computer Science, or Financial Mathematics were not included.In addition, the authors included three programs that answered the question as Other and gave the following three responses: “3 options: Mathematics, Applied Mathematics, and Statistics,” “Actuarial Science, Statistics, Mathematics and Computer Science,” and “Computational Mathematics (Blend of Mathematics, CS, and Statistics).” None of the other programs which answered the question as Other were included.
Results
Fifty-one programsin mathematical sciences whose institutions offer no mathematics degree higher than the master’s responded to the survey; two of these were from the same institution. A little over half of these (27 or 53%) reported being housed in a department of mathematics. Nine respondents (18%) indicated they were in departments of mathematics and statistics, seven (14%) said they were in departments of mathematics and computer science, and eight (16%) were in departments of mathematical sciences or other multidisciplinary departments. A clear majority (40 or 78%) of the programs offered the M.S. (Master of Science) degree, while 11 (22%) offered the M.A. (Master of Arts) degree. As Table 1 indicates, the most common degree name was “Mathematics.”
Table 1: Degree Names
Degree Name No. Programs (% of Programs, n = 51)
Applied Mathematics 9 (17.65%)
Mathematical Sciences 2 (3.92%)
Mathematics 37 (72.55%)
Othera 3 (5.88%)
aTwo of the three “Other” responses appear to be lists of concentrations or options.
The vast majority (46 out of 50, or 92%) of those who responded to the question regarding term structure indicated that their institutions operate on semesters, while a few (4 or 8%) said their institutions have quarters. A slight majority of respondents indicated that the average time to degree for their programs is three to four semesters (four to six quarters). Table 2 summarizes the responses regarding average time to degree.
Table 2: Average Times to Degree
Average Time to Degree No. Programs (% of Programs, n = 51)
2 semesters or less (3 quarters or less) 1 (1.96%)
3 to 4 semesters (4 to 6 quarters) 29 (56.86%)
5 to 6 semesters (7 to 9 quarters) 18 (35.29%)
Very few programs reported average completion times of two or fewer semesters or eight or more semesters. All respondents indicated that their programs required at least 30 semester credit hours; Table 3 summarizes the responses for credit hour requirements.
Table 3: Credit Hour Requirements
No. Credit Hours No. Programs (% of Programs, n = 50)
30 23 (46.00%)
32 7 (14.00%)
33 4 (8.00%)
34 2 (4.00%)
35 1 (2.00%)
36 11 (22.00%)
Variable 2 (4.00%)
Nearly half of the 50 respondents (23 or 46%) said their programs required 30 credit hours. The second most commonly reported number of required credit hours was 36 with 11 responses (22%).
Thirty-eight (75%) of respondents indicated that their programs offer daytime on-campus classes, 38 (75%) indicated that their programs offer evening/weekend on-campus classes, and 9 (18%) indicated that their programs offer online classes. When asked about the format of the majority of the classes associated with their programs, 27 (54%) of the 50 respondents said that the majority of their program’s classes are evening/weekend on-campus classes, 22 (44%) said the majority of their classes are daytime on-campus classes, and 1 (2%) selected online classes.
Table 4: Requirement of GRE for Admission
GRE Required? No. Programs (% of Programs, n = 50)
No 29 (58.00%)
Yes, both general and subject exams 1 (2.00%)
Yes, general only 19 (38.00%)
Yes, subject only 1 (2.00%)
Only two programs reported requiring the subject exam (one subject only, one both general and subject), and over half of responding programs (29 or 58%) indicated that their programs do not require the GRE at all for admission.
Program representatives were also asked about the minimum background an undergraduate student should have prior to admission. Table 5 summarizes the responses to this question; respondents were told to mark all that apply.
Table 5: Minimum Background Needed for Admission
Course No. Programs (% of Programs, n = 50)
Single Variable Calculus 40 (80.00%)
Multivariable Calculus 40 (80.00%)
Introduction to Proof 38 (76.00%)
Linear Algebra 40 (80.00%)
Abstract Algebra 26 (52.00%)
Real Analysis/Advanced Calculus 27 (54.00%)
Differential Equations 22 (44.00%)
Discrete Mathematics 10 (20.00%)
Statistics 11 (22.00%)
Other 11 (22.00%)
Program Requirements
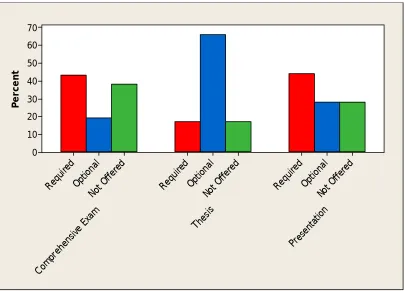
Survey participants were asked about their programs’ requirements. In particular, the survey included questions about core courses, whether non-mathematics courses could count toward the degree, comprehensive examinations, theses, presentations, foreign languages, and other requirements. Figure 1 summarizes responses regarding whether comprehensive exams are required, whether theses are required, and whether presentations are required.
Pres enta tion Thes is Com preh ensiv e Ex
am
Not O ffere d Optio nal Requ ired
Not O ffere d Optio nal Requ ired
Not O ffere d Optio nal Requ ired 70 60 50 40 30 20 10 0 P e rc e n t
Figure 1. Program Requirements—Comprehensive Examinations, Theses, and Presentations
Most responding programs (43 of 50, or 86%) have a list of core or required courses that students must take or a list from which students must choose. The program representatives that reported having such a core were asked further about the types of courses in the core, and 38 of the representatives provided a list of courses. One of the authors categorized the responses, and Table 6 summarizes the results for all core areas that were mentioned at least three times.
Table 6: Core Courses
Core Course Area No. Programs (% of Programs, n = 38)
Real Analysisa 32 (84.21%)
Algebraa 27 (71.05%)
Linear Algebra/Matrix Theory 12 (31.58%)
Complex Analysis 13 (34.21%)
Statistics 8 (21.05%)
Numerical Analysis 6 (15.79%)
Topologya 6 (15.79%)
Seminar 4 (10.53%)
Applied Mathematicsa 3 (7.89%)
Differential Equations 3 (7.89%)
Discrete Mathematics /Graph Theory 3 (7.89%)
Mathematical Modeling 3 (7.89%)
Probability 3 (7.89%)
a
Eight programs also indicated that they require a second semester of real analysis, eight a second semester of algebra, one a second semester of topology, and two a second semester of applied mathematics.
Real analysis and algebra are frequently included in the core, while linear algebra/matrix theory and complex analysis also make regular appearances.
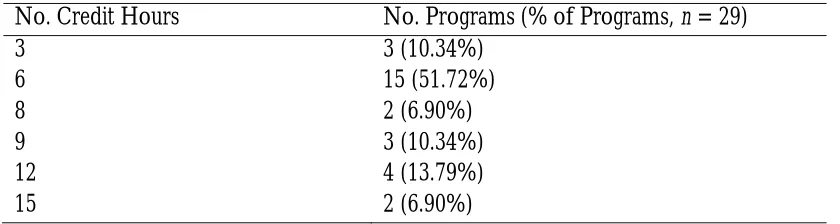
The survey asked for the maximum number of hours outside of mathematics that can count toward the degree in question. Table 7 summarizes the responses to this question.
Table 7: Maximum Number of Hours Outside of Mathematics That Can Be Applied to Degree
No. Credit Hours No. Programs (% of Programs, n = 29)
3 3 (10.34%)
6 15 (51.72%)
8 2 (6.90%)
9 3 (10.34%)
12 4 (13.79%)
15 2 (6.90%)
A slight majority of reporting programs indicated that the maximum number of hours outside of mathematics that can be applied is six. No program reported allowing more than 15 non-mathematics hours.
The authors asked program representatives about comprehensive examinations. Of the 47 survey participants who responded, 20 (43%) said comprehensive exams are required, 18 (38%) said they are not offered, and 9 (19%) said they are optional. Those whose programs have comprehensive exams were asked about the format of the exams; they were asked to mark all that apply. Table 8 summarizes the results.
Table 8: Comprehensive Exam Format
Format No. Programs (% of Programs, n = 29)
Oral, one exam/session 6 (20.69%)
Oral, multiple exams/sessions 0 (0.00%)
Written, one exam 7 (24.14%)
Written, multiple exams/components 22 (75.86%)
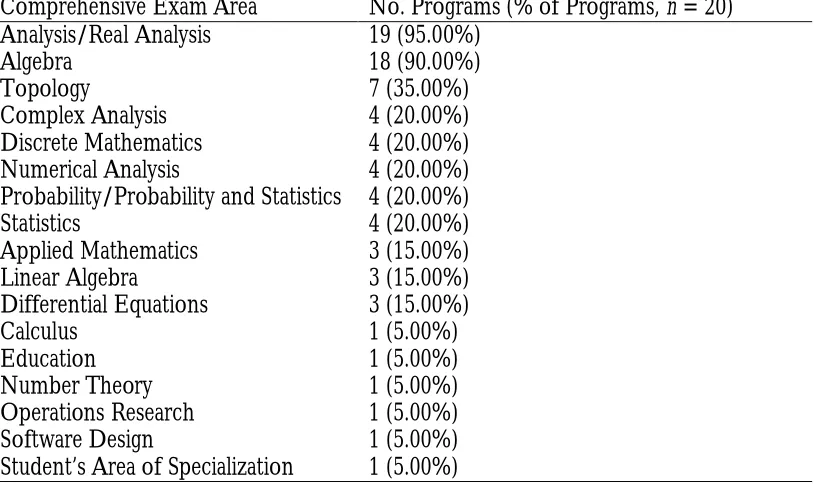
Of the 29 respondents who answered a question regarding comprehensive exam content, 21 (72%) said their comprehensive exams are drawn from a fixed list of subject areas. Survey participants were further asked about what subjects are covered on their programs’ comprehensive exams, and 20 program representatives provided a list of subjects. One of the authors categorized the responses, and Table 9 provides a summary of the results.
Table 9: Comprehensive Exam Areas
Comprehensive Exam Area No. Programs (% of Programs, n = 20)
Analysis/Real Analysis 19 (95.00%)
Algebra 18 (90.00%)
Topology 7 (35.00%)
Complex Analysis 4 (20.00%)
Discrete Mathematics 4 (20.00%)
Numerical Analysis 4 (20.00%)
Probability/Probability and Statistics 4 (20.00%)
Statistics 4 (20.00%)
Applied Mathematics 3 (15.00%)
Linear Algebra 3 (15.00%)
Differential Equations 3 (15.00%)
Calculus 1 (5.00%)
Education 1 (5.00%)
Number Theory 1 (5.00%)
Operations Research 1 (5.00%)
Software Design 1 (5.00%)
Student’s Area of Specialization 1 (5.00%)
Considering the courses given as core courses in the survey responses, it makes sense that real analysis and algebra are the most commonly listed areas for the comprehensive examinations.
Table 10: Number of Comprehensive Exam Subject Areas
No. Areas No. Programs (% of Programs, n = 21)
2 5 (23.81%)
3 5 (23.81%)
4 3 (14.29%)
5 1 (4.76%)
All 2 (9.52%)
Variable 5 (23.81%)
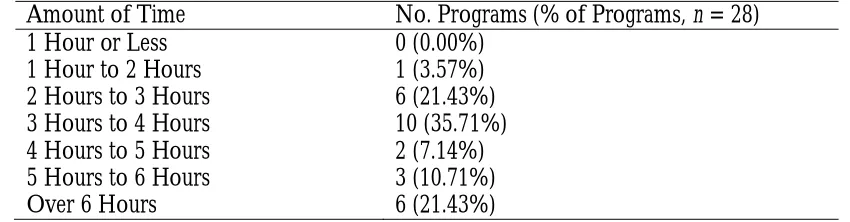
Degree representatives were also asked about the amount of time allotted for exam completion. Table 11 provides a summary of the results.
Table 11: Total Amount of Time Allotted for Students to Complete All Comprehensive Examination Parts
Amount of Time No. Programs (% of Programs, n = 28)
1 Hour or Less 0 (0.00%)
1 Hour to 2 Hours 1 (3.57%)
2 Hours to 3 Hours 6 (21.43%)
3 Hours to 4 Hours 10 (35.71%)
4 Hours to 5 Hours 2 (7.14%)
5 Hours to 6 Hours 3 (10.71%)
Over 6 Hours 6 (21.43%)
While the most commonly reported amount of time allotted for comprehensive exams was three to four hours at 10 (35.71%), nontrivial proportions reported two to three hours (6 or 21.43%) and over 6 hours (6 or 21.43%).
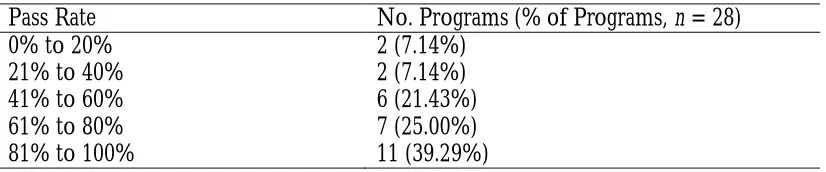
Table 12: Estimated First-Attempt Pass Rates for Comprehensive Exams
Pass Rate No. Programs (% of Programs, n = 28)
0% to 20% 2 (7.14%)
21% to 40% 2 (7.14%)
41% to 60% 6 (21.43%)
61% to 80% 7 (25.00%)
81% to 100% 11 (39.29%)
A majority (64%) of responding programs have estimated first-attempt pass rates above 60%, while only a few (4 or 14%) reported estimated rates of 40% or lower.
The authors also asked program representatives about theses. Of the 47 survey participants who responded, 31 (66%) said theses are optional, 8 (17%) said they are not offered, and 8 (17%) said they are required. Those whose programs have theses were asked to select the category that best describes the theses defended in the past three years. Table 13 summarizes the results.
Table 13: Types of Theses Defended in Past Three Years
Category No. Programs (% of Programs, n = 38)
Original work only 5 (13.16%)
Original work is expected but detailed expository work is sufficient
26 (68.42%)
Nearly 100% are expository 7 (18.42%)
The majority of theses are nontraditional (computer programs, modeling, etc.)
0 (0.00%)
A clear majority (68%) reported that, while original work is expected, detailed expository work is sufficient. No program representatives indicated thatthe majority of recent theses in their program were nontraditional.
Table 14: Delivery of Presentations
Presentation Format No. Programs (% of Programs, n = 33)
At a regional or national professional meeting or conference
9 (27.27%)
As part of a university or department colloquium or seminar
27 (81.82%)
Poster or expository paper 8 (24.24%)
Othera 5 (15.15%)
a
Although the first question about the required presentation asked about required presentations that are not part of a class or comprehensive exam or thesis, two of the five respondents who marked “Other” indicated that the presentation is part of a defense.
Respondents were asked to describe how the presentations are assessed. Most of the responses indicated that a committee assesses the presentation.
All 47 program representatives who answered a question regarding foreign language requirements indicated that a foreign language is not required for degree completion. Of the 47 respondents who answered a question about whether competency in technology that is not part of a course must be demonstrated, 44 indicated that it is not required. Two of the three respondents who said that competency in technology is required mentioned use of LaTeX as part of their requirements.
Unique Features and Strengths of Programs
Program representatives were asked to describe unique features of their programs, and 31 of them responded. Four respondents claimed their programs are flexible (one of these mentioned that they attract quite a few online students), and a couple indicated they were rigorous. (Note that one institution said they were both flexible and rigorous, so they are counted among the four “flexible” and two “rigorous” responses.) Two referred to their teaching approach (one inquiry-based methods, the other the Moore method). Three noted that their graduate students get the opportunity to teach (two of these specified “remedial” classes). Some program representatives referred to specific areas, some referred to research opportunities, some noted requirements that they have, and some mentioned that they are small or offer individual attention. Several described the multidisciplinary nature of their programs. One institution (besides the ones geared toward teachers) said they catered to part-time students who work full-time. Interestingly enough, three respondents said there was nothing unique about their programs.
Discussion
While it cannot be assumed that the programs who responded to this survey are representative of all master’s programs that serve as the highest program in mathematical sciences offered at their institutions, the responses to this survey may provide some insight into the current state of master’s programs in the mathematical sciences in the United States. The survey results paint a picture of variety in terms of program requirements and courses offered.
Most responding programs operate on semesters, and most indicated that the average time to degree for their programs is three to six semesters (four to nine quarters). Almost half of responding programs require 30 semester credit hours for degree completion, and nearly a quarter of the programs require 36 semester credit hours. Daytime on-campus classes and evening/weekend on-campus classes are common among surveyed programs; online classes are no longer unusual but are not the norm yet either.
Requiring comprehensive examinations is no longer the norm among the surveyed programs, and allowing an optional thesis to count toward degree requirements is common. Those who have comprehensive exams reported a variety of topics covered, although analysis and algebra seem to be staples, and written exams with multiple parts are typical.
References
Bocher, M., Curtiss,D. R., Smith, P.F., &Van Vleck,E.B. (1911). Graduate work in mathematics in universities and in other institutions of like grade in the United States. Bulletin of the American Mathematical Society, 34, 122-137.
Bressoud, D.(2014). STEM-oriented societies call for collective action.MAA Focus, 34(2), 10-11.
Bressoud, D., Friedlander, E. M.,&Levermore, C. D. (2014). Meeting the challenges of improved postsecondary education in the mathematical sciences.MAA Focus, 34(1), 15-16.
Cleary, R., Maxwell, J. W., &Rose, C. (2013).Report on the 2011-2012 new doctoral recipients.Notices of the American Mathematical Society, 60, 874-884.
Conrad, C. F., Haworth, J. G.,&Millar, S. B. (1993).A silent success: Master’s education in the United States. Baltimore and London: The Johns Hopkins University Press.
Curtiss,D.R.,Kasner, E.,&Lunn,A.C. (1911). University courses in mathematics and the master’s degree.Bulletin of the American Mathematical Society, 17, 230-249.
Marano, L. E., Pedersen, K., Seshaiyer, P., & Slimowitz, J. (2003). The professional master’s degree.Math Horizons, 10(3), 14-18.