Reservoir Studies Using Seismic Attributes and Well log and Well log Analysis of Y
Field, Niger Delta
Adiela, U.P
1and Oyekan Hafeez Kayode
21Department of Petroleum Engineering,, Nigerian Agip Oil Company, Port Harcourt.
2Department of Geology, University of Port Harcourt, Port Harcourt, Nigeria
Article Received: 30 November 2017 Article Accepted: 27 January 20178 Article Published: 26 March 2018
1. INTRODUCTION
Exploration geophysics, subsurface structures and properties of interest include: the reservoir architecture, porosity,
fluid Saturation, lithology and permeability. In the procedure for subsurface property modeling, it is usual that
geophysicists first provide spatial distribution of seismic attributes from observed seismic record. Seismic attributes can
be used for both quantitative and qualitative purposes. Quantitative uses include prediction of physical properties such
as porosity or lithology (Leiphart and Hart, 2001; Sagan and Hart, 2006). Qualitative uses include detection of
stratigraphic and structural features. Then from the derived seismic attributes, we can evaluate and estimate subsurface
properties of interest using physical theories, statistical methods and geological model, along with well-log data.
However, uncertainty in seismic interpretation may arise because of many inevitable causes: inconsistent acquisition
conditions, lateral velocity variation, poor resolution of data, limited availability of data, insufficient geologic
knowledge and many others.
The internal architecture of the “Y” field fluvial reservoirs along with structural complexity caused by growth faults may
result in bypassed reservoirs or compartments with additional reserves. This work basically entails the use of integrated
3D seismic and well logs to enhance oil and gas recovery in the basal part of the Agbada Formation.
2. OBJECTIVES
This research is aimed at evaluating the reservoir potential of Y-field with limitation to the available data primarily to
achieve the following objectives:
To identify and quantify hydrocarbons in the reservoirs sand bodies.
To determine the petrophysical characteristics of sand bodies
A B S T R A C T
This study demonstrated the effectiveness of 3-D static modeling technique as a tool for better understanding of spatial distribution of discrete and
continuous reservoir properties, hence, has provided a framework for future prediction of reservoir performance and production behavior of the
reservoirs. However, wells should be drilled within the identified prospect areas to enhance optimization of the reservoir.
3. LITERATURE REVIEW
The Niger Delta basin has been intensively studied, mostly by the oil industry and academia in recent time because
of its economic value as a petroliferous province. Most of the workers have investigated and summarized the basic
geology, evolution and structural setting, sequence stratigraphy, biostratigraphy, lithology and depositional
environment of the basin. Other studies include production characteristics and field development strategies. Some
of the workers and their contributions about the Niger Delta are discussed below.
Reyment (1965) and Hosper (1965) described the basement configuration of the Niger Delta on the basic of
geophysical data. They suggested that the bulk of the younger Tertiary portion of the delta sequence overlies
Cretaceous oceanic crust.
Allen (1965) observed that the modern Niger Delta is a combination of a wave and tide-dominated delta, whose
geometry is actuate – estuarine – irregular.
Studies carried out by Stoneley (1966), Short and Stauble (1967), Wright (1968 & 1970) and Merki (1972) showed
that differential loading of under compacted shales at the base of the Tertiary Delta initiated the formation of
growth faults in Niger Delta sediments.
The stratigraphy, sedimentology and palaeontology of the Niger Delta have been intensively carried out and
described by various workers. Allen (1965) divided the Niger Delta into six first orders super–environments, each
made of second order environments. These in turn were made up of third order sub-environments. Reyment (1965),
Frank and Cordry (1967), Short and Stauble (1967), Murat (1970), Adeleye (1975), Weber and Daukoru (1975)
have described the stratigraphy and palaeogeography of the Niger Delta.
Moreover, Short and Stauble (1967) subdivided the upper Tertiary Delta Complex into three megafacies that are
strongly diachronous and designated them as Akata, Agbada and Benin Formation from the base to top. Weber
(1971) also described the Delta as a site of cyclic sedimentation, and showed the relation between sedimentation,
growth faults and depositional environments on the petrophysical properties of the rocks. Avbovbo (1978), in
re-describing the lithostratigraphic units showed that the sediment deposition moved southwards in line with
general progradation of the Delta.
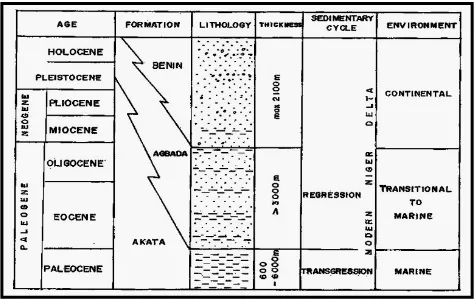
4.STRATIGRAPHYOF NIGERDELTA
The Akata Formation is the under compacted, over pressured, marine prodeltamegafacies of the Niger Delta
basin. It is composed mainly of marine shale with occasional turbidite sandstone and siltstone (Short and Stauble,
sources rock of the Niger delta complex. Abundance of planktonic foraminifera assemblage indicates deposition of
the Akata shale on a shallow marine environment (Whiteman 1982).
Figure 1.Stratigraphic section of the Niger Delta adopted from Doust, 1990
The Agbada Formation underlies the Benin formation and consists of interbeded fluviomarine sands, sand stones
and siltstone of various proportion and thickness representing cyclic sequence of off lap unit (Weber, 1971).
Texturally the sandstone vary from coarse to fine grained, poorly to very well sorted, unconsolidated to slightly
consolidated. Lignite streak and limonite coating occur with some shell fragment and glauconitic (Short and
Stauble, 1967). The shale are medium to dark grey, fairly consolidated and silty with localized glauconitc.
Shaliness increases downward and the formation passes gradually into the Akata formation
The Benin Formation is the Topmost unit, composed of fluviatile gravel and sands. It is described as the coastal
plain sands which outcrop at Benin, Onitsha and Owerri province and elsewhere in the Delta area (Reyment, 1965).
The deposit is predominantly continental in origin and consist of massive, highly porous, fresh water bearing
sandstones with little shale intercalation which increases toward the base of the formation.
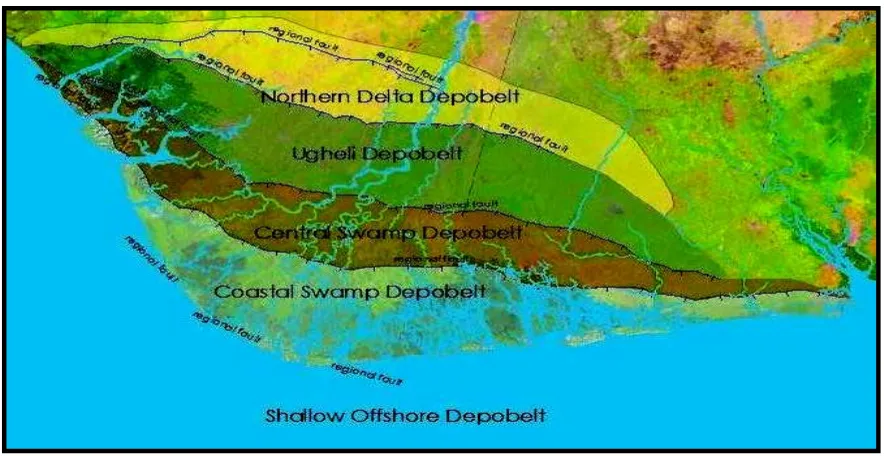
Niger Delta Depobelts and Structures
Various integrated studies have shown that several “Depobelts‟‟ exist in the Niger Delta basin which are separated
by major synsedimentary fault zones that occurred in response to variable rates of subsidence and sediment supply
The “Depobelts‟‟ include:
Northern Delta
Greater Ughelli
Central Swamp
Coastal Swamp
Shallow Offshore
Deep Offshore
These Depobelts can be thought of as transient basinal areas succeeding one another in space and time as the delta
prograded Southward. When further subsidence of the basin could no longer be accommodated the focus of
sediment deposition shifts seaward forming a new depobelt (Doust and Omatsola, 1990). At the same time
synsedimentary and most post-sedimentary faulting would cease within the abandoned depobelt. Therefore,
Depobelts form the structural and depositional active portion of the delta at each stages of its development (Doust
and Omatsola, 1990; Tuttle et al., 1999).
Figure 2. Schematic diagram of the Niger Delta showing the Depobelts and the regional faults (Modified from
Doust and Omotsola, (1990) and Stacher (1995).
5. METHODOLOGY
Geophysical well logging is the recording of the properties or characteristics of the rock formations transversed by
measuring apparatus in a borehole, which largely obviates the necessity of the expense of coring. Casing was
introduced into the borehole section immediately after drilling to prevent the collapse of the wall rocks in the
borehole section lined pipe. Generally, any of the normal geophysical techniques can be adapted in borehole
logging. The most commonly used is the techniques are electrical resistivity, electromagnetic induction, and
self-potential (SP), natural and induce radioactivity, sonic velocity and temperature.
Onshore
The instrumentation necessary for borehole logging is housed in a cylindrical metal tube known as sonde. Sondes
are suspended in the borehole from an armored multi-core cable. During logging, the sonde is gradually pulled up
from the borehole bottom at a certain speed.
6. DESCRIPTION OF WIRELINE LOGS USED
The different logs used for the research work are Gamma ray log, Resistivity logs, Compensated Bulk Density log
and Porosity log. The wireline logs were used in the interpretation and calculation of the various functions and
parameters of the reservoir sands as described below.
Gamma ray logs Shale usually contains small quantity of radioactive elements such as uranium (U) potassium (k)
and thorium (TH). This produces gamma ray radiation from which the source can be detected by spectrometry. The
log thus, detects shale horizon and can provide an estimate of the clay content and other sedimentary rocks.
Amongst, the sediments, shales have by far the strongest radiation. That is why the log is called “Shale Log”.
Gamma ray logs are usually expressed in API units. API is defined as 1/200 of the response generated by
calibration standard, which is an artificial formation containing precisely known qualities of the three (3)
radioactive elements, maintained by the American Petroleum Institute (API), Houston Texas.Shale–free sandstones
and carbonates have low concentrations of radioactive materials and give low gamma ray readings. GR logs are
usually recorded in track 1 with its scales chosen locally, but 0-100 or 0-150 API is common. It can be measured in
both open and cased holes.
Resistivity logs Resistivity is the specific resistance of a material to the flow of current (inverse of
conductivity). The resistivity of a formation depends on the electrical conductivity of the rock material within the
formation, the nature of formation water (fresh orsalt water), other fluids like oil or gas contained in it, the porosity
and tortuosity of the formation.
Generally, resistivity is high in porous rocks containing oil, gas or even fresh water because these fluids are
insulators. Oil and gas produce much higher kicks on the resistivity log and gas higher than that of oil kicks. Porous
rocks containing salt water (electrolyte) have low resistivity because it is conductive. Clay produces no kick on the
resistivity curve; the portion on the log with no resistivity kick is thus definitely shale and this is known as the shale
line. Resistivity is measured in ohm- metres square per metre i.e. ohm –m2/m or Ωm2 m or Ωm. The logs are
normally plotted on a logarithmic scale either in track 2 alone or tracks 2 and 3. The ranges of values plotted are
usually 0.2 -20 Ωm2 m-1 for track 2 alone, while 2 and 3 is 0.20 – 2000 Ω m2 m-1.
7. RESULTSANDDISCUSSION
Petrophysical evaluation A reservoir is a subsurface rock that has effective porosity and permeability which
determine its capability to both store and transmit fluid. Hence, characterization deals with the determination of
reservoir properties/parameters such as porosity (Φ), permeability (K), fluid saturation, Net-to-gross among others.
Net-to-gross ratio The gamma ray log was used to estimate the Net-to-gross ratio, by first determining the gamma
ray readings of clean sand in the formation, using the formula:
N/G= Σhi = Net reservoir
H Gross reservoir (Asquith, 1994)
N/G = 80%
Estimation of Porosity
Computation of porosity was done using Wyllie equation (1956) to estimate the density derived porosity. The
density derived porosity ØD was calculated using the formula:
(Wyllie Equation, 1956)
Taking different points from the density log in the reservoir i.e. 1, 2, 3, = 2.65 gcc and = 0.9 gcc (oil).
ØD = 25%
Estimation of Permeability is a measure of the ease with which a fluid (hydrocarbon and water in this case) can move
through a porous rock.
K = 307 + 26552ϕ2 − 34540(ϕ x Sw)2 (Owolabi et al., 1994).
K = 1,352 md
Estimation of Water Saturation
Water saturation (Sw) determination is the most challenging of petrophysical calculations and it‟s used to quantify its
more important complement, the hydrocarbon saturation (1 – Sw).
Sw is the value in percentage of the pore volume in a rock occupied by the formation water. Determination of water
saturation for the uninvaded zone was achieved by using the Udegbunam et al. (1988) equation given below:
Sw = 0.082
(Udegbunam et al., 1988) Where: Water saturation, Sw = 32.8%, Ø= PorosityEstimation of Hydrocarbon Saturation {SH}
This was obtained directly by subtracting water saturation from 1.
Thus, SH = 1 – Sw
Estimation of Volumetric Hydrocarbon Reserve
The fluid contacts were delineated for the reservoirs from the neutron-density cross-plot across the reservoir from the
OAK-7 well. The hydrocarbon-water contact (HWC) was at the depth of 7509ft (TVDSS).
Therefore, the reserve for hydrocarbon was estimated using the relation
Nf = (Asquith, 1994)
Where, Nf = volumetric recoverable oil reserve in stock tank barrel (STB)
7758 = barrels per area foot A = drainage area in acres
h = reservoir thickness in ft = porosity in decimal
SH = hydrocarbon saturation in decimal Rf = recovery factor = 0.42 (for oil)
Boil =oil formation volume factor Boil =
GOR (gas-oil ratio) =
Nf = 136,000,000 STB (stock tank barrels).
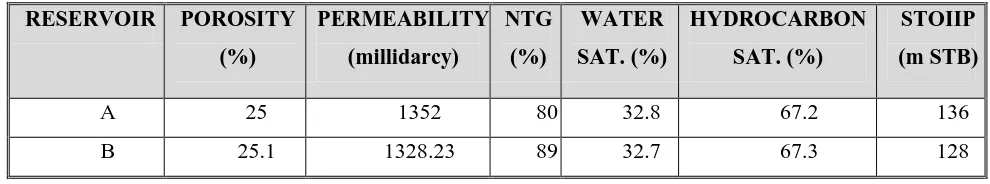
Above calculation shows the reservoir A petrophysical properties estimation, this same process was applied in obtaining
the petrophysical and volumetric parameters for reservoir B as shown in table
Table 1: Average Petrophysical properties for Reservoir A and B.
RESERVOIR POROSITY
(%) PERMEABILITY (millidarcy) NTG (%) WATER SAT. (%) HYDROCARBON SAT. (%) STOIIP (m STB)
A 25 1352 80 32.8 67.2 136
B 25.1 1328.23 89 32.7 67.3 128
Property Modeling Using Seismic Attributes and Well logs
Property modelling is the applied science of creating computerized representations of portions of the Earth's crust based
on geophysical and geological observations made on and below the Earth surface. A property model is the numerical
equivalent of a three-dimensional geological map complemented by a description of physical quantities in the domain of
interest.
8. FACIES MODEL
The term facies is used either descriptively, for a certain volume of sediment, or interpretatively for the inferred
depositional environment of that sediment. From the model in figure 3, the facies are divided into fine sand, coarse sand
occurrence of shale, colored grey and fine sand, colored brown. This model aided the understanding of the sedimentary
environments. The eastern flank of the reservoir denotes a good prospect due to the high occurrence of coarse sand
Figure 3: Facies Model for Reservoir A and B.
Net-to-Gross Model
Net-to-gross (NTG) is the measure of the reservoir volume occupied by hydrocarbon-bearing rocks. It shows the volume
of shale present in the reservoir. Net-To-Gross was modeled along the reservoirs in the wells using Petrel software. It is
expressed between 0 and 1, or as a percentage between 0 and 100%. Figure 4 depicts high volume of hydrocarbon bearing
rock (red/yellow coloration). The eastern flanks of the reservoirs denote a good prospect evident from their high
net-to-gross value.
Porosity Model
Porosity is a measure of the void (i.e., "empty") spaces in a reservoir, and it is a measure of the volume of voids over the
total volume, between 0 and 1, or as a percentage between 0 and 100%. The porosity of the rock played an important role
when attempting to evaluate the potential volume of water or hydrocarbons in the reservoir.
The eastern flanks of the reservoirs denote a good prospect evident from their high porosity value (red/yellow
coloration)
Figure 5: Porosity Model for Reservoir A and B.
Frequency Attribute Model
Technically, each individual frequency or band of frequencies could be considered an attribute. The seismic data was
filtered at various frequency ranges in order to show certain geological patterns that may not be obvious in the other
frequency bands. There is an inverse relationship between the thickness of a rock layer and the corresponding peak
frequency of its seismic reflection. That is, thinner rock layers are much more apparent at higher frequencies and thicker
rock layers are much more apparent at lower frequencies. This was used to qualitatively identify thinning or thickening
of a rock unit in different directions as shown in figure 6. Frequency attribute has also been widely used as a direct
hydrocarbon indicator based on the time-frequency seismic character of the hydrocarbon sand (Adepoju et al. 2013).
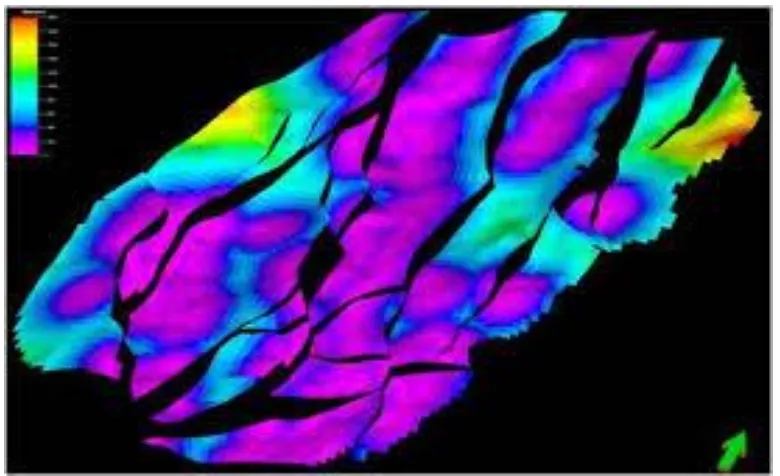
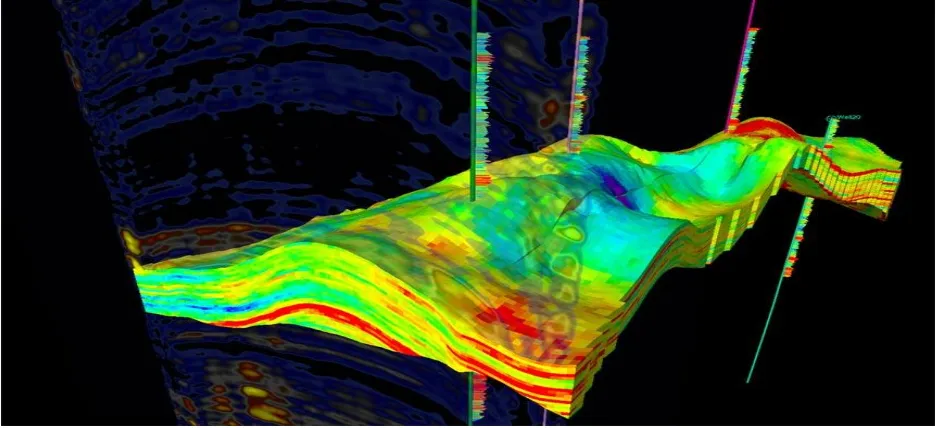
Root Mean Square Amplitude Surface Map
Root Mean Square Amplitude extraction was carried out on reservoir A and B level where the reservoir can be
confidently identified on the seismic data from the well-synthetic tie. Amplitude anomalies exist at all levels where it
was possible, both within the field itself and the surrounding areas. These anomalies are of two types: those that conform
to structure, and those that appear to be appraisal i.e. doesn‟t conform to any structure. Amplitude being a seismic
attribute was superimposed on the time structure map of horizon A and B to check its conformity to structure. Amongst
the different types of amplitude which can be extracted (maximum positive and negative, average positive and negative
e.t.c.), root mean square amplitude was chosen because of its unique characteristics as a good indicator of the presence
of hydrocarbon (Mangal et al. 2004). R.M.S amplitude is obtained by summing all the square of all the amplitudes of the
reflection and calculating the roots of the cumulative; high amplitudes with respect to amplitude distribution are direct
hydrocarbon indicators (Mangal et al. 2004).
The areas of high amplitude are within the closures which conform to the structure and this further confirms the presence
of hydrocarbon (Mangal et al. 2004). The high amplitude is seen as the grey to yellow/red coloration. Also, a new
prospect was discovered in the North-eastern part of the study
The quest for optimum method of hydrocarbon production has been an issue which many oil and gas companies are
interested in. Alvarado and Manrique (2010) have stated that the effort of industries to increase production by the use of
large capital investments to enhance oil recovery sometimes prove futile. One of the major ways of resolving this issue is
through hydrocarbon reservoir properties modeling.This study has been carefully and thoroughly carried out in aspects
focusing mainly on reservoir modeling of “Y” field, Niger Delta using an integrated Seismic approach and well log
analysis.
In the oil and gas industry, reservoir modeling involves the construction of a computer model of a petroleum reservoir,
for the purposes of improving estimation of reserves and making decisions regarding the development of the field. A
reservoir model represents the physical space of the reservoir by an array of discrete cells, delineated by a grid which
may be regular or irregular. The Niger Delta region is situated in Southern Nigeria between latitudes 4° and 7° N, and
Ekweozor and Daukoru, 1994); this system is referred to here as Tertiary Niger Delta (Akata-Agbada) Petroleum
System. The established Tertiary sequence in the Niger Delta consists, in ascending order, of the Akata, Agbada, and
Benin Formations.
The interpretation was carried out on a workstation using the PETRELTM work flow tool. The suite of materials used in
carrying out the Reservoir modeling of Y” Field include: Base map of „Y‟field, Well header, five composite well Logs,
Seismic volume and Check-shot survey data.
3-D structural interpretation of the seismic data was used to give an overview of the reservoir-trapping configuration in
“Y” field. As one of the major objective of the work, the depth structure maps were produced for closures or structures
that possess efficient trapping system suitable for hydrocarbon accumulation, development and production. The
property models were used to show the numerical equivalent of a three-dimensional geological map complemented by a
description of physical quantities in the domain of interest.
REFERENCES
[1] Adepoju Y.O., Ebeniro J.O. and Ehirim C.N. 2013. DHI Analysis Using Seismic Frequency Attribute On
Field-AN Niger Delta, Nigeria. IOSR Journal of Applied Geology and Geophysics (IOSR-JAGG) e-ISSN:
2321–0990, p-ISSN: 2321–0982.Volume 1, Issue 1 (May. –Jun. 2013), PP 05-10.
[2] Adepoju Y.O., Ebeniro J.O. and Ehirim C.N. 2013. DHI Analysis Using Seismic Frequency Attribute On
Field-AN Niger Delta, Nigeria. IOSR Journal of Applied Geology and Geophysics (IOSR-JAGG) e-ISSN:
2321–0990, p-ISSN: 2321–0982.Volume 1, Issue 1 (May. –Jun. 2013), PP 05-10.
[3] Curtis D.M. 1970. Miocene deltaic sedimentation, Louisiana Gulf Coast: Deltaic sedimentation modern and ancient,
edited by Morgan, J.P., Soc. Econ. Paleontologists and Mineralogists, Special Publication No. 15.
[4] Ekweozor C.M. and Daukoru E.M. 1984. Petroleum source bed evaluation of Tertiary Niger Delta: American
Association of Petroleum Geologists Bulletin, vol. 64, p. 1251-1259.
[5] Hatcher R. D. 1995. Structural geology principles, concepts and problems second edition: Prentice-Hall, Inc. USA,
.525p.
[6] Kulke H. 1995. Nigeria. In Regional Petroleum Geology of the World. Part II: Africa, America, Australia and
Antarctica, H. Kulke, editor. Gebrüder Borntraeger, Berlin, Germany, pp. 143-172.
[7] Nwachukwu J.I. and Chukwurah P.I. 1986. Organic matter of Agbada Formation, Niger Delta, Nigeria: American
[8] Nwachukwu J.I. and Odjegba E.T. 2001. Compaction in Reservoir sandstones of the Niger Delta, Nigeria. Journal of
Mining and Geology,37 2): 113 - 120.
[9] Orife J.M. and Avbovbo A. 1982. Stratigraphic and unconformity traps in the Niger Delta, in T. Halbouty, ed., the
deliberate search for subtle trap: American Association Petroleum Geologists Memoir, 32:251-265.
[10] Owolabi O.O., Longjohn T.F. and Ajienka J.A. 1994. An empirical expression for permeability in unconsolidated