Increasing convergence rate in two-objective optimization of
water distribution network with engineering judgment
Fariba Sherri1, Amir Hossein Mahvi2*, Abbas Toloie Eshlaghy3, Amir Hessam Hassani1
1Department of Environmental Engineering, Faculty of Natural Resources and Environment, Science and Research Branch, Islamic Azad University, Tehran, Iran
2Department of Environmental Health Engineering, School of Public Health, Tehran University of Medical Sciences, Tehran, Iran 3Department of Industrial Management, Faculty of Management and Economic, Science and Research Branch, Islamic Azad University, Tehran, Iran
Abstract
Background: Water distribution networks (WDNs) are facilities that require massive investment and their optimization is very important. This study aimed to optimization and development of models for promoting WDNs with using engineering judgment. In this method, instead of controlling all system states, it is possible to search the optimal set of options based on engineering judgment and hydraulic and physical status of the system. Thus, the time to solve the optimization problem is greatly reduced, which is very important in widespread networks with many components. The case study was a WDN in western Tehran.
Methods: To reduce the calculation size and increase the convergence rate using engineering judgment, the parts of the network where there was no possibility of parallel piping was ignored. For other parts with a low pressure problem, parallel piping was defined. A FMGA and WaterGEMS hydraulic software were used to optimize the WDN. Cost minimization and pressure benefit maximization were the objective functions and the diameters of the pipes were considered to be the decision variables.
Results: The results of optimization the network showed that, the cost decreased 89.84% and the pressure in all nodes, except one node, reached within the standard range (26-60 mH20). It included 2387 m of pipe with diameters of 100, 150, 200, 250, 350, 400 and 500 mm.
Conclusion: The results of optimization and modification of the network using engineering judgment confirm that the cost decreased significantly and the pressure level in all the nodes increased to above the allowable minimum pressure.
Keywords: Water, Judgment, Software, Pressure, Engineering
Citation:Sherri F, Mahvi AH, Toloie Eshlaghy A, Hassani AH. Increasing convergence rate in two-objective optimization of water distribution network with engineering judgment. Environmental Health
Engineering and Management Journal2018; 5(3): 143–151. doi: 10.15171/EHEM.2018.20. *Amir Hossein MahviCorrespondence to: Email: [email protected] Article History:
Received: 14 May 2018 Accepted: 25 July 2018
ePublished: 18 August 2018
Introduction
A water distribution network (WDN) is an important component of citizen welfare (1). It handles the transfer of water from a reservoir to the consumer and consists of a water supply, consumers, distribution pipes, valves and pumps. This infrastructure provides the basic needs of a society (2,3). Researches are interested in the optimization of WDNs (4). and have used the evolutionary algorithms such as the genetic algorithm (GA) (5,6), ant colony optimization (ACO) (7,8), shuffled frog leaping algorithm (SFLA) (9,10), simulated annealing (SA) (11), honey-bee mating optimization (HBMO) (12), harmony search algorithm (HS) (13,14) and particle swarm optimization (PSO) (15,16). These algorithms do not require calculation of the derivative of the objective function, but the probability of finding a global optimum solution is more
than the classic algorithms (17). The problems raised in WDNs are highly complex, so traditional optimization methods used to solve them are time-consuming and require a large amount of computation memory. This has decreased the efficiency of traditional optimization methods. Because WDNs are large-scale and have a large number of variables, evolutionary algorithms are preferred because they take less time to solve the problem (4). Even Fuzzy logic has been used for assessment of water quality in WDNs (18). Many real-world engineering problems are multi-purpose and usually conflict. To find an optimal response in such cases is not possible. In these cases, a set of solutions must be found that can establish the relative balance between different objectives. This set of solutions, known as the Pareto front, allows the designer engineer to choose one solution according to the specific conditions. Environmental Health
Engineering and Management Journal HE
M J
© 2018 The Author(s). Published by Kerman University of Medical Sciences. This is an open-access article distributed under the terms of the Creative Commons Attribution License (http://creativecommons.org/licenses/by/4.0), which permits unrestricted use, distribution, and reproduction in any medium, provided the original work is properly cited.
Original Article
Open AccessSherri et al
Environmental Health Engineering and Management Journal 2018, 5(3), 143–151 144
When faced with multi-objective optimization, classic optimization methods are inefficient for three major reasons. First, most cannot find several solutions in a single run. In addition, multiple applications of these methods do not guarantee the generation of widely different Pareto optimal solutions. Finally, most of them are not efficient in multi-objective optimizations that deal with discrete variables (19).
Seyoum et al used a penalty-free multi-objective evolutionary optimization to solve a real life network (20). Wang et al evaluated low and high level hybrid algorithm on optimization of WDNs. They compared the number of runs, convergence and diversity to detect the final solution (21). Tang et al used multi-objective analysis to reveal the benefits of water transfer between two reservoirs (22). In many of these methods, single-objective optimization is used to minimize the cost of pipes as the target. Some studies also have focused on the reliability and stochastic modeling of the demand (23,24).
Walski stressed the need to develop new models based on minimization of network costs and maximization of net profits (25). Halhal et al were the first ones who optimized WDN using a multi-objective GA. They minimized cost and maximized profit using a structured messy genetic algorithm (SMGA) to solve the optimization problems (26).
Walters et al used the SMGA to optimize the “anytown” distribution network (27). Prasad and Park optimized a two-loop reference network using a multi-objective GA. Their objective functions involved decreased the cost and increased the reliability of the network (19).
Although optimization techniques are more common, engineering judgment and experience are necessary along with them. Optimization techniques usually can be used as a backing instrument for decisions and provide a better result when combined (28). Iglesias-Ray et al combined engineering judgment and a model optimizer (pseudo-GA) to increase the energy efficiency and manage leakage in the WDNs. Their optimization problem had more than 70 000 decision variables and was divided into three parts. The first part was preliminary analysis to define the criteria for replacing pipes and pumps. The second was the use of an optimizer model and the third part was the correct adjustment of the control valves, pressure relief valves and pumps replacement. Here, a proper combination of optimization techniques and manual adjustments based on engineering judgment has been used to solve the general problems of water supply networks (29). Khedr and Tolson obtained a Pareto front with optimal quality by relying on engineering judgment without the need for complex calculations (28).
In the current study, a two-objective FMGA was used to obtain the best solution with the lowest cost and the most pressure benefit with the help of engineering judgment in a Pareto front from the set of non-dominant solutions to optimize a WDN. The FMGA performance was evaluated
using Bentley WaterGEMS V8i hydraulic software for the design and modification of WDNs with the engineering judgment on a real WDN in western Tehran.
In this study, a new method for reducing the rate of convergence, optimization and development of models for promoting WDN has been presented. Based on the proposed method, instead of controlling all system states in the optimization model, it is possible to identify and search for the optimal set of options based on engineering judgment and hydraulic and physical status of the system. Thus, the time to solve the optimization problem is greatly reduced, which is very important in widespread networks with many components.
firstly, the nodes with pressure deficiency was determined. Then the parts of the network for which there was no possibility of parallel piping (physical limitations in urban areas for new piping such as narrow roads and intersections with underground facilities) was ignored and for the other parts with the low pressure problem and the upstream pipes with the lowest diameter were doubled. This is done because the maximum head loss is due to the smallest pipe diameter. Finally, the node pressure with the performed changes was checked to ensure the sufficiency of the pipe parallelizing. If there is still pressure deficiency in that point, the next upstream pipe is considered for parallelizing. It makes the decision space smaller and makes it easier to find a solution in a reasonable time. Based on the proposed method, instead of controlling all system states in the optimization model, it is possible to identify and search for the optimal set of options based on engineering judgment and hydraulic and physical status of the system. From the analysis of the results, it was observed that use of engineering judgment gave better results.
This study shows that relying on engineering judgment can produce reasonable of the Pareto front of multi objective WDN design problems. The engineering judgment solution generated a high-quality result and was able to identify a more realistic number of changes in the WDN with a very small computational budget and properly pressure in nodes.
Methods
Engineering judgment approach
Environmental Health Engineering and Management Journal 2018, 5(3), 143–151 145
Sherri et al
objective function, there will be a set of solutions so-called Pareto-optimal solution or non-dominated solution (30). These solutions are superior to others in the search space; however, one must recognize that optimization is an auxiliary tool for design engineers and the designer must select the proper solution using engineering judgment and expertise (31).
Optimization of water distribution network
In this study, WDN optimization is solved with objective functions of the cost minimization and the pressure benefit maximization. This is classified as multi-objective problems. The Eqs. 1 and 2 are objective functions used by Bentley WaterGEMS V8i software to optimization (32). Diameters of pipes and velocity in the pipes are considered as the decision variables and optimization constraint, respectively. Energy conservation and continuity laws are the main constraints which are always respected by the software Bentley WaterGEMS V8i.
4
controlling all system states in the optimization model, it is possible to identify and search for the optimal set of options based on engineering judgment and hydraulic and physical status of the system. From the analysis of the results, it was observed that use of engineering judgment gave better results.
This study shows that relying on engineering judgment can produce reasonable of the Pareto front of multi objective WDN design problems. The engineering judgment solution generated a high-quality result and was able to identify a more realistic number of changes in the WDN with a very small computational budget and properly pressure in nodes.
Methods
Engineering judgment approach
In the engineering judgment approach, the operation is broken into two phases to obtain an appropriate practical Pareto front, minimize the cost and maximize the pressure profit. First, engineers must identify all practical and possible solutions. The most important part of this step, after determination of the objective functions, is to identify the decision variables. Hydraulic network analysis was utilized to detect nodes with low pressure for which parallel pipes can be used. The use of an optimizer algorithm is the second step in which the Pareto front is obtained by engineering judgment that provides cost-effective and efficient solutions. If there is more than one objective function, there will be a set of solutions so-called Pareto-optimal solution or non-dominated solution (30). These solutions are superior to others in the search space; however, one must recognize that optimization is an auxiliary tool for design engineers and the designer must select the proper solution using engineering judgment and expertise (31).
Optimization of water distribution network
In this study, WDN optimization is solved with objective functions of the cost minimization and the pressure benefit maximization. This is classified as multi-objective problems. The Eqs. 1 and 2 are objective functions used by Bentley WaterGEMS V8i software to optimization (32). Diameters of pipes and velocity in the pipes are considered as the decision variables and optimization constraint, respectively. Energy conservation and continuity laws are the main constraints which are always respected by the software Bentley WaterGEMS V8i.
𝑀𝑀𝑀𝑀𝑀𝑀𝑀𝑀𝑀𝑀𝑀𝑀𝑀𝑀𝑀𝑀 𝐹𝐹1 = ∑𝐷𝐷𝐷𝐷𝑘𝑘=1(𝐶𝐶𝑘𝑘(𝑑𝑑𝑘𝑘)𝐿𝐿𝑘𝑘) (1)
𝑀𝑀𝑀𝑀𝑀𝑀𝑀𝑀𝑀𝑀𝑀𝑀𝑀𝑀𝑀𝑀 𝐹𝐹2 = ∑ [𝑀𝑀 ∑ ( 𝐽𝐽𝐽𝐽𝑖𝑖,𝑘𝑘
𝐽𝐽𝐽𝐽𝐽𝐽𝐽𝐽𝐽𝐽𝐽𝐽𝐽𝐽𝑘𝑘
𝑁𝑁𝐽𝐽 𝑖𝑖=1 𝑁𝑁𝐷𝐷
𝑘𝑘=1 )(𝐷𝐷𝑖𝑖,𝑘𝑘−𝐷𝐷𝑖𝑖,𝑘𝑘
𝑅𝑅𝑅𝑅𝑅𝑅
𝐷𝐷𝑖𝑖,𝑘𝑘𝑅𝑅𝑅𝑅𝑅𝑅 )
𝑏𝑏 ] (2)
In the Eq. (1), DP represents the total number of design pipes in the network and Ck(dk)Lk is the cost of the pipe k with the length L and diameter d.
And in the Eq. 2,
(1)
(2)
In the Eq. (1), DP represents the total number of design pipes in the network and Ck(dk)Lk is the cost of the pipe k with the length L and diameter d.
And in the Eq. 2,
ND: The number of design states NJ: The number of nodes
JQi,k: The demand at the node i in alternative k JQTotalk: The total of demand in alternative k
Pi,k: The calculation pressure at the node i in alternative k
5
ND: The number of design states
NJ: The number of nodes
JQi,k: The demand at the node i in alternative k
JQTotalk: The total of demand in alternative k
Pi,k: The calculation pressure at the node i in alternative k
𝑃𝑃𝑖𝑖,𝑘𝑘𝑅𝑅𝑅𝑅𝑅𝑅: The required minimum pressure determined by the designer
a, b: a is the linear parameter and b is the parameter which is less than 1 (about 0.5) (32).
Optimization algorithm
GA is an evolutionary algorithms based on natural selection. It was initially completed by Holland and then by Goldberg. First in the GA, multiple answers are randomly generated to the problem (an initial population) for which each answer is called a chromosome. Next, following the selection of the better chromosomes, the GA operators are composed and mutated. Finally, the current population composes with the new population resulted from the chromosomes composition and mutation. In fact, to create a new generation, the competence level is calculated according to the purpose. Those with more competence are more likely to produce the next generation. This algorithm continues until the desired limitation is satisfied.
GA as one of the most important evolutionary algorithms plays an important role in optimization of the WDNs. This algorithm has always faced a lot of changes and reforms. Fast messy GA is one of the GAs and in here is utilized as the optimizer model. It can evaluate chromosomes that are not equal in terms of gene strings and can increase the convergence rate by decreasing the chromosomes length and eliminating undesirable genes. FMGA acts as a filter to remove undesirable genes so that the population only contains short chromosomes with desirable genes. The filtering process continues until the length of all chromosomes decreases to a desirable length. This algorithm resists falling into a local minimum, which improves its ability to solve problems in a short time. FMGA is safer than standard GAs to be deceived and converges better to an optimal solution (33).
Optimal solutions in GA depend on factors such as population size, cut probability, splice probability, mutation probability and, most importantly, computational search space. Bentley WaterGEMS V8i software which works based on the fast messy GA was used to optimize the WDN in this study.
Assessment of the proposed Model
Case study
: The required minimum pressure determined by the designer
a, b: a is the linear parameter and b is the parameter which is less than 1 (about 0.5) (32).
Optimization algorithm
GA is an evolutionary algorithms based on natural selection. It was initially completed by Holland and then by Goldberg. First in the GA, multiple answers are randomly generated to the problem (an initial population) for which each answer is called a chromosome. Next, following the selection of the better chromosomes, the GA operators are composed and mutated. Finally, the current population composes with the new population resulted from the chromosomes composition and mutation. In fact, to create a new generation, the competence level is calculated according to the purpose. Those with more competence are more likely to produce the next generation. This algorithm continues until the desired limitation is satisfied.
GA as one of the most important evolutionary algorithms plays an important role in optimization of the WDNs.
This algorithm has always faced a lot of changes and reforms. Fast messy GA is one of the GAs and in here is utilized as the optimizer model. It can evaluate chromosomes that are not equal in terms of gene strings and can increase the convergence rate by decreasing the chromosomes length and eliminating undesirable genes. FMGA acts as a filter to remove undesirable genes so that the population only contains short chromosomes with desirable genes. The filtering process continues until the length of all chromosomes decreases to a desirable length. This algorithm resists falling into a local minimum, which improves its ability to solve problems in a short time. FMGA is safer than standard GAs to be deceived and converges better to an optimal solution (33).
Optimal solutions in GA depend on factors such as population size, cut probability, splice probability, mutation probability and, most importantly, computational search space. Bentley WaterGEMS V8i software which works based on the fast messy GA was used to optimize the WDN in this study.
Assessment of the proposed Model Case study
The case study was a WDN in Tehran, the capital of Iran. Given that the number of pipes and nodes of the network was huge, the network was simplified by deleting pipes with small diameters located as branches in the network. The simplified structure of the network consisted of 181 pipes, 138 nodes, a reservoir with a maximum water level of 1324.21 m and 10 pressure relief valves (PRV) (Figure 1) (34).
Table 1 lists the characteristics of the network pipes. It consisted of 45 019 m of steel and ductile iron pipes. The population and area covered by the reservoir contained 113378 peoples and 659.18 hectares, respectively. The maximum hourly demand (at 1 pm) was 682 L/s and the minimum hourly demand (at 4 am) was 361 L/s. The network available for the future (horizon plan) was examined. For the horizon plan, the maximum and minimum hourly demands were 1023.07 and 536.69 L/s, respectively. This network needed to be optimized to satisfy the minimum and maximum pressure in the nodes. Ductile iron pipes were used to improve the network. 4
controlling all system states in the optimization model, it is possible to identify and search for the optimal set of options based on engineering judgment and hydraulic and physical status of the system. From the analysis of the results, it was observed that use of engineering judgment gave better results.
This study shows that relying on engineering judgment can produce reasonable of the Pareto front of multi objective WDN design problems. The engineering judgment solution generated a high-quality result and was able to identify a more realistic number of changes in the WDN with a very small computational budget and properly pressure in nodes.
Methods
Engineering judgment approach
In the engineering judgment approach, the operation is broken into two phases to obtain an appropriate practical Pareto front, minimize the cost and maximize the pressure profit. First, engineers must identify all practical and possible solutions. The most important part of this step, after determination of the objective functions, is to identify the decision variables. Hydraulic network analysis was utilized to detect nodes with low pressure for which parallel pipes can be used. The use of an optimizer algorithm is the second step in which the Pareto front is obtained by engineering judgment that provides cost-effective and efficient solutions. If there is more than one objective function, there will be a set of solutions so-called Pareto-optimal solution or non-dominated solution (30). These solutions are superior to others in the search space; however, one must recognize that optimization is an auxiliary tool for design engineers and the designer must select the proper solution using engineering judgment and expertise (31).
Optimization of water distribution network
In this study, WDN optimization is solved with objective functions of the cost minimization and the pressure benefit maximization. This is classified as multi-objective problems. The Eqs. 1 and 2 are objective functions used by Bentley WaterGEMS V8i software to optimization (32). Diameters of pipes and velocity in the pipes are considered as the decision variables and optimization constraint, respectively. Energy conservation and continuity laws are the main constraints which are always respected by the software Bentley WaterGEMS V8i.
𝑀𝑀𝑀𝑀𝑀𝑀𝑀𝑀𝑀𝑀𝑀𝑀𝑀𝑀𝑀𝑀 𝐹𝐹1 = ∑𝐷𝐷𝐷𝐷𝑘𝑘=1(𝐶𝐶𝑘𝑘(𝑑𝑑𝑘𝑘)𝐿𝐿𝑘𝑘) (1)
𝑀𝑀𝑀𝑀𝑀𝑀𝑀𝑀𝑀𝑀𝑀𝑀𝑀𝑀𝑀𝑀 𝐹𝐹2 = ∑ [𝑀𝑀 ∑ ( 𝐽𝐽𝐽𝐽𝑖𝑖,𝑘𝑘
𝐽𝐽𝐽𝐽𝐽𝐽𝐽𝐽𝐽𝐽𝐽𝐽𝐽𝐽𝑘𝑘
𝑁𝑁𝐽𝐽 𝑖𝑖=1 𝑁𝑁𝐷𝐷
𝑘𝑘=1 )(𝐷𝐷𝑖𝑖,𝑘𝑘−𝐷𝐷𝑖𝑖,𝑘𝑘
𝑅𝑅𝑅𝑅𝑅𝑅
𝐷𝐷𝑖𝑖,𝑘𝑘𝑅𝑅𝑅𝑅𝑅𝑅 )𝑏𝑏 ] (2)
In the Eq. (1), DP represents the total number of design pipes in the network and Ck(dk)Lk is the cost of the pipe k with the length L and diameter d.
And in the Eq. 2,
6
The case study was a WDN in Tehran, the capital of Iran. Given that the number of pipes and nodes of the network was huge, the network was simplified by deleting pipes with small diameters located as branches in the network. The simplified structure of the network consisted of 181 pipes, 138 nodes, a reservoir with a maximum water level of 1324.21 m and 10 pressure relief valves (PRV) (Figure 1) (34).
Figure 1. Layout of the WDS model (34)
Table 1lists the characteristics of the network pipes. It consisted of 45019 m of steel and ductile iron pipes. The population and area covered by the reservoir contained 113378 peoples and 659.18 hectares, respectively. The maximum hourly demand (at 1 pm) was 682 L/s and the minimum hourly demand (at 4
am) was 361 L/s.
Table 1. Characteristics of network pipes (34)
Material
Total Length in the considered WDN (m) Diameter (mm) Ductile iron 835 60 1170 80 8052 100 9681 150 8718 200 3263 250 1836 300 1438 350 NODE PRV PIPE N Reservoir
Sherri et al
Environmental Health Engineering and Management Journal 2018, 5(3), 143–151 146
Nine commercial diameters were introduced to optimize the network (100, 150, 200, 250, 300, 350, 400, 500 and 600 mm at a cost of USD 30.53, 44.61, 60.79, 73.42, 92.76, 121.32, 145, 197.37 and 257.63 per unit length, respectively).
The network was examined under two conditions. In condition 1, parallel pipes were considered for all pipes except in the areas in which it was not possible and physical limitations. In condition 2, as is shown in Figure 2, parallel pipes were considered for pipes with low pressure problem and those that acted as pressure amplifiers in the mentioned pipes.
Results
After optimizing the maximum hourly demand at 1023.07 L/s, 20 solutions were obtained for each condition to optimize the network. These included new diameters for the parallel network pipes. In solution 16, 133 parallel pipes out of 167 predefined parallel pipes were selected. In solution 19, 13 out of 18 predefined parallel pipes were
parallelized. In the creation of the scenario and its transfer to Bentley WaterGEMS, the effects of these diameters were imposed on the network.
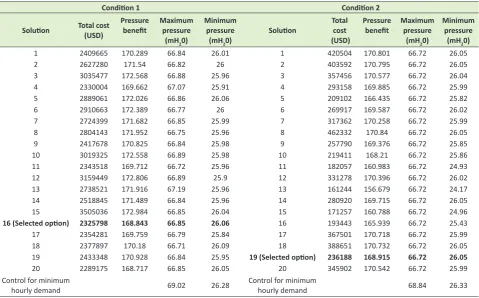
Figures 3a and 3b show the Pareto front obtained for the cost versus pressure benefit for both conditions. Table 2 shows 20 solutions for minimizing the cost and maximizing the pressure benefit for both conditions using 167 parallel pipes (condition 1) and 18 parallel pipes (condition 2). As seen, almost at the same total benefit (total benefit = 168.843 for condition 1and 168.915 for condition 2). Solution 16 (condition 1) and solution 19 (condition 2) have the permitted pressure and the lowest cost (total cost of condition 1 = US$2 325 798 and of condition 2 = US$236 188). As observed, condition 2 is economically more cost-effective than condition 1, as the cost of condition 2 decreased 89.84% compared to condition 1.
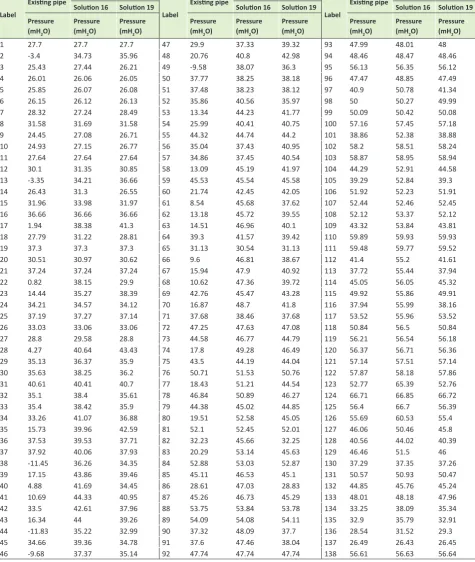
After the network and economic analysis and the control of diameters to meet the minimum hourly demand (536.69 L/s), it was seen that condition 2, using parallel pipes in areas of low pressure, improved the pressure rate. Table 3 shows the pressure before and after optimization and reveals that the existing pipes could not meet future
Table 1. Characteristics of network pipes (34)
Material Total length in the considered WDN (m) Diameter (mm)
Ductile iron 835 60
1170 80 8052 100 9681 150 8718 200 3263 250 1836 300 1438 350 2290 400 1130 500 1714 700
Steel 7354 1200
4513 900
Total 45019
7 2290 400 1130 500 1714 700 Steel 7354 1200 4513 900
Total 45019 meters
The network available for the future (horizon plan) was examined. For the horizon plan, maximum and minimum hourly demand was considered as 1023.07 and 536.69L/s, respectively.
The network available for the future (horizon plan) was examined. For the horizon plan, the maximum and minimum hourly demands were 1023.07 and 536.69 L/s, respectively. This network needed to be optimized to satisfy the minimum and maximum pressure in the nodes. Ductile iron pipes were used to improve the network. Nine commercial diameters were introduced to optimize the network (100, 150, 200, 250, 300, 350, 400, 500 and 600 mm at a cost of USD 30.53, 44.61, 60.79, 73.42, 92.76, 121.32, 145, 197.37 and 257.63 per unit length, respectively).
The network was examined under two conditions. In condition 1, parallel pipes were considered for all pipes except in the areas in which it was not possible and physical limitations. In condition 2, as is shown in Figure 2, parallel pipes were considered for pipes with low pressure problem and those that acted as pressure amplifiers in the mentioned pipes.
Figure 2. Layout of the WDS model in condition 2
Results
NODE
PRV PIPE
Reservoir
Figure 2. Layout of the WDS model in condition 2. Figure 3.condition 2 (a) Pareto front in condition 1 (b): Pareto front in 8
After optimizing the maximum hourly demand at 1023.07 L/s, 20 solutions were obtained for each condition to optimize the network. These included new diameters for the parallel network pipes. In solution 16, 133 parallel pipes out of 167 predefined parallel pipes were selected. In solution 19, 13 out of 18 predefined parallel pipes were parallelized. In the creation of the scenario and its transfer to Bentley WaterGEMS, the effects of these diameters were imposed on the network.
Figures 3a and 3b show the Pareto front obtained for the cost versus pressure benefit for both conditions. Table 2 shows 20 solutions for minimizing the cost and maximizing the pressure benefit for both conditions using 167 parallel pipes (condition 1) and 18 parallel pipes (condition 2). As seen, almost at the same total benefit (total benefit = 168.843 for condition 1and 168.915 for condition 2). Solution 16 (condition 1) and solution 19 (condition 2) have the permitted pressure and the lowest cost (total cost of condition 1 = US$2,325,798 and of condition 2 = US$236,188). As observed, condition 2 is economically more cost-effective than condition 1, as the cost of condition 2 decreased 89.84% compared to condition 1.
Figure 3. (a): Pareto front in condition 1; (b): Pareto front in condition 2
Table2. Comparison of solutions in two conditions
Codition1 Condition2
Solution Total Cost
(USD)
Pressure Maximum Minimum
Solution Total Cost
(USD)
Pressure Maximum Minimum
Benefit Pressure Pressure Benefit Pressure Pressure
( mH20) ( mH20) ( mH20) ( mH20)
1 2409665 170.289 66.84 26.01 1 420504 170.801 66.72 26.05
2 2627280 171.54 66.82 26 2 403592 170.795 66.72 26.05
3 3035477 172.568 66.88 25.96 3 357456 170.577 66.72 26.04
4 2330004 169.662 67.07 25.91 4 293158 169.885 66.72 25.99
5 2889061 172.026 66.86 26.06 5 209102 166.435 66.72 25.82
6 2910663 172.389 66.77 26 6 269917 169.587 66.72 26.02
7 2724399 171.682 66.85 25.99 7 317362 170.258 66.72 25.99
8 2804143 171.952 66.75 25.96 8 462332 170.84 66.72 26.05
168 169 170 171 172 173 174 2, 20 0 2, 30 0 2, 40 0 2, 50 0 2, 60 0 2, 70 0 2, 80 0 2, 90 0 3, 00 0 3, 10 0 3, 20 0 3, 30
0 3,400
3, 50 0 3, 60 0 pre ssure benefi t Cost(USD)*thousands Solution 1 Solution 2 Solution 3 Solution 4 Solution 5 Solution 6 Solution 7 Solution 8 Solution 9 Solution 10 Solution 11 Solution 12 Solution 13 Solution 14 Solution 15 Solution 16 Solution 17 Solution 18 Solution 19 Solution 20 selected option (a) 154 156 158 160 162 164 166 168 170 172
150 180 210 240 270 300 330 360 390 420 450
pre ssure benefi t Cost(USD)*thousands Solution 1 Solution 2 Solution 3 Solution 4 Solution 5 Solution 6 Solution 7 Solution 8 Solution 9 Solution 10 Solution 11 Solution 12 Solution 13 Solution 14 Solution 15 Solution 16 Solution 17 Solution 18 Solution 19 Solution 20 selected option (b) 8
After optimizing the maximum hourly demand at 1023.07 L/s, 20 solutions were obtained for each condition to optimize the network. These included new diameters for the parallel network pipes. In solution 16, 133 parallel pipes out of 167 predefined parallel pipes were selected. In solution 19, 13 out of 18 predefined parallel pipes were parallelized. In the creation of the scenario and its transfer to Bentley WaterGEMS, the effects of these diameters were imposed on the network.
Figures 3a and 3b show the Pareto front obtained for the cost versus pressure benefit for both conditions. Table 2 shows 20 solutions for minimizing the cost and maximizing the pressure benefit for both conditions using 167 parallel pipes (condition 1) and 18 parallel pipes (condition 2). As seen, almost at the same total benefit (total benefit = 168.843 for condition 1and 168.915 for condition 2). Solution 16 (condition 1) and solution 19 (condition 2) have the permitted pressure and the lowest cost (total cost of condition 1 = US$2,325,798 and of condition 2 = US$236,188). As observed, condition 2 is economically more cost-effective than condition 1, as the cost of condition 2 decreased 89.84% compared to condition 1.
Figure 3. (a): Pareto front in condition 1; (b): Pareto front in condition 2
Table2. Comparison of solutions in two conditions
Codition1 Condition2
Solution Total Cost
(USD)
Pressure Maximum Minimum
Solution Total Cost
(USD)
Pressure Maximum Minimum
Benefit Pressure Pressure Benefit Pressure Pressure
( mH20) ( mH20) ( mH20) ( mH20)
1 2409665 170.289 66.84 26.01 1 420504 170.801 66.72 26.05
2 2627280 171.54 66.82 26 2 403592 170.795 66.72 26.05
3 3035477 172.568 66.88 25.96 3 357456 170.577 66.72 26.04
4 2330004 169.662 67.07 25.91 4 293158 169.885 66.72 25.99
5 2889061 172.026 66.86 26.06 5 209102 166.435 66.72 25.82
6 2910663 172.389 66.77 26 6 269917 169.587 66.72 26.02
7 2724399 171.682 66.85 25.99 7 317362 170.258 66.72 25.99
8 2804143 171.952 66.75 25.96 8 462332 170.84 66.72 26.05
168 169 170 171 172 173 174 2, 20 0 2, 30 0 2, 40 0 2, 50 0 2, 60 0 2, 70 0 2, 80 0 2, 90 0 3, 00 0 3, 10 0 3, 20 0 3, 30
0 3,400
3, 50 0 3, 60 0 pre ssure benefi t Cost(USD)*thousands Solution 1 Solution 2 Solution 3 Solution 4 Solution 5 Solution 6 Solution 7 Solution 8 Solution 9 Solution 10 Solution 11 Solution 12 Solution 13 Solution 14 Solution 15 Solution 16 Solution 17 Solution 18 Solution 19 Solution 20 selected option (a) 154 156 158 160 162 164 166 168 170 172
150 180 210 240 270 300 330 360 390 420 450
Environmental Health Engineering and Management Journal 2018, 5(3), 143–151 147
demand. This problem could be resolved using parallel pipes. According to the local standards (35), the network must be designed in such a way that the minimum and maximum pressure in the nodes to be satisfied. The allowable limit of pressure changes in the nodes is 26 to 60 mH2O (in certain circumstances). As observed, at 4 nodes (123, 124, 125 and 126) the pressure is higher than the standard level. In condition 1, the pressure at the node 124 is 66.72 mH2O. Of course, the node of 124 was located in pressure zone 1 with a static pressure of 69.91 mH2O. Such pressure is not unexpected because the nominal pressure of the pipes applied to the network was 10 atm, which makes the reported pressures acceptable.
Table 4 shows that the cost of condition 2 decreased 89.84% compared to condition 1.
Table 5 shows the nodes pressure percentage before and after optimization. As observed, the pressure percentage of less than 26 mH2O has reached zero after optimization. But in some nodes, it is 2.9% and 0.72% in conditions 1 and 2, respectively.
Figure 4 shows that the pressure in the nodes is higher than the standard level in the two conditions (nodes 123, 124, 125 and 126 in condition 1 and 124 in condition 2). Figure 5 shows the diameter and amount of pipe to be used in the network for both conditions. Solution 16 in condition 1 includes 31304 m of pipe with diameters of 100, 150, 200, 250, 300, 350, 400, 500 and 600 mm and solution 19 in condition 2 includes 2387 m of pipe with diameters of 100, 150, 200, 250, 350, 400 and 500 mm.
Comparison of conditions 1 and 2 confirms that the implementation of solution 19 is more affordable.
Discussion
In this study, the FMGA and WaterGEMS hydraulic software were used to optimize a WDN in western Tehran with the help of engineering judgment. It was optimized using the objective functions of cost minimization and pressure benefit maximization under two conditions. Table 4 shows that the costs decreased 89.84% with the use of engineering judgment. Using this approach, for reducing calculation volume the parts of the network with no possibility of parallel piping (physical limitations such as narrow roads and intersections with underground facilities) was ignored. In parts experiencing low-pressure, parallel pipes were defined.
One-way analysis of variance (ANOVA) was used to compare the mean of the numbers obtained for the pressure variable in three options, including the existing pipes, condition1 and condition 2.
The mean of the pressure in the existing pipes has been 34.45 with the standard deviation of 16.88, in condition 1, 44.36 with the standard deviation of 9.60 and in condition 2, 41.55 with a standard deviation of 8.91. The results of analysis indicate that there is a significant difference between the three groups in the amount of pressure (P<0.001). Scheffe test analysis was used to find out what differences were observed among the groups.
It was observed that the mean pressure in the existing
Table 2. Comparison of solutions in two conditions
Condition 1 Condition 2
Solution Total cost (USD) Pressure benefit Maximum pressure (mH20)
Minimum pressure
(mH20) Solution
Total cost (USD)
Pressure
benefit Maximumpressure (mH20)
Minimum pressure
(mH20)
1 2409665 170.289 66.84 26.01 1 420504 170.801 66.72 26.05 2 2627280 171.54 66.82 26 2 403592 170.795 66.72 26.05 3 3035477 172.568 66.88 25.96 3 357456 170.577 66.72 26.04 4 2330004 169.662 67.07 25.91 4 293158 169.885 66.72 25.99 5 2889061 172.026 66.86 26.06 5 209102 166.435 66.72 25.82 6 2910663 172.389 66.77 26 6 269917 169.587 66.72 26.02 7 2724399 171.682 66.85 25.99 7 317362 170.258 66.72 25.99 8 2804143 171.952 66.75 25.96 8 462332 170.84 66.72 26.05 9 2417678 170.825 66.84 25.98 9 257790 169.376 66.72 25.85 10 3019325 172.558 66.89 25.98 10 219411 168.21 66.72 25.86 11 2343518 169.712 66.72 25.96 11 182057 160.983 66.72 24.93 12 3159449 172.806 66.89 25.9 12 331278 170.396 66.72 26.02 13 2738521 171.916 67.19 25.96 13 161244 156.679 66.72 24.17 14 2518845 171.489 66.84 25.96 14 280920 169.715 66.72 26.05 15 3505036 172.984 66.85 26.04 15 171257 160.788 66.72 24.96
16 (Selected option) 2325798 168.843 66.85 26.06 16 193443 165.939 66.72 25.43 17 2354281 169.759 66.79 25.84 17 367501 170.718 66.72 25.99 18 2377897 170.18 66.71 26.09 18 388651 170.732 66.72 26.05 19 2433348 170.928 66.84 25.95 19 (Selected option) 236188 168.915 66.72 26.05
20 2289175 168.717 66.85 26.05 20 345902 170.542 66.72 25.99
Control for minimum
Sherri et al
Environmental Health Engineering and Management Journal 2018, 5(3), 143–151 148
pipes was significantly lower compared to conditions 1 and 2 (P<0.001). Also, the average pressure in condition 1 is 2.80 points more than the condition 2. But the difference between these conditions is not statistically significant (P = 0.170).
According to the results of analysis, due to the lack of significant difference in pressure between conditions
1 and 2, for choosing the ideal solution, the lowest cost and the number of nodes outside the normal range can be chosen as selection criteria.
As shown in Table 3, in condition 1, four nodes (nodes 124,123, 125 and 126), and in condition 2 only the node 124 are outside the normal range. Also, economically, condition 2 is more cost- effective than the condition Table 3. Comparison of nodes pressure before and after optimization in both conditions
Label
Existing pipe Condition 1 Condition 2
Label
Existing pipe Condition 1 Condition 2
Label
Existing pipe Condition 1 Condition 2
Solution 16 Solution 19 Solution 16 Solution 19 Solution 16 Solution 19
Pressure (mH2O)
Pressure (mH2O)
Pressure (mH2O)
Pressure (mH2O)
Pressure (mH2O)
Pressure (mH2O)
Pressure (mH2O)
Pressure (mH2O)
Pressure (mH2O)
Environmental Health Engineering and Management Journal 2018, 5(3), 143–151 149
Sherri et al
1. In condition 1, there are nine pipe sizes with 331 304 m piping, but in condition 2 there are seven pipe sizes with 2387 m piping. According to Table 4, the cost of condition 2 dropped 89.84% than the condition 1. Thus, the condition 2 is preferable than the condition 1. The results indicate that engineering knowledge and experience must be combined with optimization techniques to provide the best solution.
Iglesias-Rey et al employed engineering judgment and a model optimizer (pseudo-GA) to improve the energy efficiency and management of leakage in WDNs. The results showed that the total cost reached from €4 942 793 to €1 252 085. In fact it decreased approximately 3.9 times with a proper combination of optimization techniques and manual adjustments relying on using engineering judgment (29).
Khedr and Tolson (28) compared optimization techniques with an engineering judgment approach to design of WDN. They solved a simplified version of the Battle of
Table 4. Comparison of costs and total benefit in both optimizations
Parameters Condition 1 Condition 2
Total cost (USD) 2325798 236188
Total benefit 168.843 168.915
11
Figure 4 shows that the pressure in the nodes is higher than the standard level in the two conditions (nodes 123, 124, 125 and 126 in condition 1 and 124 in condition 2).
Figure 4. The nodes with the pressure higher than the standard level in two conditions
Figure 5 shows the diameter and amount of pipe to be used in the network for both conditions. Solution 16 in condition 1 includes 31304 m of pipe with diameters of 100, 150, 200, 250, 300, 350, 400, 500 and 600 mm and solution 19 in condition 2 includes 2387 m of pipe with diameters of 100, 150, 200, 250, 350, 400 and 500 mm. Comparison of conditions 1 and 2 confirms that the implementation of solution 19 is more affordable.
Figure 5. The diameter and amount of the proposed pipes in two conditions
0 1000 2000 3000 4000 5000 6000 7000
100 150 200 250 300 350 400 500 600
le
ng
ht(
m)
diameter(mm)
Condition2 Condition 1
NODE
PRV
PIPE Reservoir
11
(nodes 123, 124, 125 and 126 in condition 1 and 124 in condition 2).
Figure 4. The nodes with the pressure higher than the standard level in two conditions
Figure 5 shows the diameter and amount of pipe to be used in the network for both conditions. Solution 16 in condition 1 includes 31304 m of pipe with diameters of 100, 150, 200, 250, 300, 350, 400, 500 and 600 mm and solution 19 in condition 2 includes 2387 m of pipe with diameters of 100, 150, 200, 250, 350, 400 and 500 mm. Comparison of conditions 1 and 2 confirms that the implementation of solution 19 is more affordable.
Figure 5. The diameter and amount of the proposed pipes in two conditions
0 1000 2000 3000 4000 5000 6000 7000
100 150 200 250 300 350 400 500 600
le
ng
ht(
m)
diameter(mm)
Condition2 Condition 1 NODE
PRV
PIPE Reservoir
Figure 4. The nodes with the pressure higher than the standard level in two conditions.
Figure 5. The diameter and amount of the proposed pipes in two conditions.
Algorithm settings for the two conditions are: Population size: 240, cut probability: 1.8, splice probability: 80, mutation probability: 0.9, Max.trials: 30000.
Table 5. Comparison of the nodes pressure percentage before and after the optimization of the network
Pressure limit (mH2O) Pressure (%) with the existing pipe
Pressure (%)
The first condition The second conditionPressure (%) Solution 16 Solution 19
<26 25.36 0 0
<40 35.51 36.23 47.83
<50 18.84 31.88 32.61
<60 19.57 28.99 18.84
<70 0.72 2.9 0.72
Background Leakage Assessment for Water Networks (BBLAWN) problem using both the engineering judgment approach and a multi objective optimization algorithm, and compared the corresponding Pareto fronts. Their study shows the engineering judgment solution generated a high-quality result to identify a more realistic number of changes in the WDN (about 10% of WDN) compared with BBLAWN teams based on global optimization algorithm (27).
Matthews et al showed the engineering judgment approach could provide a very good Pareto front. Moreover, this approach coupled with a heuristic global optimization algorithm can yield even better results than engineering judgment alone (36).
Conclusion
Sherri et al
Environmental Health Engineering and Management Journal 2018, 5(3), 143–151 150
Many models of WDNs optimization perform designing based on minimizing the cost that leading to a pressure close to the minimum allowable pressure and decrease of the network performance. In this study, the multi-objective fast messy GA and Water GEMS V8i hydraulic software were used to optimize a real WDN in the western Tehran with the help of engineering judgment. This approach decreased the search space to produce the best possible solution with the lowest cost and the most pressure benefit using a Pareto front from a set of non-dominant solutions. To reduce the volume of computation the parts of the network for which there was no possibility of parallel piping was ignored and parallel piping was defined for other parts with low pressure. The results of optimization and modification of the network confirm that, with the help of engineering judgment, the cost decreased 89.84% in the real network and the pressure level in all the nodes increased to above the allowable minimum pressure.
Acknowledgments
This research is derived from a PhD thesis. The authors express their appreciation to the Tehran province water and wastewater co. for its cooperation in facilitating to obtain the data of network.
Ethical issues
It is confirmed that this manuscript is the original work of the authors. It has not been published, nor is it under review in another journal, and it is not being submitted for publication elsewhere.
Competing interests
The authors declare that they have no competing interests.
Authors’ contributions
All authors contributed equally and were involved in the study design, data collection, analysis, and interpretation of the data. All authors critically reviewed, refined, and approved the manuscript.
References
1. Scholten L, Scheidegger A, Reichert P, Maurer M. Combining expert knowledge and local data for improved service life modeling of water supply networks. Environ Model Softw 2013; 42: 1-16. doi: 10.1016/j.envsoft.2012.11.013. 2. Eslami A, Ghaffari M, Barikbin B, Fanaei F. Assessment of
safety in drinking water supply system of Birjand city using World Health Organization’s water safety plan. Environ Health Eng Manag 2018; 5(1): 39-47. doi: 10.15171/ ehem.2018.06.
3. Nijhawan A, Jain P, Sargaonkar A, Labhasetwar PK. Implementation of water safety plan for a large-piped water supply system. Environ Monit Assess 2014; 186(9): 5547-60. doi: 10.1007/s10661-014-3802-x.
4. Shirzad A, Tabesh M, Heidarzadeh M. A new method for quasi-optimal design of water distribution networks. Water Resources Management 2015; 29(14): 5295-308. doi:
10.1007/s11269-015-1118-4.
5. Mambretti S, Orsi E. Optimizing pump operations in water supply networks through genetic algorithms. J Am Water Works Assoc 2016; 108(2): E119-E25. doi: 10.5942/ jawwa.2016.108.0025.
6. Syahputra R. Distribution network optimization based on genetic algorithm. Journal of Electrical Technology UMY 2017; 1(1): 1-9.
7. Afshar A, Massoumi F, Afshar A, Marino MA. State of the art review of ant colony optimization applications in water resource management. Water Resources Management 2015; 29(11): 3891-904. doi: 10.1007/s11269-015-1016-9. 8. Dini M, Tabesh M. A New method for simultaneous
calibration of demand pattern and Hazen-Williams coefficients in water distribution systems. Water Resources Management 2014; 28(7): 2021-34. doi: 10.1007/s11269-014-0592-4.
9. Mora-Melia D, Iglesias-Rey PL, Martínez-Solano FJ, Muñoz-Velasco P. The efficiency of setting parameters in a modified shuffled frog leaping algorithm applied to optimizing water distribution networks. Water 2016; 8(5): 182. doi: 10.3390/w8050182.
10. Roy P, Roy P, Chakrabarti A. Modified shuffled frog leaping algorithm with genetic algorithm crossover for solving economic load dispatch problem with valve-point effect. Appl Soft Comput 2013; 13(11): 4244-52. doi: 10.1016/j. asoc.2013.07.006.
11. Samora I, Franca MJ, Schleiss AJ, Ramos HM. Simulated annealing in optimization of energy production in a water supply network. Water Resources Management 2016; 30(4): 1533-47. doi: 10.1007/s11269-016-1238-5.
12. Ghajarnia N, Bozorg-Haddad O, Marino MA. Performance of a novel hybrid algorithm in the design of water networks. Water Management 2011; 164(4): 173-91. doi: 10.1680/ wama.1000028.
13. Wang L, Pan QK, Tasgetiren MF. A hybrid harmony search algorithm for the blocking permutation flow shop scheduling problem. Comput Ind Eng 2011; 61(1): 76-83. doi: 10.1016/j.cie.2011.02.013.
14. Jung D, Kang D, Kim JH. Development of a hybrid harmony search for water distribution system design. KSCE Journal of Civil Engineering 2018; 22(4): 1506-14. doi: 10.1007/ s12205-017-1864-3.
15. Ezzeldin R, Djebedjian B, Saafan T. Integer discrete particle swarm optimization of water distribution networks. Journal of Pipeline Systems Engineering and Practice 2014; 5(1): 04013013. doi: 10.1061/(ASCE)PS.1949-1204.0000154. 16. Surco DF, Vecchi TP, Ravagnani MA. Optimization of water
distribution networks using a modified particle swarm optimization algorithm. Water Science and Technology: Water Supply 2017; 18(2): 660-78. doi: 10.2166/ws.2017.148. 17. Coelho B, Andrade-Campos A. Efficiency achievement
in water supply systems—A review. Renewable and Sustainable Energy Reviews 2014; 30(C): 59-84. doi: 10.1016/j.rser.2013.09.010.
18. Gharibi H, Mahvi AH, Nabizadeh R, Arabalibeik H, Yunesian M, Sowlat MH. A novel approach in water quality assessment based on fuzzy logic. J Environ Manage 2012; 112: 87-95. doi: 10.1016/j.jenvman.2012.07.007.
Environmental Health Engineering and Management Journal 2018, 5(3), 143–151 151
Resources Planning and Management 2004; 130(1): 73-82. doi: 10.1061/(ASCE)0733-9496(2004)130:1(73).
20. Seyoum AG, Tanyimboh TT, Siew C. Practical application of penalty-free evolutionary multi-objective optimisation of water distribution systems. Water Utility Journal 2016; 12: 49-55.
21. Wang Q, Creaco E, Franchini M, Savic D, Kapelan Z. Comparing low and high-level hybrid algorithms on the two-objective optimal design of water distribution systems. Water Resources Management 2015; 29(1): 1-16. doi: 10.1007/s11269-014-0823-8.
22. Tang R, Zhang C, Ding W, Li Y, Zhou H. Use of multi-objective analysis to reveal the benefits of a water transfer project. Water Science and Technology: Water Supply 2016; 17(1): 259-66. doi: 10.2166/ws.2016.132.
23. Suribabu CR. Resilience-based optimal design of water distribution network. Appl Water Sci 2017; 7(7): 4055-66. doi: 10.1007/s13201-017-0560-2.
24. Sirsant S, Reddy MJ. Reliability-based design of water distribution networks considering mechanical failures. European Water 2017; 58: 407-14.
25. Walski TM. The wrong paradigm—why water distribution optimization doesn’t work. Journal of Water Resources Planning and Management 2001; 127(4): 203-5. doi: 10.1061/(ASCE)0733-9496(2001)127:4(203).
26. Halhal D, Walters GA, Ouazar D, Savic DA. Water network rehabilitation with structured messy genetic algorithm. Journal of Water Resources Planning and Management 1997; 123(3): 137-46. doi: 10.1061/(ASCE)0733-9496(1997)123:3(137).
27. Walters GA, Halhal D, Savic D, Ouazar D. Improved design of “Anytown” distribution network using structured messy genetic algorithms. Urban Water 1999; 1(1): 23-38. doi: 10.1016/S1462-0758(99)00005-9.
28. Khedr A, Tolson BA. Comparing Optimization techniques
with an engineering judgment approach to WDN design. Journal of Water Resources Planning and Management 2016; 142(5): C4015014. doi: 10.1061/(ASCE)WR.1943-5452.0000611.
29. Iglesias-Rey PL, Martinez-Solano FJ, Mora Melia D, Martinez-Solano PD. Combining engineering judgment and an optimization model to increase hydraulic and energy efficiency in water distribution networks. Journal of Water Resources Planning and Management 2016; 142(5): C4015012. doi: 10.1061/(ASCE)WR.1943-5452.0000605. 30. Hans AE. Multicriteria Optimization in Engineering and
in the Sciences. New York: Springer; 1988.
31. Srinivas N, Deb K. Muiltiobjective optimization using nondominated sorting in genetic algorithms. Evol Comput 1994; 2(3): 221-48. doi: 10.1162/evco.1994.2.3.221. 32. Haestad Methods Solution Center. WaterGEMS For GIS
user’s guide. Watertown: Bentley Systems, Incorporated; 2005.
33. Goldberg DE, Deb K, Kargupta H, Harik G. Rapid Accurate Optimization of Difficult Problems Using Fast Messy Genetic Algorithms. Proceedings of the 5th International Conference on Genetic Algorithms; 1993; p. 56-64. 34. Sherri F, Mahvi AH, Toloie Eshlagy A, Hassani AH. A new
approach in simultaneous calibration of Hazen–Williams coefficients and demand of nodes in of water distribution systems. Desalination Water Treat 2017; 74: 137-148. doi: 10.5004/dwt.2017.20617.
35. Islamic Republic of Iran Vice Presidency For Strategic Planning and Supervision. Design Criteria of Urban and Rural Water Supply and Distribution Systems. 2013. [In Persian].