Comparison of Intelligent Algorithms for Economically
Optimum Harmonic Passive Filter Design in Radial
Distribution Systems
M. Mohammadi, A. Samimi
Department of Electrical Engineering, Borujerd Branch, Islamic Azad University, Borujerd, Iran
Abstract: This paper presents the optimal planning of harmonic passive filters in distribution system using three intelligent methods including genetic algorithm (GA), particle swarm optimization (PSO), artificial bee colony (ABC) and as a new research is compared with biogeography based optimization (BBO) algorithm. In this work, the considered objective function is to minimize the value of investment cost of filters and total harmonic distortion of three-phase current. It is shown that through an economical placement and sizing of LC passive filters the total voltage harmonic distortion and cost could be minimized simultane-ously. BBO is a novel evolutionary algorithm that is based on the mathematics of biogeography. In the BBO model, problem solutions are represented as islands, and the sharing of features between solutions is represented as immigration and emigration between the islands. The simulation results show that the proposed method is efficient for solving the presented problem.
Keywords: Nonlinear Load, Passive Filter, Harmonic Distortion, Distribution Feeders, Biogeography-Based Opti-mization.
I.
I
NTRODUCTIONThe results of related investigations show that the most of voltage and current distortions in distribution networks are arose to harmonics of third, fifth and seventh orders [1]. Due to that, in this case the implantation of three single tuned passive filters could solve this problem and therefore the sitting and sizing of filters is quite simple. However, because of distributed linear and nonlinear loads in distribution system, the passive filter planning is much difficult [2]. In [3] the genetic-algorithm-based design of passive filters for offshore application is presented and discussed. In [4] a new genetic algorithm based approach to design a passive LC filter for a full-bridge rectifier with aim of finding maximum power factor of the ac mains is presented. In [5] the calculation of the R-L-C parameters
for a typical passive harmonic filter used in the customers’
house is analyzed. In [6], the harmonic passive filter planning in radial distribution systems using microgenetic algorithms with aim of voltage harmonic reduction is addressed. In this reference, the input parameters of programmed software include the number and the relevant order of these filters. Optimum location and sizing of two passive harmonic filters, whose harmonic tuning orders are 5 and 7 in distribution networks using genetic algorithm is analyzed by [7]. Power loss reduction and minimization of total voltage harmonic distortion are considered as objective function in this reference.
In another research by Zhou Juan and et al. the optimal design of passive power filters of an asymmetrical system based on genetic algorithm is discussed [8]. The problem which analyzed in [8] is focused on optimal design of a typical passive filter for a specific non liner load and it is supposed that the location of passive filter is constant and only the sizing of passive filter is objective.
Optimized passive filter design using particle swarm optimization algorithm (PSO) for a 12-pulse converter-fed LCI–synchronous motor drive was investigated by [9]. They present a simplified optimization algorithm based on a particle swarm optimization method for the selection of passive filter components. This algorithm is used to design passive filters for three types of loads on an LCI-SM drive, i.e., constant-torque-variable-speed loads, constant-speed-variable-torque loads, and variable-speed-constant-speed-variable-torque loads, to meet the requirements of a wide range of applications. In this research, sitting and sizing of harmonic passive filters in distribution system using three intelligent methods including genetic algorithm (GA), particle swarm optimization (PSO), artificial bee colony (ABC) are analyzed and as a new research is compared with biogeography based optimization (BBO) algorithm. In this research, the considered objective function is to minimize the value of investment cost of filters and total harmonic distortion of three-phase current. The harmonic levels of system are obtained by current injections method and the load flow is solved by the iterative method of power sum, which is suitable for the accuracy requirements of this type of study.
II.
E
FFECTS OFH
ARMONICD
ISTORTION ONP
OWERS
YSTEMOnce the harmonic sources are clearly defined, they must be interpreted in terms of their effects on the rest of the system and on personnel and equipment external to the power system. Each element of the power system must be examined for its sensitivity to harmonics as a basis for recommendations on the allowable levels. The main effects of voltage and current harmonics within the power system are [10]:
Amplification of harmonic levels resulting from series and parallel resonances.
Reduction in the efficiency of the generation, transmi-ssion and utilization of electrical energy.
Malfunction of system or plant components. Thermal stress
Insulation stress Load disruption
Harmonics increase the equipment losses and thus the thermal stress. Triplen harmonics result in the neutral carrying a current which might equal or exceed the phase currents even if the loads are balanced. This dictates the derating or over sizing of neutral wires. Moreover, harmonics caused resonance might damage the equipment. Harmonics further interfere with protective relays, metering devices, control and communication circuits, and customer electronic equipment. Sensitive equipment would experience mal operation or component failure [11].
III.
H
ARMONICP
OWERF
LOWThe most of the distribution feeders are radial. As shown in Fig.1 the details of one section of this feeder is illustrated. Generically, each bus can have linear and nonlinear loads, and shunt capacitor banks.
Fig.1. Section i of a radial distribution feeder
To determine the harmonic flow in a radial distribution feeder, the current injection method can be used [10]. The advantages of this method are that solution can be obtained directly, it is able to handle several harmonic sources simultaneously, and it is computationally efficient. In this method, the network harmonic voltages are calculated by frequency-domain matrix:
(1)
h h
hV I
Y
WhereI is the harmonic current injection vector.h h
V is
the harmonic voltage vector to be calculated, and Yhis the admittance matrix of the system. In the adopted notation, the superscript b assumes all values of harmonic orders of interest. The superscript 1 (h=1) corresponds to parameters in fundamental frequency.
The elements of admittance matrix should use models whose parameters are frequency dependent. However, there is some disagreement regarding which harmonic models are best for each component of system [11,13].
The admittances of each line feeder section and capacitor banks in end of each section are:
(2) i
i h i
jhX
R
1
y
And
(3)
1 Ci h
Ci
h
y
y
Where, Riand Xithe resistance and the inductive
reactance of feeder section i and 1 Ci
y
, it is the shunt admittance of the capacitor bank in the bus i, in the fundamental frequency.The linear loads are represented by a parallel combination of resistance and inductive reactance. These parameters are obtained through the load data in fundamental frequency. The harmonic admittance of these loads is given by the expression:
(4) 2
1 2
1
i i
i i h Li
V h
Q j V
P
y
In that
P
iandQ
ithey are the active and reactive powers of the linear loads in the bus i.The nonlinear loads are represented by harmonic currents sources whose nominal values to the fundamental frequency are:
Where P~ and i Q~ are the active and reactive power of the i
nonlinear load in the ith bus. In harmonic frequencies, the current source has nominal values:
(5)
1 i h h
i
C
I
I
Where h
C
the percentile value of the current, in the ℎ�ℎ harmonic order.Assuming that the resistance of the harmonic filter is despicable, the admittance of ��ℎ harmonic filter, installed in bus i, is given for:
(6)
2 2
122
1
i C j
j r j r h
F
V
Q
k
h
h
h
h
j
y
j
In that,
h
rjis the absolute value of tuning frequency of��ℎ harmonic filter installed in bus i;
j
k
is the number of capacitive modules of ��ℎ filter, and QCthe size of thecapacitive modules available for installation.
The reactivate power supplied by jth harmonic filter it is expressed for:
(7)
j Cj r
j r h
F
k
Q
h
h
Q
j 2
1
2
IV.
P
ROBLEMF
ORMULATIONIn this section a simple distribution system is considered and the dedicated passive filter (DPF) based structure of passive filters is implemented in system.
The nonlinear load which considered in this research is variable-frequency ac motor drive (VDF).
The objective is to find an optimal selection of
components of passive filter dedicated for each VFD
shown in Fig.2 so that the total harmonic distortion (THD) of the source current gets minimized along with minimized sinking of fundamental frequency current
through the filter section.
mum total harmonic distortion of three-phase current as follows:
(8) ic
ib
ia
THD
THD
THD
X
f
(
)
This paper just takes the initial investment costs of PPF into account. The initial investment costs mainly consist of the costs of the resistor (R), inductor (L) and capacitor (C) used in the passive power filter.
(9)
p iL
C
X
X
R
Cost
1
3 2
1
Where p is the number of the PPF; Ci, Ri , and Li are corresponding parameters of single-tuned filter or high-pass filter respectively.
(10)
n
h h f
n
h h f
n
h h f
hi
i
K
h
i
i
K
i
i
2 2 2
L P
3
2 2 2 C P
2
2 2 2 3 P 1
U
U
U
U
10
U
UC the incremental cost of the capacitor and it is equal to 170×103 LE/MVAR; UL the incremental cost of the reactor and it is equal to 170×103 LE/MVAR; n the harmonic number; K= constant = 0.4KW/MVAR; If the fundamental current component; Ih the harmonic current components; UP is a constant.
Fig2.System configuration
V.
S
ELECTINGO
PTIMIZATIONA
LGORITHMAt first, in order to select a suitable searching method, a small scale system has been considered and harmonic passive filter panning using four intelligent methods including GA, PSO, ABC and BBO is analyzed.
The reason of considering GA, PSO and ABC for optimization this problem and their comparison with BBO and finally selecting the BBO as optimization tool for large scale system is due to its precedence for implementation in passive filter design as mentioned in studies references [13].
The simulation results of this analysis showed the significant computational time reduction and faster
convergence of BBO in comparison with GA, PSO and ABC. Therefore in large scale radial system, the proposed method is solved using BBO.
The GA, PSO, ABC and the BBO algorithms were applied to obtain optimal solution of harmonic passive filter design problem.
The computational time using ABC and BBO is approximately 400 [ms] and using GA and PSO it is 800 [ms]. The time is system dependent, in our case Intel Core 2 duo, T5800 @ 2 GHz.
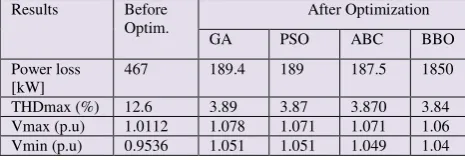
In Table I the comparison results of proposed method based on power loss, maximum total harmonic distortion, maximum and minimum bus voltage using mentioned intelligent methods are shown.
One of the conventional methods of solving this problem is lambda-iteration method but owing to tedious calculations and its inability to solve multi-modal and discontinuous problems, novel techniques have replaced it. The optimal cost of small scale problem was found out to be 1231 [$] using lambda iteration method, while as shown in table 6 the optimal cost is calculated as 1289$, 1252$, 1238$ and 1234$ using GA, PSO, ABC and BBO respectively.
As listed in Table II, the BBO result for optimize the total cost is closer to result of lambda iteration method. As shown in Table II, a total of 350, 380, 150 & 200 iterations respectively were required to converge to the optimal solution for the problem using GA, PSO, ABC and BBO respectively. It is to be noted that the number of iterations for BBO is actually the number of chemo-tactic steps and cannot be directly compared with the number of iterations for GA, PSO and ABC. The final computational time has been obtained by averaging the times for 1000 runs.
The test results show that BBO algorithm converges to optimal cost with reduced computational time when compared to GA, PSO and ABC. This is primarily due to the dispersal feature in BBO that introduce randomness during the optimization process resulting in significant computational time reduction.
In Table III, the comparison of four mentioned optimization approach for passive filter design problem from point of views accuracy, computational time and convergency speed are analyzed.
This Table showed that the BBO with 2 Good and 1 Med score in comparison with ABC with 1 Good and 2 Med score is the most suitable method to search the optimum solution. Therefore the analysis of large scale system has been addressed using BBO method.
Table I Comparison results of proposed method
Results Before Optim.
After Optimization
GA PSO ABC BBO
Power loss [kW]
467 189.4 189 187.5 1850
THDmax (%) 12.6 3.89 3.87 3.870 3.84
Table II Comparison of iterations and computational time
Method Optimal Cost ($) Iterations Computational Time (ms)
GA 1289 350 845
PSO 1252 380 735
ABC 1238 150 586
BBO 1234 200 437
Table III Evaluation of four optimization approaches
method Accuracy Convergency speed
Computational Time
GA Bad Bad Bad
PSO Med Bad Med
ABC Med Good Med
BBO Good Med Good
VI.
B
IOGEOGRAPHYT
HEORYBiogeography Based Optimization (BBO) approach has been developed based on the theory of biogeography. The idea of BBO was first proposed in 2008 by Dan Simon [14]. It is an example of natural process that can be modeled to solve general optimization problems. In BBO, each individual is considered as an island (or a habitat), and the sharing of features between individuals are represented as emigration and immigration in Fig.3. Each solution feature is called a suitability index variable (SIV). Geographical areas that are well suited as residences for biological species are said to have a high habitat suitability index (HSI).
Fig.3.Emmigration of species and new island
Where a high HSI of an island means good performance on the optimization problem and a low HSI means bad performance on the optimization problem. Intensification the population is the way to solve problems in heuristic algorithms. The method to generate the next generation in BBO is by immigrating solution features to other islands, and receiving solution features by emigration from other islands. Then mutation is performed for the whole population in a manner similar to mutation in GAs. In BBO, each individual has its own immigration rate, denoted by
, and emigration rate, denoted by
and are functions of the number of species in the habitat. Fig.4 illustrates a model of specie abundance in a single habitat.Fig.4. Species model of a single habitat
The maximum possible immigration rate to the habitat is I, which occurs when there are zero species in the habitat. The largest possible number of species that the habitat can support is
max
S , at which point the immigration rate becomes zero. The maximum emigration rate is E, which occurs when the habitat contains the largest number of species that it can support. The equilibrium number of species is
0
S , at which point the immigration and
emigration rates are equal.
A good solution has higher; hence, it has a very high chance of borrowing features from other solutions, helping it to improve for the next generation.
Note that emigration in BBO does not mean that the emigrating island loses a feature.
Mathematically the concept of emigration and immigration can be represented by a probabilistic model.
Further suppose that, consider the probability Psthat the habitat contains exactly S species at t. PS changes from time
t
to timet
t
as follows:(11)
Δt ΔtP
P )
Δt Δt
(t)(1 P
Δt)
(t
PS S S S S1 S1 S1 S1
If time
t
is small enough so that equation (17) as0
t
gives the following equation;(12)
max 1
S 1 S S S S
max 1
S 1 S 1 S 1 S S S S
1 S 1 S S S S
S S P
P ) (
1 S S 0 P
P P ) (
0 S P
P ) (
As these relationships are shown in Fig.3 as straight lines but, in general, they might be more complicated curves. The values of emigration and immigration rates are given as:
(13) n
E
ȝ k
k
(14)
) n k (1 I
Ȝk
Fig.5. Illustration of two candidate solutions to some problem
In this case;
(15)
E
kȝ
kVII.
B
IOGEOGRAPHY-B
ASEDO
PTIMIZATIONSuppose that we have a problem and a population of candidate solutions that are represented as vectors. Further suppose that we have some way of assessing the goodness of the solutions. Good solutions are analogous to islands with a high island suitability index (ISI), and poor solutions are analogous to islands with a low ISI. Note that
ISI is the same as “fitness” in other population based
optimization algorithms. BBO mainly works based on the two mechanisms. These are migration and mutation Figs 6, 7.
Fig.6.The migration operator in BBO
Fig.7.The mutation operator in BBO
A. Migration
With probability Pmod, known as habitat modification probability each solution can be modified based on other solutions. If a given solution Si is selected to be modified, then its immigration rate
is used to probabilistically decide whether or not to modify each suitability index variable (SIV) in that solution. After selecting the SIV for modification, emigration rates
of other solutions are used to select which solutions among the population set will migrate randomly chosen SIVs to the selected solution Si.B. Mutation
In BBO species count probabilities are used to determine mutation rates. The probabilities of each species count can be calculated using the differential equation as mentioned in equation (17). Each population member has an associated probability, which indicates the likelihood that it exists as a solution for a given problem. If the probability of a given solution is very low then that solution likely to mutate to some other solution. Similarly if the probability of some other solution is higher than that solution set has very little chance to mutate. Mutation rate of each set of solution can be calculated in terms of species count probability using the equation;
(16)
max S max
P
P
1
m
m(S)
Where
m
maxis a user defined parameter.VIII.
S
IMULATION ANDR
ESULTSTable IV- System parameters of large scale system
Elements Parameter Value
AC mains 230V,50Hz
Load impedance
F 300 C 10 R : 3 VFD
F 300 C 15 R : 2 VFD
F 300 C 15 R : 1 VFD
L L
L L
L L
Transformer
equivalent 0.15, 6mH Passive filter
F 86 . 18 C mH 34 . 10 L
F 34 . 36 C mH 34 . 10 L
7 7
5 5
Cable impedance 0.6/km,0.3mH/Km,3F/km
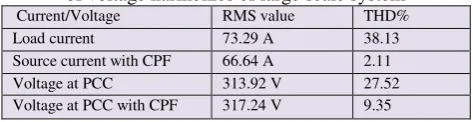
In this study two conditions are considered. At first it is assumed that the main AC source is devoid from voltage harmonics and in second study it is assumed that due to injection of other harmonics current, the main source which feeds the nonlinear load is previously harmonic distorted. The result of simulation when power source is devoid from voltage harmonics is presented in Table 5. It clearly shows that the application of passive filters reduces the net rms source current from 73.3 to 66.6 A for a single common passive filter (CPF) at the bus.
Table V- simulation result assuming main source is devoid of voltage harmonics of large scale system
Current/Voltage RMS value THD%
Load current 73.29 A 38.13
Source current with CPF 66.64 A 2.11
Voltage at PCC 313.92 V 27.52
Voltage at PCC with CPF 317.24 V 9.35
When power source is distorted with voltage harmonics, the application of passive filters reduces the net rms source current from 82.11 to 72.76 A for a single common passive filter at the bus. This result is listed in Table VI.
Table VI- simulation result assuming main source is distorted with voltage harmonics of large scale system
Current/Voltage RMS value THD%
Load current 82.11 42.72
Source current with CPF 72.76 1.34
Voltage at PCC 312.4 31.09
Voltage at PCC with CPF 340.2 8.57
Table VII clearly shows that the application of passive filters reduces the net rms source current from 73.3 to 72.8A for multiple DPFs for each VFD. It can be clearly seen that the THDs of current and voltage have been improved further with DPF performance of passive filters.
Table VII- Simulation results for DPF application of PPF of large scale system
Current/Voltage RMS value THD%
Load current 73.29 A 38.13
Source current with DPF 72.88 A 1.27
Voltage at PCC 313.92 V 27.52
Voltage at PCC with DPF 328.57 V 6.93
In table VIII the comparison results of proposed method based on power loss, maximum total harmonic distortion,
minimum bus voltage and system cost is shown.
Table VIII. Comparison results of proposed method of large scale system
Results Before
Optimization
After Optimization
Power loss [kW] 624 278
THDmax (%) 10.39 3.98
Vmax (p.u) 1.0021 1.0879
Vmin (p.u) 0.9661 1.0513
Total Cost ($/year) 21441 15382
IX.
C
ONCLUSIONThis study deals with optimizing the placement and size of passive filters by BBO algorithm, economically. The algorithm constrains are number/size of installed LC passive filters, limit candidate buses for LC installation, the limitation voltage limits and the voltage total harmonic distortion (THDv) in all buses define by standard IEEE-519.
In this example, the problem consists of planning three passive harmonic filters, whose harmonic tuning orders are 4.7 (for 5th harmonic), 6.7 (for 7th harmonic) and 10.7 (for 11th harmonic), respectively.
Due to dependency of reactive capacity of passive filter to harmonic tuning orders and the reactive capacity of shunt capacitors and on the other hand because of dependency the investment cost of filter to filter capacity, so the proposed algorithm optimize the optimum location, size and harmonic tuning orders. Results of simulation before and after optimizations are compared, which indicate power loss, maximum THD and annual cost after optimization using proposed method, decreased to 55.45%, 61.7% and 28.25% in large scale system, respectively. Results show that the proposed method is suitable for optimal passive filter placement and sizing in presence of voltage and current harmonic in distribution network.
X.
A
CKNOWLEDGMENTThis Study Was Supported by Islamic Azad University, Borujerd Branch, Iran. The authors would like to acknowledge staffs of University.
R
EFERENCES[1] Kawam C, Emuel AE, (1996),“Passive Shut Harmonic Filters For
Low and Medium Voltage: A Cost Comparison Study,”IEEE Trans. on Power Sys.,11(4), pp-1825-1831.
[2] Omneyer TH and Hiyama T (1996),“Distribution System Harmonic Filler Planning,”IEEE Trans. on Power Delivey, 11(4): 2005-2012. [3] Verma V and Singh B, (2010). Genetic algorithm-based design of
passive filters for off shore applications,”IEEE Trans. on Ind. Appl., 46(4),pp- 312-318.
[4] Chen, YM (2003).,“Passive Filter Design Using Genetic Algorithm, IEEE Trans. Indus. Electr.,50(1),pp-110-119.
[6] Henderson RD, Rose PJ, (1994),“Harmonics: The effects on power quality & transformers,”IEEE trans. on Indus. Appl., 30(3), pp- 528-532.
[7] Messey GW, (1994),“Estimation methods for power system harmonic effects on power distribution transformers,” IEEE Trans. on Indus. Appl., 30(2), pp- 485-489.
[1] [11] Z. Juan, G. Yi-nan, Z. Shu-ying, (2009), Optimal design of passive power filters of an asymmetrical system based on genetic algorithm, Procedia Earth and Planetary Science 1(1) , pp-1440-1447.
[2] [12] S.Singh, B. Singh, (2014), Optimized Passive Filter Design Using Modified Particle Swarm Optimization Algorithm for a 12-Pulse Converter-Fed LCI–Synchronous Motor Drive, IEEE Trans. Industry Applications 50 (4), pp- 2681-2689.
[8] Akagi H, (2006),“Modern active filters and traditional passive
filters,”Bulletin of the polish academy of sciences technical sciences, 54(3),pp- 167-78.
[9] Seyed Abbas Taher, Hasani M, Karimian A, (2011), “A novel method for optimal capacitor placement and sizing in distribution systems with nonlinear loads and DG using GA,”Commun Nonlinear SciNumer Simulat,16(11), pp- 851–862.
[10] Rao RS, Narasimham SVL, Ramalingaraju M, (2011), “Optimal capacitor placement in a radial distribution system using Plant Growth Simulation Algorithm,”Int. J. of Elect. Power and Energy Sys.,33(5), pp-1133-1139.
[11] Chis M, Salama MMA, Jayaram S, (1997),“Capacitor placement in distribution system using heuristic search strategies,”IEE Proceedings-Generation, Trans. and Distrib., 144(3), pp- 225–230. [12] Simon D, (2008), “Biogeography-Based Optimization,”IEEE
Trans. on Evolu. Comput, 12(6), pp-702-713.