Turkish Journal of Fisheries and Aquatic Sciences 12: 817-830 (2012)
www.trjfas.org ISSN 1303-2712 DOI: 10.4194/1303-2712-v12_4_10
© Published by Central Fisheries Research Institute (CFRI) Trabzon, Turkey in cooperation with Japan International Cooperation Agency (JICA), Japan
Impact of Depth and Season on the Demersal Trawl Discard
Introduction
As yet unknown, however seemingly very high quantity of the marine animals, including mammals, sea birds and reptiles as well as non-target, low-value species and undersized fish of valuable commercial species killed in fishing operations never make them to market. As reported by the UN's Food and Agriculture Organization, the quantity of unwanted fish catch thrown back each year may be as high as 8
million tons (Kelleher, 2005). The percentage of discard is particularly high for some types of fishery, such as bottom trawling (Alverson et al., 1994). In some areas characterized by multi-species complexity, such as in the Mediterranean Sea, the trawl discard is especially high since very narrow cod-end mesh size is used to catch diverse small sized commercial species (Machias et al., 2001). The unwanted catch, in general, is a concern threatening the entire marine ecosystem. On the other hand,
Ali Cemal Gücü
1,*
1
Middle East Technical University, Institute of Marine Sciences, P.O.Box 28, Erdemli, 33731, Mersin, Turkey.
* Corresponding Author: Tel.: +90.324 5212150; Fax: +90.324 5212327; E-mail: gucu@ims.metu.edu.tr
Received 17 July 2012 Accepted 14 October 2012
Abstract
Given that the discard has crucial impact on the coastal ecosystems, various countries around the world adopted various regulations to reduce the discard of non-commercial and undersized commercial species in the trawl catch, such as trawl exclusion depths and closed season. In this work discarded part of the catch of a trawl has been assessed to evaluate impact of depth and season. Monthly trawl-survey data, collected by the same research vessel operating all year round over the entire depth ranges of the same fishing ground, were used in order to minimize the sources of variation. By this mean, potential rather than absolute composition and quantity discarded by a trawl boat were estimated regardless of fishing regulations applied to the fleet. A generalized additive model was used to model the quantity of discarded catch as a function of depth and time. The model outputs were then used to quantify the impact of fishing regulations on the reduction in discard. The results suggested that the quantity of the catch returned to the sea is reduced 49% by trawl closure and 57% by trawling depth limitations. Overall, season and depth regulations reduce the discard by 77% at the expense of a 73% reduction in marketable catch. Finally, past trawl-survey data collected in the 1980s at the same site with the same research vessel and with the same net were used to evaluate possible impacts of regulations on the modification of fish composition
Keywords: Discard, depth, season, demersal trawl, GAM.
Demersal Trollerde Mevsim ve Derinliğin Iskarta Oranına Etkisi
Özet
Değişkenliğe sebep olabilecek kaynakların en aza indirilebilmesi için tüm yıl boyunca aynı avcılık sahasında tüm derinlik katmanlarında aynı araştırma teknesi ile toplanmış aylık trol örneklemesi sonuçları kullanılmıştır. Bu yolla, bölgede uygulanan balıkçılık düzenlemelerinden bağımsız olarak potansiyel ıskarta miktarı ve komposizyonu elde edilmiştir. Iskarta edilen av miktarı Generalized Additive Model kullanılarak derinlik ve zamanın fonksiyonu olarak modellenmiştir. Bunun üzerine elde edilen model uygulanan balıkçılık düzenlemelerinin ıskarta miktarını üzerindeki etkisinin sayısallaştırılmasında kullanılmıştır. Sonuçlar, trollere uygulanan ava kapalı dönem ile %49, derinlik (mesafe) yasakları ile ise %57 azaltılmaktadır. Bu düzenlemeler toplamda ise pazarlanabilir avda %73 azalmaya karşılık ıskarta miktarını %77 azaltmaktadır. Ayrıca 1980‟lerde aynı alanda aynı araştırma teknesi ile yapılan benzer bir çalışmanın sonuçları uygulanan söz konusu düzenlemelerin balık komposizyonunun şekillenmesindeki olası etkilerinin değerlendirilmesinde kullanılmıştır.
818
unaccounted discard mortality causes significant bias in the fisheries regulation practices that are implemented to reduce fishing pressure on an ecosystem (Eayrs, 2007).
There are various measures enforced to reduce by-catch and discard, such as mesh size regulations, use of species exclusive or by-catch reduction devices (BRDs) etc. However effective implementation of these measures may sometimes be a cumbersome matter particularly in the multi-target fishing grounds. For instance, use of turtle exclusive devices (TEDs) or BRDs are claimed to reduce the catch and therefore protested by the fishermen community. Likewise, there is a consensus, among scientists that the discard rate is negatively related to cod-end mesh size and mesh geometry (Ordines et al., 2006; Bahamón et al., 2007). Several solutions based on selectivity experiments have been suggested to reduce the discard rate (Sacchi 2008). The selectivity studies enabled the quantification of the effectiveness on the target species of changing the shape and mesh size of a net (Sardà et al., 2006). However, in practice it is impossible to enforce a unique cod-end mesh size for the entire range of species, especially in the tropics and subtropics, due to the multi-species nature of the catch and the highly variable size range of fish over the fishing grounds. Another important concern is the fate of animals escaping from the net. Although some studies suggest a high survival rate of fish escaping the trawl net, (Düzbastılar et al., 2010) the factors such as net entrainment, wounding, sustained swimming until exhaustion, changes in pressure, biological attributes, immediate predation by atracted predators are still a matter of concern (Suuronen, 2005).
The rate of discard is altered by several factors. The depth of the fishing ground, total catch, tow speed, tow duration, species mix, year class strength and the season are among the critical factors contributing to the discard rate (Murawski, 1996). How strict the authorities are in monitoring the landings, the market demand for the species and other socio-economic aspects of fisheries were also shown to be important (Machias et al., 2004). An important step in the solution of such a complex situation, which involves several sources of variation acting together, would be to discriminate each of the factors affecting the level of discard. The studies addressing the estimation of the discard of a fishing fleet operating in an area are generally and naturally based on sampling directly conducted onboard commercial fishing boats. On the other hand, this increases the sources of variance due to the varying capacities of fishing boats, fishing gear design, the skills of fishing crew, etc. and makes itemization of the factors harder. Also, an attempt to discriminate different factors may require data from the regions and seasons which are restricted to commercial fleet.
Another important aspect of this issue is, any attempt to reduce discard is essentially a manipulation
on ecosystem. Giving more chance to a part of the fauna to survive, would eventually alter the food web structure in the ecosystem, particularly when the differences in their natural productivity are considered. To better mitigate adverse ecological effects of fishing Garcia et al. (2012) suggested maintaining the size and species composition through a strategy aiming at balanced harvesting distributing mortality over the species, stocks, and size ranges in an ecosystem.
Thus in this study, instead of direct sampling onboard a commercial trawler, the discard was modelled and simulated using the data collected by a research vessel. The results were assessed to answer; i) the extent to which the implications of depth and time limitations may reduce the discarded catch individually; ii) how high the cost of these regulations may be; ii) if and how depth and time limitation enforced in an area alters the fish assemblages over a fishing ground.
Materials and Method
A.C. Gücü / Turk. J. Fish. Aquat. Sci. 12: 817-830 (2012) 819
analysis. Stations sampled between 2007 and 2010 are depicted in Figure 1.
Since the data was collected on a research vessel rather than a commercial trawl boat, the analyses were based on hypothetical quantities, here called the „virtual discard‟, used as the surrogates of the quantities that would have been discarded in a commercial trawl boat. In a commercial boat of the region, the part of the catch to be retained is determined by the skipper of the boat who is usually guided by a wholesaler. Therefore, in order to simulate the sorting of the catch in a commercial vessel and to determine the species for retention and their minimum size, the skipper of a commercial trawler and a wholesaler (both employed by the research boat) were consulted. Later, it was assumed that the discard has two components and the weight of the discarded fraction of the samples was estimated using the following equation;
ret sp
L L L sp b sp n sp f L a US US NC discard Virtual 0 , 1 ; _
Where NC is total weight of the non-commercial species; US is the undersized categories of the commercial species; sp is the commercial species; L is the length class, Lret is the minimum size retained (determined by the skipper/wholesaler), sp,L is the
number of individuals in the catch at length class L of species sp; asp and bsp are the parameters of the length-weight relation of species sp estimated in the lab. The retained catch is estimated by subtracting virtual discard from the total catch. The loss of fishermen is calculated as follows;
12 _ i i d j ij d ret pot ret pot ret act ret loss _ 100 _ 1 % where; ret_pot is the estimation of the quantity of the retained catch if a boat is operated all over the depth ranges and months disregarding the regulations; retij is the retained catch at depth strata “j” in month
“i”; “dj” is the number of hauls at depth strata “j”;
loss% is the loss of fishermen in percent; ret_act is the retained catch of a boat operating over the depth and months permitted by the regulations in question;
In the statistical analysis, one-way ANOVA was performed to test whether the discarded catch are statistically different for different periods (1980s and 2000s). To test the year to year variation, nested design ANOVA (months nested in years) was used. Two-way ANOVA was used for the initial evaluation of the interaction between discard, depth and time. The Kruskal-Wallis test for normality and Levene's test for the homogeneity of variances were used to check whether data agreed with the underlying assumptions of ANOVA (Zar, 1984). Data was normalized by log transformation where the raw data deviated from normality. Prior to further modelling, a Spearman‟s rank correlation test was carried out to check for co-linearity between these two factors.
For each species, the virtual discard was standardized (per trawling hour), the log transformed and the data used to populate a species-by-station (sample) matrix. Bray–Curtis similarity was calculated between samples and used for nearest-neighbour cluster analysis. Later, all samples collected in a month (disregarding the year and depth) were pooled to evaluate seasonality in the discard composition using the same test of similarity.
A generalized additive model (GAM) was used to examine the variation in the quantity of discard and to identify the extent to which the factors explain the
BLACK SEA TURKEY MEDİTERRANEAN SEA Northeast Mediterranean Mersin 34.0°E 35.0°E 36.0°N 36.5°N
820
variability in discarded catch. The model allowed the additive non-linear effects of the factors depth and time without specifying a single equation for each factor. The virtual discard is log transformed as the continuous response variable with a LOG link function assuming a Gamma distribution. Explanatory variables were included as cubic spline smoothers. The model used in the study utilized two iterative processes, outer and inner loops. The former maximizes the overall fit of the model, by minimizing the likelihood of the data; while the latter refines the cubic spline smoother. The iteration estimation procedure terminated when the likelihood of the data, given the model, could not be improved (Schimek, 2000). Here the outer loop convergence threshold was set to 1.e-5, while the inner loop criterion was set to be less than 1.e-6. Estimated GAM parameters were then used to predict discard over a response array covering all depths (0–200 metres) and the entire calendar year (1–365 days). Each of the discard values, predicted for all possible combinations of depth and time pairs, were plotted on a 3D surface chart. The model predicted discard values were then sorted, from the lowest to the highest, and their cumulative sums of percentages plotted on a contour chart with respect to the corresponding depth and time coordinates.
Results
Composition of Discard
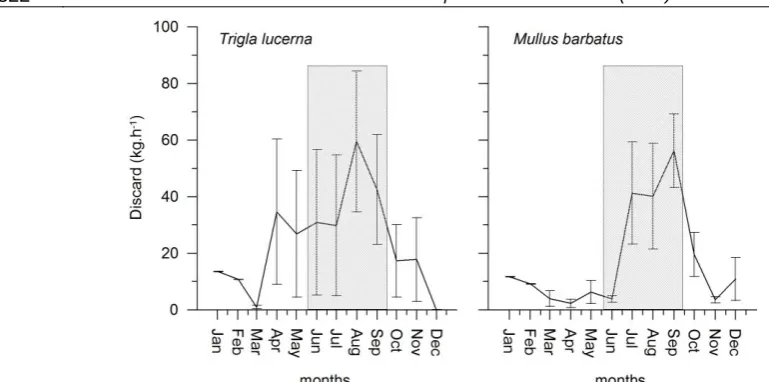
A comparison between the 1980s and the 2000s reveals a remarkable change in the discard composition, however not all taxonomic groups changed in the same manner; the lessepsian fish that migrated to the Mediterranean Sea after the opening of the Suez channel have increased remarkably, while the native teleosteans have changed little. The increase in lessepsian fish is more noticeable at shallow depths. More importantly, invertebrates such as crustaceans and echinoderms, in particular, have almost disappeared in the 2000‟s (Table 1). The main contributor to the discard was L. klunzingeri, a lessepsian immigrant in the 1980s. Later in the 2000s, this species was still among the highest contributors of the discard generated on the upper continental shelf with the exception of the infralittoral zone (down to a depth of 30 metres). In this very shallow zone, it was replaced by a native species, Bothus podas. The second important contributor of discard at depths shallower than 100 metres was undersized red mullet, Mullus barbatus, which represented a relatively low involvement in the 1980‟s. Another noteworthy component of discard, which was abundant in the 1980s and later disappeared in the 2000s, is the tub gurnard, Trigla lucerna. The monthly appearances in the discard of this species and M. barbatus with respect to the trawl season enforced by the fisheries regulations are presented in Figure 2. The highest
value of M. barbatus discard was observed within the close trawl season. T. lucerna has a longer period of appearance in the discard compared with the former species and only a part of that period remains within the trawl closure.
The similarities in the species composition of discarded catch at stations sampled between 2007 and 2010 are given in Figure 3. At first sight, it is clear that there are two distinct groups of stations with respect to their discard composition. The stations located deeper than 120 metres were grouped as a single cluster. Among them, very deep stations located on the continental slope represent a dissimilar group, totally different than the rest. The cluster comprising shallower stations is further divided into two clusters below 25% similarity. The one on the right hand side represents the stations on the infralittoral zone. At a higher similarity value, the stations deeper than 60 metres are distinguished from the rest. The rest of the stations within this cluster are those located over the circalittoral zone. Within the circalittoral cluster, stations are grouped according to the season in which they were sampled. One group represents the discard in the samples collected between late summer and early winter and the other represents the rest of the year.
In summary, the samples are grouped under five main categories with respect to the discarded catch composition; infralittoral (9–30 m), upper circalittoral (30–50 m), lower circalittoral (50–120 m), lower shelf (150–220 m) and shelf break (>250 m) with further seasonal distinctions in the upper circalittoral zone. The data averaged over these bathymetric classifications are given in Table 1. Since the sampling in the 1980s was carried out only on the upper continental shelf (Figure 1) with no depth measurement, no meaningful clustering was found and the averaged data is given in the same column in Table 2. When the first three depth strata of the 2000s are taken into consideration, the discard composition has a very low resemblance to those of the 1980s (Spearman r=-0.042; P=0.640) indicating that there has been a significant change.
In a further analysis of the clustering, the stations are grouped under two clusters when the data were averaged over the months, disregarding the year of sampling. The summer months (June–October) and winter months (November–May) formed two dissimilar clusters (Figure 4).
A.C. Gücü / Turk. J. Fish. Aquat. Sci. 12: 817-830 (2012) 821
The monthly averages of the discard in weight represented no statistical difference in the 1980s (P=0.226); indicating the lack of a seasonal pattern. However, in the 2000s, a significant difference was found between months (P=0.005) suggesting strong seasonality in discard similar to the pattern observed in the species composition of the discarded catch (Figure 5).
The monthly discard variations in the 2000s are disintegrated into non-commercial and undersized commercial components in Figure 6. The monthly averages of the non-commercial components do not differ statistically (P=0.135), although the summer and autumn (July to November) averages are higher
than the rest. The undersized category of the commercial species, on the other hand, presented a very pronounced increase in July and August significantly higher than the rest (P=0.000).
Figure 7 represents variations in quantity of discard by depth and by month between 2007 and 2010. The decreasing trend in the quantity of discard by depth is evident in almost all plots where the higher discard is observed at shallower depths (0–50 m). The same pattern applies to both categories of discard, non-commercial and undersized commercial species, and may be more so for the latter category which represents zero value except for a few winter months. The overall trend is not linear. The values Table 1. The list of species that accounts for 90% of the discard (left: per h; right:%) by depth ranges (A=0–25 m; B=25–50 m; C=50–100 m; D=100–250 m and E=>250 m) and the depth range percentage within total
1980s A B C D E 1980s A% B% C% D% E%
Lessepsian fish – total 3739 15189 12322 3190 - - 28,3 26,3 47,3 24,7 0,1 - Lagocephalus sceleratus - 470 91 192 - - - 0,8 0,4 1,5 - - Lagocephalus spadiceus 255 354 650 108 - - 1,9 0,6 2,5 0,8 - - Lagocephalus suiezensis - 2920 679 15 - - - 5,1 2,6 0,1 - - Leiognathus klunzingeri 3439 8129 9606 2237 - - 26,1 14,1 36,9 17,3 0 - Upeneus moluccensis 10 93 593 411 - - 0,1 0,2 2,3 3,2 - - Upeneus pori - 1681 232 0 - - - 2,9 0,9 - - - Native fish – total 6783 39146 14916 8502 4847 14426 51,4 64,3 51,1 61,5 84,8 99,8 Arnoglossus laterna 1319 449 1192 286 34 - 10 0,7 4,3 2,1 0,6 - Arnoglossus thori - 4 4 531 30 - - 0 0 3,9 0,5 - Bothus podas podas 499 15288 171 1 0 - 3,8 24,1 0,6 0 - -
Capros aper - - - - 120 - - - 2,1 -
Chlorophthalmus agassizi - - - - 59 9626 - - - - 1 66,6 Citharus linguatula 1124 8 521 640 413 - 8,5 0 1,9 4,8 7,2 - Coelorhynchus coelorhynchus - - - 605 - - - 4,2 Dasyatis pastinaca 1547 6271 1446 660 75 - 11,7 9,9 5,2 4,9 1,3 - Dipturus oxyrinchus - - - 625 - - - 4,3 Echelus myrus 7 - 6 18 106 - 0,1 - 0 0,1 1,8 - Engraulis encrasicolus 1 11 32 312 28 - 0 0 0,1 2,3 0,5 - Glossanodon leioglossus - - - - 237 - - - - 0 4,2 - Gobius niger jozo - 1 498 21 - - - 0 1,8 0,2 0 - Gymnura altevela 179 1711 2830 - - - - 2,7 10,2 - - - Lepidotrigla cavillone 289 5 152 363 268 - 2,2 0 0,5 2,7 4,7 - Lepidotrigla dieuzeidei - - - 14 157 - - - 0 0,1 2,7 - Macrorhamphosus scolopax - - - 27 632 - - - - 0,2 11,1 - Mullus barbatus 258 8746 4432 1892 35 - 2 13,8 16 14,1 0,6 - Mustelus mustelus 82 - - 498 147 - 0,6 - - 3,7 2,6 - Myliobatis Aquila 288 - 616 56 - - 2,2 - 2,2 0,4 - - Pagellus erythrinus 7 351 406 111 - - 0 0,6 1,6 0,9 - - Raja clavata - - 76 104 1246 625 - - 0,3 0,8 21,8 4,3 Raja radula - 1662 72 112 393 1370 - 2,6 0,3 0,8 6,9 9,5 Rhinobatus rhinobatus - 1738 70 0 - - - 2,7 0,3 - - - Sardina pilchardus - 46 161 257 55 - - 0,1 0,6 1,9 1 - Scyliorhinus canicula - - - 35 459 464 - - - 0,3 8 3,2 Scyliorhinus stellaris - - - - 164 - - - 2,9 - Serranus hepatus 36 5 64 923 13 - 0,3 0 0,2 6,9 0,2 -
Trigla lucerna 658 - - - 5 - - - - -
Crustacea – total 1686 172 354 304 2 - 12,8 0,2 1,3 2,3 0 - Carybdis longicollis 746 92 295 282 - - 5,7 0,1 1,1 2,1 - - Erugosquilla massavensis 940 80 59 11 - - 7,1 0,1 0,2 0,1 - - Mollusca – total - 5241 24 18 513 33 - 8 0,1 0,1 7,9 0,2 Sepia elegans - 38 24 16 374 - - 0,1 0,1 0,1 6,5 - Strombus persicus - 5198 - - - 8,2 - - - -
Tunicata – total 1 - 40 1341 - - 0 - 0,1 10,3 - -
Pennatula phosphorea 1 - 40 1341 - - 0 - 0,1 10,3 - - Echinoderm – total 973 22 9 56 364 0 7,4 0 0 0,4 4,8 - Antedon mediterraneus 1 22 - 17 342 - 0 0 - 0,1 4,7 -
Asteroidae 558 - - - 4,2 - - - - -
Cidaris cidaris 338 - - 42 5 - 2,6 0 0 0,3 0,1 -
Ophiuridae 76 - - - 0,6 - - - - -
822
reach a minimum at depths of around 150 m and then increase again. The impact of depth and time of the year on the quantity of discarded catch were assessed applying two-way ANOVA analysis (Table 3). The results show that only one MS, representing the depth ranges classified in Figure 3, is highly significant, indicating that depth is the main factor determining the quantity of discard. The time and the combined effect of time and depth are not significant. The absence of interaction may mean that the trend is the same among the months. On the other hand, the MS for the main effect of time actually represented a probability figure very close to the critical level of 0.05. As can be seen from the figure, the discards between July and November are essentially higher than for the rest of the year.
The significance of season, which is probably masked by the effect of depth in the parametric test, is better represented by the GAM results although the impact of depth is still greater by far (Table 4). More specifically, the model predicts very high values at shallow depths down to 50 metres and the values are particularly high between July (180) and November (300) (Figures. 7 and 8). The results of the model prediction over the entire range of depths and for the entire span of a year are given in Figure 9. There is a noticeable agreement between this figure and Figure 7 indicating that the model grasped the general patterns. The analysis estimated discarded catch with an expectable accuracy (P=0.000; chi2 test).
The smoothed response to depth and time on a logarithmic scale displayed in Figure 9 is the combined effect of both predictors on the discard size. The impact of depth in shaping the chart can easily be seen. The effect of the seasons seems to enhance the effect of the depth above 50 metres in the second half of a calendar year.
The cumulative percentages of the discard values predicted over the depth and time array is presented on the contour chart (Figure 10). This chart may be used to estimate (or manage) the lowest
discard areas with respect to time and depth. That is, if a trawl boat is operated within the depth and time limits delineated by the 10% isobar (marked by „1‟)
on Figure 10, the discard produced in a year would not exceed 10% of the maximum discard that could be produced without limitations.
The contour chart is used to evaluate the effectiveness of the depth and time regulations actually applied in the study area (the trawl fishery at a distance of two miles from the coast as this area is excluded for trawl fishery). The figure suggests that the catch returned to the sea is reduced by 48.61% by banning trawling from mid-April to mid-September and by 57.04% by the two-mile trawl exclusion which passes through 50 metres isobar on average.
The retained part of the catch is given in Table 2 and changes in its month- and depth-wise variations are displayed in Table 5. In general, the highest percentage of the catch is retained at the shallow stations and there is a decreasing trend towards the deeper parts. The percentages are low in winter. When both regulations are combined and the distribution of retained catch in Table 5 is considered, the discard is reduced by 77.28% by the existing discard regulations in the study area at the expense of a 73.4% reduction in the marketable catch.
Discussion
Figure 3. Percent similarities of the discarded catch (Bray & Curtis, Group Average Linkage) at all stations sampled between 2007 and 2010
A.C.
G
ü
cü
/
T
u
rk
. J
.
Fi
sh
.
Aq
u
at.
Sc
i.
1
2
:
8
1
7
-8
3
0
(2
0
1
2
)
824
variability such as size, horse power, fishing gear specifications (design, mesh size, etc.), skill of the skipper, tow duration, geographic differences, bottom type, etc. The importance of Mediterranean Sea in the understanding the mechanisms of discard is that the fishing grounds like those in the Mediterranean, where commercial species are small and where the
catch comprises multi-species, the discard rate is alarmingly high (Alverson et al., 1994; Tudela 2004). For instance, 13500 t to 22000 t per annum have been discarded at sea in the Aegean and Ionian seas (Machias et al., 2001) which accounts for 44% (39– 49%) of the total trawl catch. Although the vessel and the trawl net design used in the present study were Table 2. Summary of the results and comparison of 1980‟s and 2000‟s
1980-1982 2007-2010 2007-2010* P (t-test) P* (t-test)
Retained (kg.h-1) 20.9 ± 3.4 20.6 ± 3.9 22.8 ± 4.8 0,9007 0,5141 Discarded (kg.h-1) 13.4 ± 2.0 26.1 ± 6.6 31.6 ± 8.1 0.0005*** 0.0000***
% discard 40.87 % 48.28 % 51.85 % 0.0051*** 0.0001***
# of discarded species 48 115 88 - -
# of retained species 51 73 64 - -
# of hauls 110 118 92 - -
min % discard 9.24 % 6.23 % 6.23 % - -
max % discard 85.88 % 93.45 % 93.45 % - -
Figure 4. Monthly similarities of discarded catch (Biomass, Bray & Curtis, Group Average Linkage) at all stations sampled between 2007 and 2010
A.C. Gücü / Turk. J. Fish. Aquat. Sci. 12: 817-830 (2012) 825
Figure 6. Monthly variations in the discarded non-commercial (left) and undersized (right) species
Figure 7. Variations in the discarded quantities by month and depth; „+‟ represents an undersized category of commercial species; „‟ represents non-commercial species.
Table 3. Two-way ANOVA results of discard (log transformed) by months and by depth ranges, and their interactions.
SS df MS F P
Months 1,12 2 0.558 2,99 0.055
Depth range 11,31 2 5.654 30,31 0.000***
Month X Depth range 6,01 33 0.182 0,98 0.514
Error 17,35 93 0.187
Table 4. Summary statistics of the generalized additive model (Log link function over Gamma distribution r2=59.2%)
Predictor GAM coef. s.e. P
Intercept 1 1,4306
Depth 3,996 -0,0012 0.0000***
826
identical to those of the commercial fleet of the region, the absolute values of discard were not evaluated to estimate the discarded catch in the area. Nevertheless, it may be worthy to note that the virtual discard rate observed in the study is close to the upper margin of the trawling discard (20–50%) in other Mediterranean areas (Moranta et al., 2000; Machias et al., 2001; D‟Onghia et al., 2003; Sartor et al., 2003;
Sanchez et al., 2004, 2007).
As it has already been documented by Sanchez et al. (2004) by far the highest quantity of discard was generated at shallow depths (down to 35 m) and the depth was found to be a significant factor governing a great deal of variability in the quantity of discard. The both findings agree that the ecological use efficiency (retained/catch) at the shallow depths was the lowest. Figure 8. The smoothers given by generalized additive modelling
A.C. Gücü / Turk. J. Fish. Aquat. Sci. 12: 817-830 (2012) 827
It should be added that the time of a year has not been considered in Sanchez et al. (2004)‟s work. However in another study, they observed seasonal patterns in the retained/discarded catch in the Adriatic and Catalan Seas in the Mediterranean, and they explained the seasonality as the result of the variation in the level of fishing intensities (Sanchez et al., 2007). They observed slightly higher retention fractions in the periods of high fishing intensity, which does not agree with the findings of the present study. This study examines two different time periods; 1980‟s and present. In the 1980s the number of bottom trawlers was only one tenth of the size of the trawl fleet today (Anonymous, 2007). Yet, the retained fraction of the catch was significantly higher than present (Table 2). This may show that intensity of fishing has a lesser effect in the seasonality of discard, at least for this study. Seasonal variation in the discard was also noted in a study carried out in a Catalan port (Tudela, 2004) where the highest amount of catch was discarded in spring by the larger boats and in summer by the small ones operating on shelf bottoms shallower then 150 metres.
The monthly strength of recruitment of the target species (Figure 11) and almost identical pattern in the monthly discard variations (Figure 5) draw attention to the importance of the recruitment time of the fish in the determination of discarded quantity. This is not surprising because it is evident that the undersized commercial fish category would attain higher quantities during the peak time of recruitment. However, the similar, though not so pronounced, seasonality observed in the non-commercial category (Figure 6) is not necessarily linked to the recruitment period, especially when the composition of dissimilar species observed during the high discard period is considered (Figure 4). Therefore, in a statistical sense, there are 4 dissimilar populations within the data examined; two determined by season and two
determined by depth.
Mesh size and mesh shape regulation is a very useful tool to reduce discard of undersized fishes however when the multispecies complexity is concerned this may not be a concrete solution. The General Fisheries Commission for the Mediterranean (GFCM) has adopted the use of a minimum 40 mm square mesh codend or a diamond mesh size of at least 50 mm in the GFCM Area to achieve higher size selectivity (GFCM Recommendation, REC.CM-GFCM/33/2009/2). As demonstrated in the results of several studies, implemented mesh size regulation improves the selectivity of the trawl nets used in the Mediterranean. However it may not always be sufficient to reduce discard of undersized fishes (Özbilgin et al., 2012) and to retain commercial size (Aydın et al., 2011) of major target species.
As demonstrated by the results given above, fishery regulations based on depth and season limitations may be supplementary tools in significantly reducing the discard. However in return, the economic loss of a trawler, especially due to the close season, is a major concern raising resistance in the application. For instance, if no limitation is applied to the fishery and if the trawl fleet is operated over the entire depth ranges all year round, the model predicts a very high discard rate of almost 54%. In this case, the loss of the fleet would naturally be null. The local fisheries regulations applied in the area where the study is conducted includes a ban of trawl fishery from mid-April to mid-September and two mile trawl exclusion zone, which corresponds to an average depth of 50 meters. The results suggest that these regulations reduce the discard rate to 34% at an expense of about 73% economic loss to fishermen. As a considerable part of the discard in the banned season and at depth is composed of undersized commercial species, management may still regard the regulation as a reasonable trade-off.
828
As another example, the closed trawl season in Greece is from June to the end of September (Presidential Decree no 817/1966) and trawlers are allows to operate at depths greater than 50 m or at a distance greater than 3 mile (EC Regulation no 1626/1994). The GAM model developed in this study estimated that the depth and time regulations applied in Greece would reduce the discard to 40% discard rate which is slightly less than the figure given by Machias et al. (2001). In Spain, the same depth ranges are delimited; however two closed seasons are enforced in a year: May and October. The model suggests that the regulations reduces the trawl discard rate to 35% which is consistant with the general view proposed for that region (Moranta et al., 2000; Sanchez et al., 2004, 2007).
On the other hand, a comparison of the discard composition of the 1980s and the 2000s may answer the following question: what could have been the consequences of such a fisheries regulation on the fisheries ecosystem in the long run? The first answer is that the discard rate has increased from 40% to 51% within the last 30 years. The results also point to a significant change in demersal fish assemblages within the same period, as reflected in the discard composition. A part of the change is due to new species, not exploited and hence, not sampled in the 1980s, inhabiting the depths below the continental shelf. Another part is due to the introductions of new lessepsian species favoring warmer shallower depths (Golani, 1994; Gucu et al., 2010). There are, however, some cases showing that the impact of selective fishery on these changes should not be overlooked. Lack of seasonality in the 1980s and strong seasonal patterns in the discard of the 2000s may be considered as a sign of fishery driven ecosystem modification. As Tudela (2004) stated earlier, fishery changes the biomass and demographic structure of different species by changing the balance between competitors and/or by increasing food availability for certain groups through discards, for instance by favoring scavengers (Moranta et al., 2000). In the study area, each of the discard components actually had a pattern in the 1980s (Gucu, 1991). However these individual patterns were leveled out when combined. Throughout the years, each of the species observed in the discard was subjected to ever increasing and seasonally altered fishing pressure (Özbilgin et al., 2009). Consequently, the composition of the species might have been sculptured by the uneven fishing pressure in the long run. An example of such a case is the disappearance
of tub gurnard in the catch as opposed to the rise of red mullet, M. barbatus. T. lucerna is a slow growing (Bingel, 1987), late maturing fish (Papaconstantinou, 1984); compared to the short lived M. barbatus which reaches maturity within the first year of its life (Gucu, 1991). Aging was not performed on discarded class sizes, however, extended occurrence of T. lucerna in the discard (Figure 2), as opposed to its relatively short and distinctive pattern of recruitment (Figure 11) indicates that not only young-of-the-year but probably also older sub adults were discarded by the commercial fleet. The longer occurrence of T. lucerna in the discard suggests higher fishing pressure over the early life stages of this fish. In contrast, M. barbatus, has a distinctive pattern of recruitment and an identical pattern of occurrence in the virtual discard. The discard regulations applied in the area bans trawl fishery from mid-April to mid-September (Anonymous, 2008; Figure 2). In this study, the data were collected throughout the year including the trawl close season. Recalling that the period of high M. barbatus discard occurs in the close season, the high M. barbatus discard figure given in Table 1 does not represent the actual quantity of M. barbatus discarded by the commercial fleet, which would evidently be lower in reality. In other words, undersized M. barbatus that would otherwise have been caught and been discarded by the fishery are protected by the fishing regulation. However, the same regulation protects only a part of the undersized T. lucerna (Figure 2). The unequal fishing pressure on the young has possibly provided better chances of recruitment for the former of the two competing species and this may be a factor responsible for the disappearance of T. lucerna in the 2000s. The endurance M. barbatus against a high level of exploitation has already been underlined by Demestre et al. (1997), however, they explained the success by the high turnover rate displayed by the species. Here, in addition to high turnover rate, the summer trawl closure, which applied in several Mediterranean countries, is a significant tool in the reduction in the discard of this species.
The quantity of retained catch, which has remained unchanged over the last 30 years despite a remarkable increase in the discard rate, indicates that discard might not be a critical issue from an economic point of view. The remarkable differences in the compositions of the species of the 1980s and the 2000s suggest that the retained catch has been stabilized, possibly through modifications in the fisheries ecosystem as was illustrated by the case of Table 5. Percentage distribution of retained catch by month and by depth strata in the 2000s
Jan Feb Mar Apr May Jun Jul Aug Sep Oct Nov Dec ∑
0-25 m 2.2 3.2 4.9 2.8 5.4 1.2 3 4.4 1.1 1 4.3 2.4 35.7
25-50 m 1.5 1.2 2 1.1 1.1 2.9 3.1 3.1 5.8 3.7 1.4 1.2 28.1
50-100 m 0.9 0.8 0.8 0.6 3.7 1.1 1.7 4 4.7 2.2 1.3 1.9 23.6
100-250 m 0.8 0.6 1 0.6 1 1.4 0.8 0 2.3 0 2.3 1.9 12.6
A.C. Gücü / Turk. J. Fish. Aquat. Sci. 12: 817-830 (2012) 829
red mullet and tube gurnard. On the other hand, the disappearance of some sensitive sessile groups, which were represented in great quantities in the discard composition in the 1980‟s, such as echinoderms, could be an indicator of high fisheries pressure and may be a sign of the damage to the benthic and epi-benthic biocoenosis which is considered to be an essential habitat for demersal target species, such as hake, Merluccius merluccius (Colloca et al., 2004).
Conclusion
Depth was verified as a significant factor affecting the size of the discard; very high discard at depths shallower than 30 metres. However, the discard does not follow a linear decrease towards deeper strata. The discarded quantity increases again towards the continental slope. The time of a year is found to be another important factor which may help in reducing the discard via appropriate regulations. It was demonstrated that, in the fishing grounds where the impact of these two factors are considered, the discard may be reduced remarkably. However, it was also demonstrated that enforcing seasonal closures to reduce the discard may cause significant changes in the fish assemblages in the long run; that the fast growing species having short recruitment periods achieve full advantage of the protection and gain advantage over the slow growing fish with extended recruitment patterns. It may be worthwhile to note that seasonal closures might have helped to maintain their resilience against lessepsian immigrants; whereas protecting the infralittoral zone, particularly
in the areas where critically important sea-grass habitats, such as Posidonia oceanica meadows are absent, may favour the colonization of immigrants.
Acknowledgements
This study was realized by the research funds of the Middle East Technical University, State Planning Office and Turkish Scientific and Technical Research Counncil. The work could never be resealized without the motivating support of Prof. Ferit Bingel. I am also indepted to Meltem Ok, Serdar Sakınan, Mertkan Tüer, Hasan Pınar for their help in the field and to the current and former crews of RV Lamas, particularly to Ahmet Tutsak and Kazım Tutsak whose help in determination of discard was crucial for the study.
References
Alverson, D.L., Freeberg, M.H., Murawaski S.A. and Pope, J.G. 1994. A global assessment of fisheries bycatch and discards. FAO Fish Tech Pap 339. Rome, 235 pp. Anonymous 2007. Fishery Statistics. State Institute of
Statistics Publications, Ankara, Turkey
Anonymous 2008. Notification Regulating Commercial Fishing in Turkey. Turkish ministry of agriculture and ruralaffairs. http://www.kkgm.gov.tr/regulation/not/ 2007-43.html
Aydin, C., Tokaç, A., Ulaş, A., Maktay, B. and Şensurat, T. 2011. Selectivity of 40 mm square and 50 mm diamond mesh codends for five species in the Eastern Mediterranean demersal trawl fishery. Afr. J. Biotechnol., 10(25): 5037-5047
830
Mediterranean multispecies trawl fishery. ICES J Mar Sci 64, 757-760. doi: 10.1093/icesjms/fsm052 Bingel, F., 1987. Doğu Akdeniz‟de kıyı balıkçılığı av
alanlarında sayısal balıkçılık projesi kesin raporu Report No: 80070011 METU-IMS, Erdemli, 312 pp. Colloca, F., Carpentieri, P., Balestri, E. and Ardizzone,
G.D. 2004. A critical habitat for Mediterranean fish resources: shelf-break areas with Leptometra phalangium (Echinodermata: Crinoidea). Mar Biol 145(6), 1129-1142. doi: 10.1007/s00227-004-1405-8 D‟Onghia, G., Carlucci, R., Maiorano, P. and Panza, M.
2003. Discards from deep-water bottom trawling in the eastern-central Mediterranean Sea and effects of mesh size changes. J. Northw. Atl. Fish Sci, 31: 245-262.
Demestre, M., Sbrana, M., Alvarez, F. and Sánchez, P. 1997. Analysis of the interaction of fishing gear in Mullus barbatus fisheries of the Western Mediterranean. J Appl Ichthyol, 13: 49-56. doi: 10.1111/j.1439-0426.1997.tb00100.x
Düzbastılar, F.O., Özbilgin, H., Aydın, C., Metin, G., Ulaş, A., Lök, A. and Metin, C. 2010. Mortalities of fish escaping from square and diamond mesh codends in the Aegean Sea. Fish Res. 106, 386-392. doi: 10.1016/j.fishres.2010.09.008
Eayrs, S. A. 2007. Guide to Bycatch Reduction in Tropical Shrimp-Trawl Fisheries.Revised edition., FAO. 2007, Rome, 108 pp
Garcia, S. M., Kolding, J., Rice, , J. Rochet, M.-J. Zhou S., Arimoto T., Beyer J.E., Borges, L., Bundy, A., Dunn, D., Fulton, E. A., Hall, M., Heino, M., Law, R., Makino, M., Rijnsdorp, A. D., Simard, F. and Smith, A.D.M. 2012 Reconsidering the Consequences of Selective Fisheries Science, 335(6072): 1045-1047. doi: 10.1126/science.1214594
Golani, D. 1994. Niche separation between colonizing and indigenous goatfish (Mullidae) along the Mediterranean coast of Israel. J.Fish Biol., 45(3): 503–513. doi: 10.1111/j.1095-8649.1994.tb01332.x Gucu, A.C. 1991. A fisheries model for the Mersin bay
fisheries ecosystem. Ph.D. thesis. Ankara: Middle East Tech. Univ. Turkey. 197 pp.
Gucu, A.C., Ok, M. and Sakınan S. 2010. Past and present of fish fauna in the NE Levant Sea and factor facilitating the colonization by Lessepsian fishes. FAO-EastMed Working Document GCP/INT/041/EC – GRE – ITA/TD-04: 88-110
Kelleher, K. 2005. Discards in the world‟s marine fisheries. An update. FAO Fisheries Technical Paper. No. 470.Rome, 131pp.
Machias, A., Vassilopoulou, V., Vatsos, D., Bekas, P., Kallianiotis, A., Papaconstantinou, C. and Tsimenides, N. 2001. Bottom trawl discards in the northeastern Mediterranean Sea. Fish Res., 53(2): 181-195 doi: 10.1016/S0165-7836(00)00298-8 Machias, A., Maiorano, P., Vassilopoulou, V.,
Papaconstantinou, C., Tursi, A. and Tsimenides, N. 2004. Sizes of discarded commercial species in the eastern-central Mediterranean Sea. Fish. Res., 66(2-3): 213-222
Moranta, J., Massuti, E. and Morales-Nin, B. 2000. Fish catch composition of the deep-sea decapod crustacean fisheries in the Balearic Islands (western
Mediterranean). Fish. Res., 45: 253-264. doi: 10.1016/S0165-7836(99)00119-8
Murawski, S.A. 1996. Factors influencing by-catch and discard rates: analyses from multispecies/multifishery sea sampling. NAFO SCR 93/115, 17 pp.
Ordines, F., Massutí, E., Guijarro, B. and Mas, R., 2006. Diamond vs. square mesh codend in a multi-species trawl fishery of the western Mediterranean: effects on catch composition, yield, size selectivity and discards. Aquat Living Resour. 19: 329-338
Özbilgin Y., Gökçe G., Özbilgin H., Çelik O., Ünal V., Tokaç A. 2009. Kuzeydoğu Akdeniz Balıkçılığının Yapısal Analizi, Mersin University (BAP-SÜF AİT (YÖ) 2007-1) Final Report, Mersin, 146 pp.
Özbilgin, H., Tokac, A. and Kaykac, H. 2012. Selectivity of commercial compared to larger mesh and square mesh trawl codends for four fish species in the Aegean Sea. J. Appl. Ichthyol., 28: 51–59. doi: 10.1111/j.1439-0426.2011.01916.x
Papaconstantinou, C. 1984. Age and growth of the yellow gurnard (Trigla lucerna L. 1758) from the Thermaikos Gulf (Greece) with some comments on its biology. Fish Res., 2(4): 243-255. doi: 10.1016/0165-7836(84)90028-6
Sacchi, J. 2008. The use of trawling nets in the Mediterranean. Problems and selectivity options. Options Méditerranéennes, 62(B): 87-96
Sánchez, P., Demestre, M. and Martín, P., 2004. Characterization of the discards generated by bottom trawling in the northwestern Mediterranean. Fish Res., 67(1): 71-80. doi: 10.1016/j.fishres.2003.08.004 Sánchez, P., Sartor, P., Recasens, L., Ligas, A., Martin, J.,
de Ranieri, S. and Demestre, M. 2007. Trawl catch composition during different fishing intensity periods in two Mediterranean demersal fishing grounds. Sci Mar., 71(4): 765-773.
doi:10.3989/scimar.2007.71n4765
Sardà, F., Bahamón, N., Moli, B. and Palomera, F.S. 2006. The use of a square mesh codend and sorting grids to reduce catches of young fish and improve sustainability in a multispecies bottom trawl fishery in the Mediterranean. Sci Mar. 70(3), 347-353.
Sartor, P., Sbrana, M., Reale, M. and Belcari, P. 2003. Impact of the deep sea trawl fishery on demersal communities of the northern Tyrrhenian Sea- (Western Mediterranean). J. Northw Atl. Fish. Sci., 31: 1-10
Schimek, M.G. 2000. GAM spline algorithms: A direct comparison. In: Bethlehem J., van der Heijden P. (eds) COMPSTAT 2000. Proceedings in Computational Statistics, Physica, Heidelberg: 433– 438.
Tudela, S. 2004. Ecosystem effects of fishing in the Mediterranean: an analysis of the major threats of fishing gear and practices to biodiversity and marine habitats. Studies and Reviews. General Fisheries Commission for the Mediterranean. 74. FAO Rome 44 pp.