Turkish Journal of Fisheries and Aquatic Sciences 12: 105-113 (2012)
www.trjfas.org ISSN 1303-2712 DOI: 10.4194/1303-2712-v12_1_13
© Published by Central Fisheries Research Institute (CFRI) Trabzon, Turkey in cooperation with Japan International Cooperation Agency (JICA), Japan
Digestibility and Liver Fatty Acid Composition of Rainbow Trout
(Oncorhynchus mykiss) Fed by Graded Levels of Canola Oil
Introduction
One of the factors which mostly affects the success of aquaculture in the future is having an advanced feed industry. Food expenses are the major element that restricts the feed production. Beside of the considering cost of food and fish nutrition requirement in the feed production, process
techniques of feed raw materials and digestion rate of the fish also play very important role.
Determination of the nutrient digestibility is the first step in evaluation the potential of ingredients for use in the feeding of fish species (Allan et al., 2000; Tibbetts et al., 2006). More nutrients are used for formation of tissues in the body with the diets that is digested easily and less metabolism waste is dischared Seval Dernekbaşı1,*
1 University of Sinop, Faculty of Aquaculture and Fisheries, Department of Aquaculture, 57000 Sinop, Turkey.
* Corresponding Author: Tel.: +90. 368 2876265; Fax: +90. 368 2876255; E-mail: sevalyaman@hotmail.com
Received 28 July 2011 Accepted 3 December 2011
Abstract
This study was aimed to determined the effects of different concentrations of canola oil (CO) on the digestibility, vicerosomatic index (VSI), hepatosomatic index (HSI) and the contents of fatty acids in the liver of rainbow trout
(Oncorhynchus mykiss). Rainbow trouts were fed with the experimental diets for 70 days. The diets were given as triplicate
groups of rainbow trout (initial weight of 119 g) to apparent satiation twice in a day. There were not significant differences in digestibility of protein and lipid between the experimental diets. VSI and HSI were not significantly different among the all treatment and between the initals and the end of trials (P>0.05). Liver fatty acid contents of all groups were different from each other. Liver fatty acid analyses showed that EPA and DHA from n-3 HUFA’s in the fish fed by the fish oil diet (K) and the initial liver samples, oleic acid (C18:1n-9, OA) and linoleic acid (C18:2n-6, LA) in the fish fed by the canola oil (C50, C75,
C100) were higher than in the fish fed by the control diet. Arachidonic acid (C20:4n-6; ARA) were 2.54, 3.15, 4.15, 4.63 and
5.64% in C75, K, C100, C50 groups and initial, respectively. n3/n6 rate was quite high in all groups.
Keywords: Rainbow trout, Oncorhynchus mykiss, liver, fatty acids, canola oil, digestibility
Farklı Oranlarda Kanola Yağıyla Beslenen Gökkuşağı Alabalığı’nın (Oncorhynchus mykiss) Karaciğer Yağ Asit Kompozisyonu ve Sindirilebilirliği
Özet
Bu çalışmada, yemlere farklı oranlarda ilave edilen kanola yağının gökkuşağı alabalıklarında karaciğer yağ asitleri kompozisyonu, hepatosomatik indeks, viserosomatik indeks ve sindirilebilirliğe etkisinin belirlenmesi amaçlanmıştır. Gökkuşağı alabalıkları 70 gün süre ile deneme rasyonları ile beslenmişlerdir. Rasyonlar balıklara görülebilir doygunluk sınırına erişinceye kadar günde iki kez verilmiştir. Deneme rasyonları arasında yağ ve protein sindiriminde önemli farklılıklar yoktur. VSI ve HSI’de deneme başlangıcı ve sonunda tüm gruplar arasında farklılığa rastlanmamıştır (P>0.05). Bütün grupların karaciğer yağ asitleri içerikleri birbirinden farklı tespit edilmiştir. Karaciğer yağ asidi analizi, deneme başlangıcı karaciğer örneklerinde ve balık yağı ilaveli rasyonla beslenen balıklarda n-3 HUFA’lardan EPA ve DHA, kanola yağı ilaveli rasyonlarla beslenen balıklarda ise oleik (C18:1n-9, OA) ve linoleik (C18:2n-6, LA) asitlerin daha yüksek olduğunu göstermiştir. Araşidonik asit (C20:4n-6; ARA) C75, K, C100, C50 grupları ve başlangıç örneklerinde sırasıyla %2.54, 3.15, 4.15,
4.63 and 5.64 olarak belirlenmiştir. n3/n6 oranları ise tüm gruplarda oldukça yüksek tespit edilmiştir.
106
out of the body. Therefore, the digestive ability of fish species that are important for aquaculture for various feed materials in different enviromental conditions should be determined (Yiğit and Ustaoğlu, 2003).
Lipids are important components of fish diets due to their role in providing energy sources, the essential role of some fatty acids, carriers of fat soluble vitamins and resource of polar lipids and sterols, which are important structural compounds of cell membranes. Fish and fish oils contain omega-3 fatty acids (n-3 polyunsaturated fatty acids) known as eicosapentaenoic acid (EPA, 20:5n-3) and docosahexaenoic acid (DHA, 22:6n-3), whereas plant foods and vegetable oils are devoid of these two important PUFA. However, it is well established that fish require EPA, DHA and arachidonic acid (ARA, 20:4n-6) for normal growth, development, and reproduction (Rodriguez et al., 2004).
The importance of fish as a source of n-3 polyunsaturated fatty acids in human nutrition is widely realized. Among these acids, mainly EPA, DHA as well as its precursor, alpha linolenic acid (LNA, 18:3n-3) stand out. These acids are associated to numberless benefits to human health. DHA plays an important role in the formation, development and working of the brain and retina. EPA has anti-inflammatory properties, and in general contributes to the prevention of heart diseases and to the reduction of biochemical factors associated to cancer (Aguiar et al., 2007).
Lipids that supplies energy are stocked in different tissues in fish, especially in muscle tissue, between the internal organs and liver (Steffens, 1997). Liver is one of the most important organs in fish, which shows the effects of the nutrient material in the diet on growth and development of fish. High amounts of lipids are stored in the liver of fish in case of usage of high amounts of lipids not including the essential fatty acids in the diets. It was reported that this caused liver degeneration (Caballero et al., 1999). Researchers have recently stated their studies that some parts of fish not consumed as food are suitable for human nutrition may be used in oil extraction. The existence of significant concentrations of polyunsaturated fatty acids in the viscera and liver has been reported (Aguiar et al., 2007). Kozlova (1998) reported that the liver and muscle in fish serve as fat depots, whereby the liver is the main lipid storage organ in the body of many fish species. Rodriguez et al. (2004) indicated that the liver plays a critical role in various aspects of lipid metabolism (uptake, oxidation and conversion of fatty acids). However, liver plays a major role in metabolism and has a number of functions in the body, including glycogen storage, decomposition of red blood cells, plasma protein synthesis, hormone production, and detoxification (Anonymus, 2011b).
Therefore, the aim of the present study was to determine the effects of increasing dietary fish oil replacement levels with canola oil on apparent
digestibility coefficients of the diets, VSI, HSI and liver fatty acid composition in rainbow trout (Oncorhynchus mykiss).
Materials and Methods
Fish and Maintenance
The experimental rainbow trout were obtained from a commercial trout farm, Kuzey Su Ürünleri Inc., in Bafra-Samsun and acclimated in Sinop University, Fisheries Faculty in Sinop (Turkey) for ten days before the start of the experiment. During acclimation, the fish were fed with a commercial diet twice a day to satiation. Fish were stocked in centrally drained three 1000-l(birim?) rectangle fiberglass tanks in a flow-through water system in an indoor facility during acclimation. After acclimatization, fish (mean weight of 119±0.17 g) were fasted for a day; batch weighted and randomly distributed among to twelve fiberglasses circular tanks (approximately, water volume 300-L; 60 cm in high; 80 cm in diameter) at a density of 30 fish per tank. The fish that used in the experiment were same size and weight. Water inflow was adjusted to 4 l/min and supplemental aeration was provided via airstone diffusers. The fish were individually weighted at the end and beginning of the experiment with a 1 g sensitive electronic balance. The water quality parameters were monitored on weekly basis and the following parameters were recorded: average temperature of 13.2±0.4°C, dissolved oxygen of 5.46±0.13 mg/l and pH 7.39. At the starting of the experiment, 20 fish were homogenized and analyzed for liver composition and five fish from each tank were analyzed for liver composition at the end of the experiment
Experimental Diets
Four diets were prepared from ingredients obtained from a local fish feed manufacturer ((Sibal A.Ş. Black Sea Feed, Sinop/Turkey); Table 1). Canola oil was obtained from a commercial feed firm (Çevresel Kimya San.Tic.A.Ş., Edincik, Bandırma/Turkey). In the experiment, canola oil which was the main ingredients in experiment feeds was prepared by chancing with different ratios of fish oil. Diet I, the control diet (K), contained 100% fish oil. Diet II (C50), Diet III (C75) and Diet IV (C)
107
Feeding and Fecal Collection
The experiment was conducted in triplicates in randomly assigned tanks.During experimental period, fish in all groups were hand fed feed twice a day (at 09:00 am and 16:00 pm) to apparent satiety under a natural light regime for 70 days. All possible care was taken during feeding so that no uneaten feed settled on the tank bottoms. Feed for each tank was weighed daily to a constant amount (100 g) and feed consumption in each tank was determined by subtracting unconsumed feed from the ration. Tanks were thoroughly cleaned after each feeding. Starting on day 7 of the experiment, fecal matter was collected daily between at 11:00 am and 12:00 am and between at 16:00 pm and 17:00 pm by slow siphoning with an 8-mm plastic tube. There were no fecal collections made on weekends. Fecal samples were immediately frozen and stored at -20°C for pending analysis.
Chemical Analyses
Chemical composition of dried samples of diets and feces was analyzed by standard methods (AOAC, 1995). Crude protein was analyzed according to the Kjeldahl method (N x 6.25), crude lipid was determined by Soxhlet methods using petroleum ether as a solvent, dry matter by drying at 105°C for 24 h and ash by incineration at 550°C in a muffle furnace for 12 h. Carbohydrate was calculated by difference (100-[moisture+ash+proprotein+lipid]) (Tibbetts et all., 2004). Chromic oxide in the diet and feces was determined with a spectrophotometer according to Bolin et al. (1952). Apparent digestibility coefficients (ADC) of nutrients and energy were calculated as: ADC (%)= 100 - [100(% Cr2O3 in diet/% Cr2O3 in
feces) x (% nutrient in feces/% nutrient in diet)] as per Degani et al. (1997) and Degani (2006); ADC of dry matter (%) = 100 - [100(% Cr2O3 in diet/% Cr2O3 in feces) as per De Silva and Anderson (1995). All chemical analyses were carried out in triplicate and values represented as mean value of triplicate samples.
Preparation of Fatty Acid Methylesters and Fatty Acid Analysis
Total lipid was determined by modified Bligh and Dyer Method (Hanson and Olley, 1963). Fatty acid methyl esters of diet and liver lipids were prepared by sponifying 30-40 mg of lipid with 2 ml of 0.5M methanolic KOH by heating at 100ºC for 7 min. Further 1.5 ml of methanolic BF3 were added and
heated for 5 min. The FAMEs were extracted with 2 ml of iso-octane and extracts were decanted into the amber vial. Separation and determination of FAME’s were done as described in Öksüz and Özyılmaz (2010).
Statistical Analyses
Apparent digestibility coefficients were calculated from the average of three replicate tanks receiving each experimental diet. Statistical analyses were performed using analysis of variance (ANOVA) and in the case of a significant difference, treatment means were differentiated using Tukey’s multiple range test. All data reported as a percentage was arcsine transformed prior to ANOVA. Significiancy was determined at a 5% level (P<0.05).
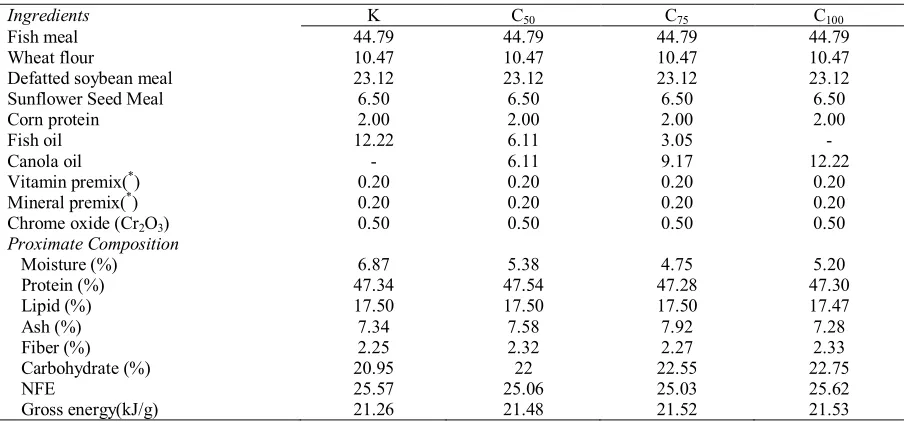
Table 1. Ingredient and proximate compositions of the control and experimental diets
Ingredients K C50 C75 C100
Fish meal 44.79 44.79 44.79 44.79
Wheat flour 10.47 10.47 10.47 10.47
Defatted soybean meal 23.12 23.12 23.12 23.12
Sunflower Seed Meal 6.50 6.50 6.50 6.50
Corn protein 2.00 2.00 2.00 2.00
Fish oil 12.22 6.11 3.05 -
Canola oil - 6.11 9.17 12.22
Vitamin premix(*) 0.20 0.20 0.20 0.20
Mineral premix(*) 0.20 0.20 0.20 0.20
Chrome oxide (Cr2O3) 0.50 0.50 0.50 0.50
Proximate Composition
Moisture (%) 6.87 5.38 4.75 5.20
Protein (%) 47.34 47.54 47.28 47.30
Lipid (%) 17.50 17.50 17.50 17.47
Ash (%) 7.34 7.58 7.92 7.28
Fiber (%) 2.25 2.32 2.27 2.33
Carbohydrate (%) 20.95 22 22.55 22.75
NFE 25.57 25.06 25.03 25.62
Gross energy(kJ/g) 21.26 21.48 21.52 21.53
(*) Vitamin-mineral premix (mg/kg premix): vitamin A, 210000 IU; Vitamin D3, 35000 IU; vitamin E, 7000 mg; vitamim K3, 322 mg; vitamin B1, 588 mg; vitamin B2, 252 mg; vitamin B6, 294 mg; vitamin B12, 826 mcg; niacin, 1400 mg; biotin, 7583 mcg; 182 mg folic acid, pantothenic acid, 1722 mg; inositol, 17220 mg; vitamin C, 933.31 mg; Ca, 1414mg.
108
Results
Diet Composition
The test diet proximate composition was uniform across the canola oil treatments. Protein, lipid and energyranged from 47.28 to 47.54%, 17.47 to 17.5% and 21.26 to 21.53 kJ g-1; respectively and diets were subsequently considered iso-nitrogenous, iso-lipidic and iso-energetic (Table 1). Dietary oils were added at 12.22% of diet, the additional lipid found in the diets originated from the added fish meal and defated soybean meal. The fish oil control treatment (K) was characterized by high levels of saturated fatty acids (SFA), particularly myristic acid, stearic acid and palmitic acid, accounting for 6.31, 20.14 and 4.62% lipid, respectively (Table 2). The K diet had the highest concentrations of palmitoleic acid (16:1n-7, POA), eicosapentaenoic acid (20:5n-3, EPA) and docosahexaenoic acid (22:6n-3, DHA) with values of 6.68, 9.26 and 16.61% lipid, respectively. The fatty acid composition of the C100 diet was
characterized by high levels of oleic acid (18:1n-9, OA) (45.63% lipid), linoleic acid (18:2n-6, LA) (19.39% lipid) and linolenic acid (18:3n-3, LNA) (59.1% lipid). Levels of the respective fatty acids for canola oil reduced as the level of substitution approached 100% fish oil inclusion. Similarly, the n-3/n-6 ratio decreased progressively relative to the level of substitution, ranging from 3.44-0.72% for the canola oil diets.
Levels of Hepatosomatic Index and Vicerosomatic Index
Rainbow trout fed the experimental diets increased their mean weight from 119.13 g to 233.08 g after 70 days. According to initial, dietary lipid source not affected statistically hepatosomatic indices (HIS) and vicerosomatic indices (VSI). No significant differences were found for HIS and VSI between the graded canola oil treatments (Table 3).
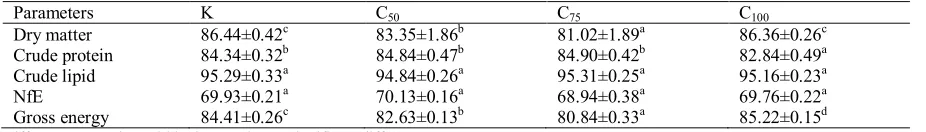
Apparent Digestibility of Dry Matter and Nutrients
Apperent dry matter digestibility (ADCdry matter)
and nutrient digestibility values (ADCprotein, ADClipid
and ADCenergy) were given in Table 4. ADCprotein values were similar to in rainbow trout fed by K, C50 and C75 diets, but lower for C100 diet. Statistically no significant differences (P<0.05) were apparent between the graded canola oil treatments for lipid digestibility.
Liver Fatty Acid Composition
The liver fatty acid composition of rainbow trout reared on the graded canola oil diets showed on Table 5. Total saturated fatty acid was the highest in liver of fish in K group and the lowest in fish in C100
group. Dominant fatty acids among the saturated fatty acid were palmitic and stearic acids. Although the MUFA content was the highest in fish in the C75
group, in general, levels of MUFA were differed among the all groups and oleic acid was the dominant fatty acid in C75 group. Total n-6 fatty acids of liver
were increased with increasing level of canola oil, compared with beginning of the trial. Total n-3 fatty acids of liver were the highest in initial and K groups and the lowest in C75 group. The n3/n6 ratio was the
highest in liver of fish in K, the lowest in C100 and
intermediate in the other groups. Dominant fatty acids among PUFA’s were DHA, arachidonic acid, linoleic acid and EPA, respectively. Liver fatty acid compositions were satisfactory for all groups.
Discussion
In the past, high-quality marine fish oils have been used almost exclusively as dietary lipid sources in the formulation of commercial fish feeds. However, vegetable oils used as an alternative to fish oil consisted lately an important part of the research on fish nutrition. This study was aimed to determined the
Table 2. Apparent digestibility coefficients (%) of the diets
Parameters K C50 C75 C100
Dry matter 86.44±0.42c 83.35±1.86b 81.02±1.89a 86.36±0.26c
Crude protein 84.34±0.32b 84.84±0.47b 84.90±0.42b 82.84±0.49a
Crude lipid 95.29±0.33a 94.84±0.26a 95.31±0.25a 95.16±0.23a
NfE 69.93±0.21a 70.13±0.16a 68.94±0.38a 69.76±0.22a
Gross energy 84.41±0.26c 82.63±0.13b 80.84±0.33a 85.22±0.15d
Different superscripts within the row denote significant differences.
Table 3. Levels of hepatosomatic index (HSI) and vicerosomatic index (VSI)
Initial K C50 C75 C100
HSI (%) 1.04±0.04 a 0.84±0.02 a 0.91±0.13 a 0.80±0.01 a 0.88±0.08 a
VSI (%) 11.99±0.49 a 10.03±0.69 a 10.38±0.22 a 10.17±0.68a 10.48±0.34a
109
effects of different concentrations of canola oil (CO) on the digestibility, vicerosomatic index (VSI), hepatosomatic index (HSI) and the contents of fatty acids in the liver of rainbow trout (Oncorhynchus
mykiss).
Essentially, dry matter, protein and energy digestibility values were usually high and significantly affected by the dietary lipid source.
Table 4. Fatty acid composition of the experimental diets (% of total fatty acids)
Fatty Acids
Diet Groups
K C50 C75 C100
C14:0 6.31a 3.83b 2.86c 1.45d
C16:0 20.14a 14.79b 13.29c 11.03d
C17:0 0.82 0.55 0.34 nd
C18:0 4.62a 3.78b 3.57b 3.05c
C20:0 1.35a 1.05b 0.95b 0.71c
C16:1n-7 6.68a 4.16b 3.18c 1.71d
C18:1 n-9 17.93a 30.44b 35.89c 45.63d
C20:1 0.56a 1.19b 1.37b 1.46b
C18:2 n-6 7.31a 12.67b 15.22c 19.39d
C18:3 n-3 1.29a 3.73b 4.76c 5.91d
C20:2 nd 0.14 0.18 nd
C20:3 n-6 nd 0.20 nd nd
C20:4 n-6 0.83 0.36 0.50 0.26
C20:5n-3 9.26a 5.49b 4.18c 2.32d
C22:4 0.19 0.37 0.24 nd
C22:5 n-3 0.81 0.57 0.38 nd
C22:6 n-3 16.61a 10.97b 8.85c 5.91d
ƩSFA 33.24a 26.00b 21.01c 16.24d
ƩMUFA 24.98a 35.79b 40.44c 48.80d
ƩPUFA 36.30a 34.50ab 34.31ab 33.79b
Total n-3 PUFA 27.97a 20.76b 18.17c 14.14d
Total n-6 PUFA 8.14a 13.23b 15.72c 19.65d
n-3/n-6 3.44a 1.57b 1.16c 0.72d
Different superscripts within the row denote significant differences. nd (not detected)
Table 5. Levels of saturated (SFA), mono-unsaturated (MUFA), and poly-unsaturated (PUFA) fatty acids (% of total fatty
acids) in liver of rainbow trout fed the experimental diets
Fatty Acids
Diet Groups
Initial K C50 C75 C100
C14:0 0.93 1.02 0.83 0.85 0.53
C16:0 19.83 22.18 19.26 18.28 17.67
C17:0 0.38 0.44 nd 0.3 0.2
C18:0 5.8 7.04 7.02 6.77 6.41
C20:0 0.14 0.27 nd 0.22 0.27
C16:1 1.95 1.99 1.92 2.25 1.75
C18:1 n-9 12.66 14.35 22.91 29.43 26.29
C20:1 0.61 1.28 2.26 2.16 2.53
C18:2 n-6 3.92 2.33 4.17 5.97 5.59
C18:3 n-3 0.94 0.5 nd 0.68 0.58
C20:2 0.67 0.62 1.02 1.22 1.47
C20:3 n-6 0.7 0.56 nd 1.31 1.31
C20:4 n-6 5.64 3.15 4.63 2.54 4.15
C20:4 n-3 0.58 0.43 nd 0.27 0.5
C20:5n-3 3.63 3.93 2.81 1.79 1.8
C22:4n-4 2.1 1.64 1.18 0.52 0.73
C22:5 n-6 0.33 0.42 nd 0.42 0.52
C22:5 n-3 1.07 1.11 nd 0.6 0.43
C22:6 n-3 34.67 34.74 32 24.22 26.01
ƩSFA 27.08 30.95 27.11 26.42 25.08
ƩMUFA 15.22 17.62 27.09 33.84 30.57
ƩPUFA 54.25 49.43 45.81 39.54 43.09
Total n-3 PUFA 40.89 40.71 32 27.56 29.32
Total n-6 PUFA 10.59 6.46 8.80 10.24 11.57
n-3/n-6 3.86 6.30 3.64 2.69 2.53
110
Small differences were detected for ADCdry matter,
energy and protein digestibility among the all groups. However, Martins et al. (2006) reported that lipid digestibility was quite similar and high in diets containing canola oil and fish oil. Nevertheless, lipid digestibility values were high across all treatments, comparable to values reported by Martins et al. (2009) and Francis et al. (2006), but lower when compared to the values reported by Martins et al. (2006) and in general conformity with the statement that lipid well digested by fish (Olsen and Ringø, 1997) and ADC values are in general accordance with ADC for carnivorous species (NRC, 1993). Similarly, previous studies have reported a metabolic acceptance in various fish species for diets containing several vegetable oil types, including canola oil (Olsen and Ringø, 1997; Caballero et al., 2002). Nevertheless, lipid digestibility was higher in diets containing vegetable oil than with animal lipid in Atlantic salmon fed diets based on flaxseed oil (Menoyo et al., 2007) and in Atlantic halibut fed diets based on vegetable oils (Martins et al., 2009).
As fish stores energy in muscle tissues, they collect the extra energy in liver as glycogen. Therefore, the proportional size of the liver is accepted as an index of growth speed with nutritional status of fish. HSI is an index that is used to investigate the effects of feeding on the liver which is a key organ for metabolism. If the hepatosomatic index is higher than the standard values (between 1-2% for osteichthyes), it shows that feeding or the feed causes some troubles in fish especially in the carbohydrate and fat metabolism, the existence of oxidized feed in the diet, extra carbohydrate and vitamin deficiency (Munshi and Dutta, 1996; Anonymus, 2011a). In this study, HSI ranged from 0.80 to 1.04; there were no differences among all the fish fed canola and fish oil (Panserat et al., 2009). Relative liver weights did not differ among dietary groups, indicating that this variable was not affected by the dietary lipid composition (Lin et al., 2007).
VSI are used to determine the rate of fat accumulated all body of the fish. At the end of the experiment, the value of VSI did not affected by the source of vegetable oil used in the study (P> 0.05). At the beginning of the experiment VSI was higher than at the end of the experiment. In this situation, canola oil used in feeds for rainbow trout trial can be used effectively without accumulation in the body. In present study, VSI determined between 10.03-11.99; similar conclusion reported for rainbow trout (Şener and Yıldız, 2003; Figueiredo-Silva et al., 2005; Caballero et al., 2002; Panserat et al., 2009) and extensively for many different fish species (Yıldız and Şener, 2003; Menoyo et al., 2005).
Liver fatty acid compositions of the rainbow trout were significantly influenced by the dietary lipid source. Despite each trial diets were iso-nitrogenous, iso-lipidic and iso-energetic, differences among liver fatty acid compositions were in all likelihood a result
of the differing fatty acid compositions of the trial diets (Tocher et al., 2003; Francis et al., 2007). Increased levels of 18:2n-6 and 18:1n-9 were observed in the liver of rainbow trout fed canola oil-based diets. Similarly, high levels of 18:2n-6 and 18:1n-9 were observed in farmed rainbow trout muscle due to they were fed with artificial diet (Oksuz, 2000). In contrast, low level of 18:2 n-6 fatty acid was reported in wild brown trout muscle with a considerable amount of 18:3 n3 fatty acid (Kayım et al., 2011). Replacement of fish oil with canola oil resulted in reduced levels of total n-3 PUFA and SFA, and an increased level of total n-6 PUFA and MUFA in liver tissues. High level of linoleic acid (n-6) in the liver may be considerd as an indicator of vegetable sourced lipid containing feed. Generally, there was a direct dietary influence in terms of PUFA levels found in fish tissues. In contrast, liver total saturated fatty acid levels were minimally affected by dietary treatments from 25.08% in the C100 diet to 30.95% in
the K diet. The minimal impact of diets on saturated fatty acids in fish liver tissues was also observed by other researchers (Greene and Selivonchick, 1990; Shapawi et al., 2008). Similar to the results of the present study, replacement of fish oil with vegetable oils had been reported to result in significant changes in liver fatty acid composition in many other marine fish species such as the European sea bass (Mourente et al., 2005), red sea bream (Glencross et al., 2003) and Atlantic salmon, Salmo salar L. (Ng et al., 2007). In general, replacement of dietary fish oil with vegetable oil had resulted in a lower level of n-3 PUFA (especially EPA and DHA) in fish tissues.
111
the C75 and C100 treatments in comparison with the
concentrations detected in the diet. These results tend to indicate that these fatty acids (OA, LA and LNA), when present in suitable quantities in the diet are selectively utilized in the liver for β-oxidation, as suggested by Bell et al. (2003) and Torstensen et al. (2004). It is shown that the inclusion of vegetable oils in fish diets stimulates desaturation and elongation activity in the liver (Tocher et al., 2000; Bell et al., 2003; Zheng et al., 2005). In addition, despite the increasing addition of canola oil, n3/n6 rates in the liver were quite high (Caballero et al., 2002; Tocher et al., 2003; Fonseca-Madrigal et al., 2005; Francis et al., 2007).
In summarising the results obtained, lipid digestibility, HSI, VSI and liver fatty acid composition of the rainbow trout was not negatively affected by the graded levels canola oil diets used in the present study. Our results showed that the liver fatty acid composition was higher in DHA and EPA, respectively, and thus, the liver contents more n-3 PUFA. Consequently, accumulation of unsaturated fatty acid in the liver tissue of the fish fed by canola oil showed that liver could be an effective fatty acid source.
Acknowledgements
This paper was carried out in conjunction with Seval DERNEKBAŞI’s PhD thesis. We extend our gratefulness to Osman PARLAK, the Owner of the Kuzey Su Ürünleri fish farm, for providing us the fish.
References
Aguiar, A.C., Morais, D.R., Santos, L.P., Stevanato, F.B., Visentainer, J.E.L., Evelázio de Souza, N. and Visentainer, J.V. 2004. Effect of flaxseed oil in diet on fatty acid composition in the liver of Nile Tilapia
(Oreochromis niloticus). Archivos Latinoamericanos
de Nutricion, 57(3):273-277.
Allan, G.L., Parkinson, S., Booth M.A., Stone, D.A.J., Stuart, J.R., Frances, J. and Warner-Smith, R. 2000. Replacement of fish meal in diets for Australian silver perch, Bidyanus bidyanus: I. Digestibility of alternative ingredients. Aquaculture, 186: 293–310. doi: 10.1016/S0044-8486(99)00380-4
Anonymus, 2011a. Organ and tissue parameters,
Hepatosomatic index (HSI).
http://birgo.mynet.com/bakiaydn(21.02.2011).
Anonymus, 2011b. Liver.
http://en.wikipedia.org/wiki/Liver (24.03.2011) AOAC, 1995. Official Methods of Analysis. 16th ed.
O A
y = 0,4776x + 7,7361 R2 = 0,7205
10 15 20 25 30 35
15 25 35 45
Diet (g fatty acid/100 g t otal fatty acids)
Fi sh ( g f a tt y a c id /1 0 0 g t o ta l fa tt y a c id s) LA
y = 0,2958x + 0,4786
R2 = 0,8202
0 3 5
5 8 10 13 15 18 20
Diet (g fat ty acid/100 g tot al fat ty acids)
F is h ( g f a tt y a c id /1 0 0 g t o ta l fa tt y a c id s) EPA
y = 0,3326x + 0,8155 R2 = 0,9203
0 1 1 2 2 3 3 4 4 5
0 2 4 6 8 10
Diet (g fatty acid/100 g total fatty acids)
F is h ( g f at ty a ci d /1 0 0 g t o ta l fa tt y ac id s) DHA
y = 0,9461x + 19,228 R2 = 0,7467
10 15 20 25 30 35
0 5 10 15 20
Diet (g fatty acid/100 g t otal fatty acids)
Fi sh ( g f a tt y a c id /1 0 0 g t o ta l fa tt y a c id s)
Figure 1. Relationships between concentrations of (a) oleic acid (18:1n-9; OA), (b) linoleic acid (18:2n-6; LA), (c)
112
Association of Official Analytical Chemists, Arlington, VA.
Bell, J.G., McGhee, F., Campbell, P.J. and Sargent, J.R. 2003.Rapeseed oil as an alternative to marine fish oil in diets of post-smolt Atlantic salmon (Salmo salar): changes in flesh fatty acid composition and effectiveness of subsequent fish oil “wash out”. Aquaculture, 218:515-528.
Bolin, D.W., King, R.P. and Klosterman, E.W. 1952. A simplified method for the determination of chromic oxide (Cr2O3) when used as an inert substance.
Science, 116:634-635.
Caballero, M.J., Lopez-Calero, G., Socorro, J., Roo, F.J., Izquierdo, M.S., Fernandez, A.J. 1999. Combined effect of lipid level and fish meal quality on liver histology of gilthead seabream (Sparus aurata). Aquaculture, 179:277-290.
doi: 10.1016/S0044-8486(99)00165-9
Caballero, M.J., Obach, G., Rosenlund, G., Montero, D., Gisvold, M. and Izquierdo, M.S. 2002. Impact of different dietary lipid sources on growth, lipid digestibility, tissue fatty acid composition and histology of rainbow trout, Oncorhynchus mykiss. Aquaculture, 214: 253-271.
doi: 10.1016/S0044-8486(01)00852-3
Degani, G. 2006. Digestible energy in dietary sorghum, wheat bran, and rye in the common carp (Cyprinus
carpio L.). The Israeli Journal of Aquaculture–
Bamidgeh, 58:71-77.
Degani, G., Viola, S. and Yehuda, Y. 1997. Apparent digestibility coefficient of protein sources for carp,
Cyprinus carpio L. Aquaculture Research, 28:23-28.
doi: 10.1046/j.1365-2109.1997.00825.x
De Silva, S.S. and Anderson,T.A. 1995. Fish Nutrition in Aquaculture. Chapman and Hall, London. 319 pp. Figueiredo-Silva, A.C., Rema, P., Bandarra, M.L., Nunes,
M.L. and Valente, L.M.P. 2005. Effects of dietary conjugated linoleic acid on growth, nutrient utilization, body composition, and hepatic lipogenesis in rainbow trout juveniles (Oncorhynchus mykiss). Aquaculture, 248:163-172.
Francis, D.S., Turchini, G.M., Jones, P.L. and De Silva, S.S. 2006. Growth performance, feed efficiency and fatty acid composition of juvenile Murray cod,
Maccullochella peelii peelii, fed graded levels of
canola and linseed oil. Aquaculture Nutrition, 13:335-350. doi: 10.1111/j.1365-2095.2007.00480.x
Francis, D.S., Turchini, G.M., Jones, P.L. and De Silva, S.S. 2007.Effects of dietary oil source on growth and filet fatty acid composition of Murray cod, Maccullochella
peelii peelii. Aquaculture, 253:547-556.
Franseca-Madrigal, J., Karalazos, V., Campbell, P.J., Bell, J.G. and Tocher, D.R. 2005. Influence of dietary palm oil on growth, tissue fatty acid compositions, and fatty acid metabolism in liver and intestine in rainbow trout (Oncorhynchus mykiss). Aquaculture Nutrition, 11:241-250.
Glencross, B., Hawkins, W. and Curnow, J. 2003. Evaluation of canola oils as alternative lipid resources in diets for juvenile red sea bream, Pagrus auratus. Aquaculture Nutrition, 9:305-315.
Greene, D.H.S. and Selivonchick, D.P. 1990. Effects of dietary vegetable, animal and marine lipids on muscle lipid and hematology of rainbow trout (Oncorhynchus
mykiss). Aquaculture, 89:165-182.
doi: 10.1016/0044-8486(90)90308-a
Hanson, S.W.F. and Olley, J.1963. Application of the Bligh
and Dyer method of lipid extraction to tissue homogenates. Biochemical Journal, 89:101-102. Izquierdo, M.S., Obach, G., Arantzamendi, L., Montero, D.,
Robaina, L. and Rosenlund, G. 2003. Dietary lipid sources for seabream and seabass: growth performance, tissue composition and flesh quality. Aquaculture Nutrition, 9:397-407.
doi: 10.1046/j.1365-2095.2003.00270.x
Kayım, M., Öksüz, A., Özyılmaz, A., Kocabaş, M., Can , E., Kızak, V. and Ateş, M. 2011. Proximate Composition, Fatty Acid Profile, and Mineral Content of Wild Brown Trout Salmo trutta sp.) From Munzur River in Tunceli, Turkey. Asian Journal of Chemistry, 23:7: 3533-3537.
Kozlova, T.A. 1998. Lipid class composition of benthic-pelagic fishes (Cottocomephorus, Cottoidei) from Lake Baikal. Fish Physiology and Biochemistry, 19:211-216.
Lin, H-Z., Liu, Y-J., He, J-G., Zheng, W-H. and Tian, L-X. 2007. Alternative vegetable lipid sources in diets for grouper, Epinephelus coioides (Hemilton): effects on growth, and muscle and liver fatty acid composition. Aquaculture Research, 38:1605-1611.
doi: 10.1111/j.1365-2109.2007.01811.x
Martins, D.A., Gomes, E., Rema, P., Dias, J., Ozόrio, R.O.A. and Valente, L.M.P. 2006. Growth, digestibility and nutrient utilization of rainbow trout
(Oncorhynchus mykiss) and European sea bass
(Dicentrarchus labrax) juveniles fed different dietary
soybean oil levels. Aquaculture International, 14(3):285-295. doi: 10.1007/s10499-005-9034-x Martins, D.A., Valente, L.M.P. and Lall, S.P. 2009.
Apparent digestibility of lipid and fatty acids in fish oil, poultry fat and vegetable oil diets by Atlantic halibut, Hippoglossus hippoglossus L. Aquaculture, 294:132-137. doi: 10.1016/j.aquaculture.2009.05.016 Menoyo, D., Lopez-Bote, C.J., Obach, A. and Bautista, J.M.
2005. Effect of dietary fish oil substitution with linseed oil on the performance, tissue fatty acid profile, metabolism, and oxidative stability of Atlantic salmon. Journal of Animal Science, 83:2853-2862. Menoyo, D., Lopez-Bote, C.J., Diez, A., Obach, A. and
Bautista, J.M. 2007. Impact of n-3 fatty acid chain length and n3/n6 ratio in Atlantic salmon (Salmo
salar) diets. Aquaculture, 267:248-259.
Mourente, G., Good, J.E. and Bell, J.G. 2005. Partial substitution of fish oil with rapeseed, linseed and olive oils in diets for European sea bass (Dicentrarchus
labrax): effects on flesh fatty acid composition,
plasma postaglandins E2 and E2α, immune function
and effectiveness of a fish oil finishing diet. Aquaculture Nutrition, 11:25-40.
Munshi J.S. and Dutta H.M. 1996. Fish Morphology: Horizon of New Research, CRC press http://152.106.6.200:8080/dspace/bitstream/10210/12 23/8/CopyofChapter4.pdf (Accessed 08.03.2011). Ng, W.K.,Tocher, D.R. and Bell, J.G. 2007. The use of
palm oil in aquaculture feeds for salmonid species. Review. European Journal of Lipid Science and Technology, 109:394-399.
doi: 10.1002/ejlt.200600209
NRC. 1993. Pages 43-49 in Nutrient Requirement of Fish. National Academy Pres, Washington, DC.
Oksuz, A. 2000. Quality indices of rainbow trout
(Oncorhynchus myksiss) and Atlantic mackerel
(Scomber scombrus): A comparative study, Ph.D.
113
UK.
Olsen, R.E. and Ringø, E. 1997. Lipid digestibility in fish: a review. Recent Res. Dev. Lipid Res.,1:199-265. Öksüz, A. and Özyılmaz, A. 2010. Changes in fatty acid
compositions of Black Sea anchovy (Engraulis
encrasicolus L. 1758) during catching season. Turkish
Journal of Fisheries and Aquatic Sciences, 10:381-385.
Panserat, S., Hortopan, G.A., Plagnes-Juan, E., Kolditz, C., Lansard, M., Skiba-Cassy, S., Esquerré, D., Geurden, I., Médale, F., Kaushik, S. and Corraze, G. 2009. Differential gene expression after total replacement of dietary fish meal and fish oilby plant products in rainbow trout (Oncorhynchus mykiss) liver. Aquaculture, 294:123–131.
Rodriguez, C., Acosta, C., Badia, P., Cejas, J.R., Santamaria, F.J. and Lorenzo, A.2004.Assessment of lipid and essential fatty acids requirements of black sea bream (Spondyliosoma cantharus) by comparison of lipid composition in muscle and liver of wild and captive adult fish. Comperative Biochemistry and Physiology,139B:619-629.
Shapawi, R., Mustafa, S. and Ng, W.K. 2008. Effects of dietary fish oil replacement with vegetable oils on growth and tissue fatty acid composition of humpback grouper, Cromileptes altivelis (Valenciennes). Aquaculture Research, 39:315-323.
doi: 10.1111/j.1365-2109.2007.01882.x
Steffens, W. 1997. Effects of variation in essential fatty acids in fish feeds on nutritive value of freshwater fish for humans. Aquaculture, 15:97-119.
Şener, E. and Yıldız, M.2003.Effect of the different oil on growth performance and body composition of rainbow trout (Oncorhynchus mykiss W. 1792) juveniles. Turkish Journal of Fisheries and Aquatic Sciences, 3:111-116.
Tibbetts, S.M., Lall, S.P. and Milley. J.E. 2004. Apparent digestibility of common feed ingredients by juvenile haddock, Melanogrammus aeglefinus L. Aquaculture Research, 35:643-651.
doi: 10.1111/j.1365-2109.2004.01060.x
Tibbetts, S.M., Milley J.E. and Lall, S.P. 2006. Apparent protein and energy digestibility of common and alternative feed ingredients by Atlantic cod, Gadus
morhua (Linnaeus, 1758). Aquaculture, 261:
1314-1327. doi: 10.1016/j.aquaculture.2006.08.052 Tocher, D.R. 2003.Metabolism and functions of lipids and
fatty acids in teleost fish. Reviews in Fisheries Science, 11:107-184. doi: 10.1080/713610925 Tocher, D.R., Bell, J.G., Henderson, R.J., McGhee, F.,
Mitchell, D. and Morris, P.C. 2000. The effect of dietary linseed and rapeseed oils on polyunsaturated fatty acid metabolism in Atlantic salmon (Salmo
salar) undergoing parr-smolt transformation. Fish
Physiology and Biochemistry, 23:59-73.
Tocher, D.R., Bell, J.G., Dick, J.R. and Crampton, Viv O. 2003. Effects of dietary vegetable oil on Atlantic salmon hepatocyte fatty acid desaturation and liver fatty acid compositions. Lipids, 38:723-732.
doi: 10.1007/s11745-003-1120-y
Torstensen, B.E., Frøyland, L. and Lie, Ø. 2004. Replacing dietary fish oil with increasing levels of rapeseed oil and olive oil - effects on Atlantic salmon (Salmo
salar L.) tissue and lipoprotein lipid composition and
lipogenic enzyme activities. Aquaculture Nutrition, 10:175-192. doi: 10.1111/j.1365-2095.2004.00289.x Yiğit, M. and Ustaoğlu, S. 2003. Total ve besin madde
sindirilme oranlarının su ürünleri yetiştiriciliğindeki önemi. E.U. Journal of Fisheries and Aquatic Sciences, 20(1-2):287-294.
Yıldız, M. and Şener, E. 2003. Levrek (Dicentrarchus
labrax L., 1758) başlangıç yemlerinde balık yağı
yerine kullanılan farklı bitkisel yağların karaciğer yağı kompozisyonuna etkisi.Turkish JournalofVeterinary andAnimalSciences, 27:709-717.
Zeng, X., Torstensen, B.E., Tocher, D.R., Dick, J.R., Henderson, R.J. and Bell, J.G. 2005. Environmental and dietary influences on highly unsaturated fatty acid biosynthesis and expression of fatty acyl desaturase and elongase genes in liver of Atlantic salmon (Salmo salar). Biochimica et Biophysica Acta, 1734:13-24.