Turkish Journal of Fisheries and Aquatic Sciences 12: 575-583 (2012)
www.trjfas.org ISSN 1303-2712 DOI: 10.4194/1303-2712-v12_3_04
© Published by Central Fisheries Research Institute (CFRI) Trabzon, Turkey in cooperation with Japan International Cooperation Agency (JICA), Japan
The Influence of Substitution of Dietary Fish Oil with Different Vegetable
Oils on Performance and Fatty Acid Composition of Brown Trout, Salmo
trutta
Introduction
It is generally accepted that aquaculture is the fastest growing food production sector in the world. The growth in this sector has maintained a steady annual increase of 9.2% since 1970, while capture fisheries and terrestrial farmed meat sectors have grown only 1.4% and 2.8%, respectively, in the same
period (FAO, 2010). The rapid growth rate of aquaculture calls for a corresponding increase in the supply of feed sources (Tacon and Metian, 2008). Aquafeeds, especially those produced for Salmonids and other carnivorous species, are largely dependent on a limited quantity of wild pelagic fish to provide fish oil for commercial production. Fish oil used in aquaculture feeds constitutes 81% of the total fish oil
Murat Arslan
1,2,*, Necdet Sirkecioglu
3, Abdulkadir Bayir
2, Harun Arslan
2, Mevlut Aras
21
Ataturk University, Ispir Hamza Polat Vocational School, Department of Fisheries and Aquaculture, Ispir, Erzurum, 25900, Turkey.
2
Ataturk University, Faculty of Fisheries, Department of Aquaculture, Erzurum, 25240, Turkey. 3
Ataturk University, Faculty of Agriculture, Department of Agricultural Biotechnology, Erzurum 25240, Turkey.
* Corresponding Author: Tel.: +90.442 2311081; Fax: +90.442 2361128; E-mail: muratars@atauni.edu.tr; arslan.7@gmail.com
Received 1 February 2012 Accepted 18 May 2012
Abstract
Brown trout Salmo trutta (~1 g) were fed four casein-gelatin based diets with different lipid resources for 6 weeks. The sources of dietary lipid were menhaden oil (MO diet), hazelnut oil (HO diet,), a blend of linseed oil and soybean oil (1:1) (LO+SO diet), and soybean lecithin (LE diet). Feeding trial was conducted in a recirculating water system at 13±0.2°C. Fish fed LO+SO diet demonstrated the highest growth performance while those fed HO diet had the lowest growth rate (P<0.05). The fatty acid profiles of fish reflected the fatty acid composition of the diets. High level of docosahexaenoic acid (22:6n-3, DHA) in whole body lipids of fish fed LO+SO diet corresponded with the high level of linolenic acid (18:3n-3, LNA) in the lipids of this diet. Fish fed LE diet which was rich in linoleic acid (18:2n-6, LA) had the highest level of arachidonic acid (20:4n-6 , ARA) in their body. The results suggest that the efficiency of elongation and desaturation of C18 fatty acids depends on the dietary lipid source and brown trout has capacity to transform LA and LNA to ARA and DHA, respectively. Growth depletion in fish fed HO diet might be caused by essential fatty acid deficiency.
Keywords: Brown trout, Salmo trutta, lipids, fatty acids, growth.
Balık Yağı Yerine Kullanılan Farklı Diyetsel Bitkisel Yağların Kahverengi Alabalık (Salmo trutta) Yavrularında Büyüme ve Yağ Asidi Kompozisyonuna Etkisi
Özet
Mevcut çalışmada yaklaşık 1 g ağırlığındaki kahverengi alabalık yavruları 6 hafta süre ile kazein-jelâtin tabanlı yemlerle beslenmiştir. Yemlerde yağ kaynağı olarak balık (ringa) yağı (MO diyeti), fındık yağı (HO diyeti), soya yağı-keten tohumu yağı karışımı (1:1) (LO+SO diyeti) ve soya lesitini (LE diyeti) kullanılmıştır. Kapalı devre su sisteminde yürütülen çalışma boyunca sıcaklık 13±0,2°C olarak gerçekleşmiştir. Çalışma sonunda LO+SO yemi ile beslenen balıklar diğer yemlerle beslenen balıklara göre önemli derecede yüksek büyüme performansı göstermiştir (P<0,05). En düşük büyüme HO yemi ile beslenen balıklarda görülmüştür. Tüm vücuda ait toplam yağların nötral ve polar lipit fraksiyonlarının yağ asidi içerikleri yemlerin yağ asidi içeriklerini yansıtmıştır. Yüksek düzeyde linolenik asit (18:3n-3, LNA) içeriğine sahip LO+SO diyeti ile beslenen balıkların vücudunda, dokozahekzaenoik asit (22:6n-3, DHA) miktarında artış görülmüştür. Benzer şekilde en yüksek araşidonik asit (20:4n-6, ARA) içeriği, 18:2n-6 (linolenik asit, LA) bakımından zengin olan LE diyeti ile beslenen balıklarda görülmüştür. Mevcut çalışmanın sonuçları, kahverengi alabalıkta yemlerdeki yağ kaynağına bağlı olarak LA ve LNA in sırasıyla ARA ve DHA e dönüştürebildiğini göstermektedir. Fındık yağı ile beslenen balıklardaki düşük büyümenin esansiyel yağ asidi eksikliğinden kaynaklandığı düşünülmektedir.
production, and Salmonid species demand the greatest share of resources, using 66.4% of the total amount of fish oil used in aquaculture (Pike, 2005). The fact that production of fish oil is nearing full capacity while the demand required for aquafeeds continues to increase, has led to substantially higher costs for commercial growers. Hence, finding alternative lipid resources for Salmonid feed production is critical to the survival of the industry (Ng et al., 2007).
Dietary lipids are essential to the growth and development of fish. They are used as a source of energy, and provide essential fatty acids that are vital for normal growth, reproduction, metabolic functions and general well being. Lipids are a part of the biomembrane structure, and they provide fat soluble vitamins (precursors for eicosanoids, hormones and vitamin E) and act as enzyme cofactors (Turchini et al., 2009). Like other vertebrates, fish require n-3 and n-6 polyunsaturated fatty acids (PUFA) at certain concentrations. Biologically active forms of essential fatty acids are arachidonic acid (ARA; 20:4n-6) eicosapentaenoic acid (EPA; 20:5n-3), and docosahexaenoic acid (DHA; 22:6n-3). These fatty acids can be synthesized from their precursors linoleic acid (LA; 18:2n-6) and linolenic acid (LNA; 18:3n-3) in freshwater fish, while marine fish appear limited in their capacity to perform this bioconversion. Therefore, vegetable oils rich in LA and LNA seem to be promising candidates to replace fish oil in aquafeeds for freshwater fish (Sargent et al., 1995).
Studies have demonstrated that plant oils can be substituted for fish oil without any compromising effect on growth performance of freshwater fish such as sunshine bass Morone chrysops × M. saxatilis (Wonnacott et al., 2004) and largemouth bass
Micropterus salmoides (Subhadra et al., 2006).
However, in some freshwater fish such as African catfish Clarias gariepinus (Hoffman and Prinsloo, 1995; Ng et al., 2003), hybrid tilapia Oreochromis niloticus × O. aureus (Huang et al., 1998; Ng et al., 2001) and South American catfish Pseudoplatystoma
fasciatum (Arslan et al., 2008), growth depletion was
observed when they were fed diets based on fish oil. Nevertheless, important changes in fatty acid composition in favor of n-6 fatty acids (Ng et al., 2003; Arslan et al., 2008) and lipid accumulation (Caballero et al., 2003) were evident when vegetable oil was substituted in place of fish oil. Studies focused on fish oil replacement are limited in brown trout. Arzel et al. (1994) did not find significant changes in growth of brown trout when replacing fish oil based diets with corn oil based diet, although significant changes were observed in the fatty acid profiles of muscle and liver lipids. In another study, the partial replacement of fish oil with different vegetable oils and animal fats showed no significant impact on growth performance. However, fish fed a diet that combined vegetable oils and animal fat had significantly higher lipid accumulation in their bodies. DHA accumulation remained high regardless of the
dietary lipid sources (Turchini et al., 2003).
Brown trout is a highly regarded species in Turkey and there has been great interest in utilizing the species in commercial aquaculture in recent years. In Turkey, the local market value of this species is approximately four fold the value of rainbow trout, even though the growth rate of brown trout is relatively low compared to the growth rate of rainbow trout. For this reason, brown trout can be considered an important species in efforts to increase diversity in Turkish aquaculture production. In this study, we substituted fish oil (menhaden oil) with different vegetable oils in the diets of brown trout to observe changes in the growth performance and final fatty acid composition of whole body. To the best of our knowledge, the present study is the fist to use hazelnut oil in aquafeeds. Turkey is dominating world total hazelnut production with an annual amount of 500,000 ton (TUIK, 2011). Hence, hazelnut oil can be considered an alternative dietary lipid row material for aquafeeds in Turkey.
Materials and Methods
Experimental Diets
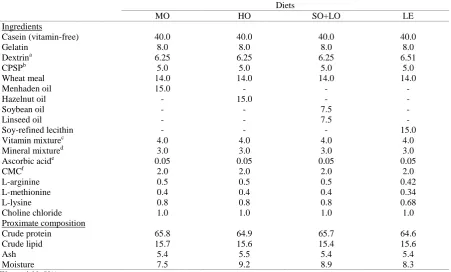
Four experimental casein-gelatin based diets were formulated to be isonitrogenous (65%) and isolipidic (15%), but contain different sources of lipids (Table 1). The first diet contained menhaden oil
(MO) and provided 20-22C long-chain
polyunsaturated fatty acids (LC-PUFA) as well as their precursors. The second diet, composed of hazelnut oil (HO), was characterized by high levels of oleic acid (18:1; OA). The third diet, supplemented with linseed oil and soybean oil (LO+SO), was designed to provide moderate amounts of LA and LNA, but no LC-PUFA. The fourth diet, supplemented with soy-refined lecithin (LE), contained high levels of LA (Table 2). Menhaden oil, soybean oil, linseed oil and soy-refined lecithin were purchased from MP Biomedicals (Aurora, OH, USA). Hazelnut oil was donated by Ordu Yağ Sanayii Ltd. Şti. (Ordu, Turkey). Oils were added to the diets gradually mixing the other ingredients. Diets were prepared with a laboratory pelleting machine after 35-40 g of distilled water was added into 100 g mixture of ingredients, and freeze-dried. Diets were crushed to the approximate size of 0.7-2 mm and kept at -20oC until used.
Fish, Facilities and Sampling
biofiltration was used to maintain stable conditions. Each aquarium was equipped with continuous aeration and the water temperature was 13.0±0.2°C (mean±SD, range 12.5-13.5). Fish were fed four times daily at a readjusted-restricted rate (5% body weight/day) for six weeks, with intermittent biomass measurements taken every two weeks. Feeding rate was re-adjusted every three days for each aquarium using projected weight increases based on feed conversion efficiency. Mortality was recorded every day during the trial. Aquaria were cleaned and feces discarded by siphoning daily. At the conclusion of the six-week feeding trial, survival, percentage of weight gain (WG=(final weight–initial weight)×100/initial weight), specific growth rate (SGR=[loge final
weight–loge initial weight]×100/duration of the
experiment in days), and feed conversion ratio (FCR=feed consumed/weight gain) were calculated. Prior to the onset of the study, 10 brown trout were sacrificed, weighed and stored at -80°C for proximate analysis. At the six-week conclusion, two fish from each aquarium were sampled for lipid and fatty acids and two additional fish from each aquarium were sampled and stored at -80°C for proximate analysis.
Proximate Analysis
Whole-body lipids were extracted according to procedures pioneered by Folch et al. (1957). Other proximate analysis of diets and fish were performed according to the standard methods of AOAC (1985): dry matter after drying in an oven at 105°C until constant weight, crude protein (N x 6.25) by Kjeldhal method after acid digestion, ash content by incineration in a muffle furnace at 600°C for 12 h, and mineral by microwave digestion with HNO3
followed by Inductively Coupled Plasma (ICP) emission spectrometry.
Lipid and Fatty Acid Analysis
Dietary and whole-body lipids were extracted according to the procedure of Folch et al. (1957). After extraction, whole body lipids were separated into polar (phospholipids) and neutral (mostly triglycerides) lipids using Sep-Pak silica cartridges (Waters, Milford, MA, USA). The mobile phases were chloroform and methanol for neutral and phospholipids, respectively (Juaneda and Rocquelin,
Table 1. Composition (%) of the four experimental diets fed to brown trout
Diets
MO HO SO+LO LE
Ingredients
Casein (vitamin-free) 40.0 40.0 40.0 40.0
Gelatin 8.0 8.0 8.0 8.0
Dextrina 6.25 6.25 6.25 6.51
CPSPb 5.0 5.0 5.0 5.0
Wheat meal 14.0 14.0 14.0 14.0
Menhaden oil 15.0 - - -
Hazelnut oil - 15.0 - -
Soybean oil - - 7.5 -
Linseed oil - - 7.5 -
Soy-refined lecithin - - - 15.0
Vitamin mixturec 4.0 4.0 4.0 4.0
Mineral mixtured 3.0 3.0 3.0 3.0
Ascorbic acide 0.05 0.05 0.05 0.05
CMCf 2.0 2.0 2.0 2.0
L-arginine 0.5 0.5 0.5 0.42
L-methionine 0.4 0.4 0.4 0.34
L-lysine 0.8 0.8 0.8 0.68
Choline chloride 1.0 1.0 1.0 1.0
Proximate composition
Crude protein 65.8 64.9 65.7 64.6
Crude lipid 15.7 15.6 15.4 15.6
Ash 5.4 5.5 5.4 5.4
Moisture 7.5 9.2 8.9 8.3
a
Water soluble 80%
b
Concentrate of fish soluble protein (CPSP 90: crude protein, 82-84% WW; crude lipid, 9-13% WW), Sopropêche S.A., Boulogne-sur-mer, France.
c
Trouw Nutrition Premix (Ankara, Turkey), composition per g of the vitamin mixture: vitamin A, 2645.50 IU; vitamin D3, 220.46 IU; vitamin E,
44.09 IU; Vitamin B12, 13 g; riboflavin, 13.23 mg; niacin, 61.73 mg; D-pantothenic acid, 22.05 mg; menadione, 1.32 mg; folic acid, 1.76 mg;
pyridoxine, 4.42 mg; thiamin, 7.95 mg; D-biotin, 0.31 mg.
d Bernhart Tomarelli salt mixture (ICN Pharmaceuticals, Costa Mesa, CA), composition (g/100 g): calcium carbonate, 2.1; calcium phosphate dibasic,
73.5; citric acid, 0.227; cupric citrate, 0.046; ferric citrate (16 to 17% Fe), 0.558; magnesium oxide, 2.5; manganese citrate, 0.835; potassium iodide, 0.001; potassium phosphate dibasic, 8.1; potassium oxide, 6.8; sodium chloride, 3.06; sodium phosphate, 2.14; and zinc citrate, 0.133. Five milligrams of Se in the form of sodium selenite was added per kilogram of the salt mixture.
e
Phosphitan C (Mg-L-ascorbyl-2-phospahte), Sigma, Germany.
f
1985). Fatty acid methyl esters (FAME) were prepared according to protocols established by Metcalfe and Schmitz (1961) and analyzed as described earlier in the text (Czesny and Dabrowski, 1998). The FAMEs obtained were determined by gas chromatography (Agilent 6890 N), equipped with a flame ionization oven and fitted with a DB 23 capillary column (60 m, 0.25 mm i.d. and 0.25 µm) ejector. The detector temperature program was set at 190°C for 35 minutes, and then increased at a rate of 30°C/minute up to 220°C, where the temperature was maintained for five minutes. Carrier gas was hydrogen (2ml/min and split ratio was 30:1). The individual fatty acids were identified by comparing their retention times to that of a standard mix of fatty acids (Supelco 37 component FAME mix), and quantification of the individual fatty acids was made against a C19:0 internal standard from Sigma (USA). Fatty acids were expressed as percent of total identified FAME.
Statistical Analysis
Results were expressed as mean±SD (n=3). Each experimental unit (aquarium) was considered a replicate. For the fatty acids, two fish per aquarium were analyzed, and the average values were used for each experimental unit. Data were subjected to analysis of variance (ANOVA) and subsequent comparison of Means by Duncan’s multiple range test. Percentage data were arcsin transformed prior to
statistical analysis. Differences were considered statistically significant at P<0.05.
Results
Proximate and Fatty Acid Composition of the Experimental Diets
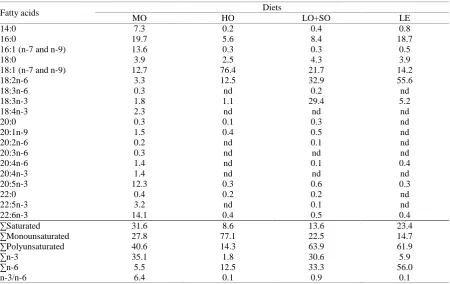
Proximate compositions of the experimental diets are presented in Table 1. Fatty acid composition of the diets reflected the fatty acid content of the dietary lipid sources (Table 2). The MO diet contained high levels of EPA and DHA. The HO diet was characterized by high amounts of OA with low levels of all other fatty acids. The LO+SO diet had approximately the same amount of LA and LNA, which were the main fatty acids in this diet. The LE diet was rich in LA.
Growth Performance
Dietary treatments significantly influenced growth performance of juvenile brown trout (P<0.05). Fish fed LO+SO diet exhibited the highest growth performance, while HO fed fish demonstrated the poorest growth. Fish that were fed MO and LE diets demonstrated similar growth rates (Table 3). Fish fed the LO+SO diet had significantly higher feed conversion ratio (FCR) than those fed MO and HO diets (P<0.05). Survival was not influenced by the dietary treatments and maintained a consistency of 86.0±11.5%.
Table 2. Fatty acid composition (% of total fatty acids) of experimental diets
Fatty acids Diets
MO HO LO+SO LE
14:0 7.3 0.2 0.4 0.8
16:0 19.7 5.6 8.4 18.7
16:1 (n-7 and n-9) 13.6 0.3 0.3 0.5
18:0 3.9 2.5 4.3 3.9
18:1 (n-7 and n-9) 12.7 76.4 21.7 14.2
18:2n-6 3.3 12.5 32.9 55.6
18:3n-6 0.3 nd 0.2 nd
18:3n-3 1.8 1.1 29.4 5.2
18:4n-3 2.3 nd nd nd
20:0 0.3 0.1 0.3 nd
20:1n-9 1.5 0.4 0.5 nd
20:2n-6 0.2 nd 0.1 nd
20:3n-6 0.3 nd nd nd
20:4n-6 1.4 nd 0.1 0.4
20:4n-3 1.4 nd nd nd
20:5n-3 12.3 0.3 0.6 0.3
22:0 0.4 0.2 0.2 nd
22:5n-3 3.2 nd 0.1 nd
22:6n-3 14.1 0.4 0.5 0.4
∑Saturated 31.6 8.6 13.6 23.4
∑Monounsaturated 27.8 77.1 22.5 14.7
∑Polyunsaturated 40.6 14.3 63.9 61.9
∑n-3 35.1 1.8 30.6 5.9
∑n-6 5.5 12.5 33.3 56.0
n-3/n-6 6.4 0.1 0.9 0.1
Proximate Composition of Fish
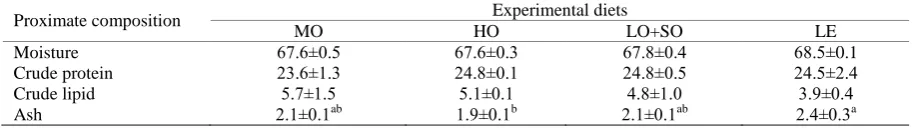
The proximate composition of brown trout showed no significant changes regardless of the dietary treatment and different lipid sources. The only exception was for ash content, which was shown to be highest in fish fed the LE diet and lowest in fish fed the HO diet (P<0.05) (Table 4).
Fatty Acid Composition of Fish
Fatty acid composition of the neutral and phospholipids fractions of whole body lipids reflected the fatty acid composition of the diets (Table 5 and 6). With respect to neutral lipids, all the individual fatty acids were significantly influenced by the dietary treatments (P<0.05) except 22:0. The concentration of saturated fatty acids (SFA) was significantly higher in fish receiving the MO diet than in those receiving any of the other three diets. Fish fed the HO diet had the lowest SFA content. Monounsaturated fatty acid level was between 2 and 2.5 times higher in fish fed the HO diet which was composed mostly of OA. Polyunsaturated fatty acids were higher in fish fed the LO+SO and LE diets than those fed the others. The main contributors of PUFAs were n-6 fatty acids (especially LA) in the LE diet fed fish, whereas n-3 and n-6 contributions were close in fish fed the LO+SO diet (Table 5). OA was the most abundant fatty acid in fish fed the MO and the HO diets, while LA was the predominant fatty acid of the fish fed the LO+SO and the LE diets. The amount of LNA in fish fed the LO+SO diet was significantly greater (between fivefold and thirtyfold) than those on the other experimental diets. Fish fed the MO diet demonstrated significantly higher levels of EPA and
DHA than those in all the other groups.
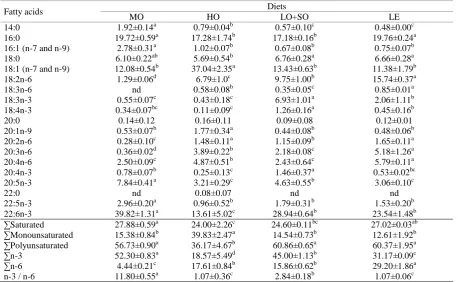
With respect to phospholipids, dietary lipid sources significantly influenced the fatty acid composition of fish (P<0.05). DHA was the most abundant fatty acids in all experimental groups except for those fed the HO diet, where OA was the predominant fatty acid. The amount of saturated fatty acids was lowest and the level of monounsaturated fatty acids was highest in fish fed the HO diet. The main contributor of saturated fatty acids was palmitic acid (16:0) in all cases, regardless of dietary treatments, with higher amounts reflected in fish fed the MO and LE diets. The contents of polyunsaturated fatty acids were similar in fish fed the MO, the LO+SO and the LE diets, with the values significantly higher than those on the HO diet. The ratio of n-3 fatty acids to n-6 fatty acids was highest in fish fed the MO diet and lowest in those fed the HO and the LE diets. Fish fed the LE diet had significantly higher amounts of ARA than those of the other experimental groups. Fish on the MO diet had the highest DHA level among all treatments. In comparison to the other groups, the HO fed fish had significantly higher amount of OA and the fish on the LE diets showed significantly higher levels of LA.
Discussion
In the present study, brown trout demonstrated better growth performance when compared to observations previously reported for this species (Arzel et al., 1994; Pirhonen and Forsman, 1998; Johnsson et al., 2000; Regost et al., 2001; Turchini et al., 2003). However, smaller fish in size were used in the present study. It was evident that dietary lipids from plant resources, with the exception of hazelnut
Table 3. Growth performance and survival of brown trout juveniles fed diets with different dietary lipid resources for 6
weeks. Means with different superscript letters in a row are significantly different (P<0.05)
Growth parameters Experimental diets
MO HO LO+SO LE
Final weight ±g) 3.1±0.1b 2.8±0.1c 3.5±0.0a 3.1±0.1b
Weight gain ±%)1 285.9±7.2b 255.8±9.2c 317.2±4.1a 284.7±7.4b
SGR ±%)2 2.3±0.1b 2.1±0.1c 2.6±0.0a 2.3±0.1b
FCR3 1.2±0.1b 1.2±0.1b 1.3±0.1a 1.3±0.1ab
Survival ±%) 82.7±12.9 90.7±6.1 76.6±13.9 94.7±4.6
1Weight gain = [±final weight – initial weight) x 100] / initial weight 2
Specific growth rate ±SGR) = [±loge final weight – loge initial weight) x 100] / duration of the experiment in days 3Feed conversion ratio ±FCR) = feed consumed / weight gain
Table 4. Proximate composition of brown trout juveniles fed diets with different dietary lipid resources for 6 weeks. Means
with different superscript letters in a row are significantly different (P<0.05)
Proximate composition Experimental diets
MO HO LO+SO LE
Moisture 67.6±0.5 67.6±0.3 67.8±0.4 68.5±0.1
Crude protein 23.6±1.3 24.8±0.1 24.8±0.5 24.5±2.4
Crude lipid 5.7±1.5 5.1±0.1 4.8±1.0 3.9±0.4
Table 5. Fatty acid composition (% of total fatty acids) of neutral lipids of whole-body brown trout juveniles fed diets with
different dietary lipid resources for 6 weeks. Means with different superscript letters in a row are significantly different (P<0.05)
Fatty acids Diets
MO HO LO+SO LE
14:0 6.61±0.38a 1.03±0.11b 1.13±0.36b 1.45±0.26b
16:0 17.44±1.10a 7.60±0.27c 9.91±1.00b 16.99±0.56a
16:1 (n-7 and n-9) 11.06±1.11a 1.59±0.27b 1.61±0.60b 1.98±0.34b
18:0 2.93±2.22 b 2.72±0.02b 4.43±0.12ab 5.47±0.13a
18:1 (n-7 and n-9) 21.36±2.09c 69.74±1.32a 25.49±1.43b 20.10±0.63c
18:2n-6 4.61±1.12d 8.33±0.69c 26.74±2.65b 33.69±1.72a
18:3n-6 0.28±0.01c 0.71±0.14b 0.79±0.08b 2.01±0.18a
18:3n-3 1.42±0.21bc 0.50±0.09c 15.91±2.11a 3.18±1.51b
18:4n-3 1.70±0.07b 0.16±0.01d 2.58±0.22a 0.90±0.15c
20:0 0.42±0.03a 0.14±0.00b 0.13±0.09b 0.14±0.07b
20:1n-9 2.25±0.36b 3.36±0.76a 1.39±0.19b 1.54±0.28b
20:2n-6 0.42±0.11d 0.60±0.05c 1.21±0.03b 2.23±0.13a
20:3n-6 0.46±0.07c 0.69±0.07bc 0.93±0.01ab 2.52±0.26a
20:4n-6 1.16±0.08a 0.39±0.03b 0.33±0.11b 1.21±0.22a
20:4n-3 1.54±0.18a 0.03±0.05d 1.08±0.16b 0.36±0.05c
20:5n-3 7.50±0.12a 0.54±0.07c 1.47±0.44b 1.44±0.49b
22:0 0.61±0.20 0.34±0.07 0.50±0.04 0.59±0.20
22:5n-3 4.00±0.40a 0.35±0.14b 0.81±0.17b 0.96±0.51b
22:6n-3 14.23±1.26a 1.17±0.28c 3.55±0.50b 3.26±0.86b
∑Saturated 28.00±1.07a 11.83±0.37d 16.10±1.42c 24.65±0.65b
∑Monounsaturated 34.67±2.78b 74.69±0.81a 28.49±2.11c 23.61±0.51d
∑Polyunsaturated 37.34±3.01b 13.47±0.99c 55.41±3.51a 51.74±0.59a
∑n-3 30.39±1.99a 2.75±0.40d 25.40±1.13b 10.10±1.12c
∑n-6 6.94±1.34d 10.72±0.62c 30.01±2.45b 41.65±1.44a
n-3 / n-6 4.46±0.67a 0.26±0.02b 0.85±0.04b 0.24±0.04b
Table 6. Fatty acid composition (% of total fatty acids) of phospholipids of whole-body brown trout juveniles fed diets with
different dietary lipid resources for 6 weeks. Means with different superscript letters in a row are significantly different (P<0.05)
Fatty acids Diets
MO HO LO+SO LE
14:0 1.92±0.14a 0.79±0.04b 0.57±0.10c 0.48±0.00c
16:0 19.72±0.59a 17.28±1.74b 17.18±0.16b 19.76±0.24a
16:1 (n-7 and n-9) 2.78±0.31a 1.02±0.07b 0.67±0.08b 0.75±0.07b
18:0 6.10±0.22ab 5.69±0.54b 6.76±0.28a 6.66±0.28a
18:1 (n-7 and n-9) 12.08±0.54b 37.04±2.35a 13.43±0.63b 11.38±1.79b
18:2n-6 1.29±0.06d 6.79±1.0c 9.75±1.00b 15.74±0.37a
18:3n-6 nd 0.58±0.08b 0.35±0.05c 0.85±0.01a
18:3n-3 0.55±0.07c 0.43±0.18c 6.93±1.01a 2.06±1.11b
18:4n-3 0.34±0.07bc 0.11±0.09c 1.26±0.16a 0.45±0.16b
20:0 0.14±0.12 0.16±0.11 0.09±0.08 0.12±0.01
20:1n-9 0.53±0.07b 1.77±0.34a 0.44±0.08b 0.48±0.06b
20:2n-6 0.28±0.10c 1.48±0.11a 1.15±0.09b 1.65±0.11a
20:3n-6 0.36±0.02d 3.89±0.22b 2.18±0.08c 5.18±1.26a
20:4n-6 2.50±0.09c 4.87±0.51b 2.43±0.64c 5.79±0.11a
20:4n-3 0.78±0.07b 0.25±0.13c 1.46±0.37a 0.53±0.02bc
20:5n-3 7.84±0.41a 3.21±0.29c 4.63±0.55b 3.06±0.10c
22:0 nd 0.08±0.07 nd nd
22:5n-3 2.96±0.20a 0.96±0.52b 1.79±0.31b 1.53±0.20b
22:6n-3 39.82±1.31a 13.61±5.02c 28.94±0.64b 23.54±1.48b
∑Saturated 27.88±0.59a 24.00±2.26c 24.60±0.11bc 27.02±0.03ab
∑Monounsaturated 15.38±0.84b 39.83±2.47a 14.54±0.73b 12.61±1.92b
∑Polyunsaturated 56.73±0.90a 36.17±4.67b 60.86±0.65a 60.37±1.95a
∑n-3 52.30±0.83a 18.57±5.49d 45.00±1.13b 31.17±0.09c
∑n-6 4.44±0.21c 17.61±0.84b 15.86±0.62b 29.20±1.86a
n-3 / n-6 11.80±0.55a 1.07±0.36c 2.84±0.18b 1.07±0.06c
oil, did not cause any adverse effect on growth or lipid accumulation in brown trout. On the contrary, the greatest growth performance in this study was achieved by fish that were fed the LO+SO diet, in which the dietary lipid source was a blend of linseed and soybean oils. Fish fed the MO and the LE diets demonstrated similar growth performance. A total substitution of fish oil with a blend of rapeseed oil and linseed oil (1:1), providing approximately equal amount of LA and LNA, resulted in significantly higher growth in Atlantic salmon after a full life cycle trial (Tocher et al., 2003). This research supports the results achieved in this study. Additional previous studies have also reported greater growth in the cases where dietary vegetable oils were used in place of fish oil in some fish species such as South American catfish (Arslan et al. 2008), rainbow trout
Oncorhynchus mykiss (Rinchard et al. 2007), African
catfish (Hoffman and Prinsloo, 1995; Ng et al. 2003), and hybrid tilapia (Huang et al., 1998; Ng et al., 2001). In freshwater fish species, LA and LNA will fulfill the essential fatty acid requirements because freshwater fish have the ability to convert these fatty acids to longer chain n-3 and n-6 PUFA (Sargent et al., 1995). Therefore, vegetable oils rich in LA and LNA are particularly important lipid sources for freshwater fish.
Phospholipids are known to increase lipid utilization and their incorporation into enterocytes (Hadas et al., 2003). Several studies have reported that dietary soybean lecithin, a phospholipids source, had growth promoting effect in sea bass (Cahu et al., 2003), rainbow trout (Rinchard et al., 2007), carp
Cyprinus carpio (Geurden et al., 1997), and South
American catfish (Arslan et al., 2008). In rainbow trout, fish fed a diet with lecithin as the primary dietary lipid source had significantly higher growth performance than those fed a diet with fish oil in water temperatures ranging from 15 to 19oC (Rinchard et al., 2007). In the present study, which was conducted at a temperature of 13oC, fish fed a diet with fish oil (the MO diet) showed similar growth rates as those fed diets with soybean lecithin (the LE diet). The primary difference between these two studies was the water temperature. In vitro studies have shown that the physical state of lipids influence the digestibility of emulsified lipids. It is evident that lipids are digested better in a liquid form than in a solid state (Bonnaire et al., 2008). Therefore, lecithin might not have been utilized at the lower temperature as a source of solid phospholipids as efficiently as it was in relatively higher temperatures.
Hazelnut oil is characterized by high levels of OA and low levels of essential fatty acids, LA and LNA. Fish fed the diet with hazelnut oil had the poorest growth performance in this study, indicating a deficiency in essential fatty acids in brown trout. Similar results were observed in rainbow trout fed a diet deficient in essential fatty acids where the lipid source was oleic acid methyl esters (Rinchard et al.,
2007). However, there were no symptoms of deficiency such as fin erosion and occurrences of bacterial diseases observed during the feeding trial. Nonetheless, these types of deficiency symptoms were observed in rainbow trout that were fed a diet deficient in essential fatty acids after an eight-month feeding trial (Castell et al., 1972).
Blends of vegetable oils are considered the best alternative to substitute fish oil in aquafeeds, because no single raw lipid material is able to replace fish oil by itself. A combination of fat sources provides a wide variety of fatty acid profiles and averts the negative impact of diets with amounts that are too high or too low ratio of n-3/n-6 (Wassef et al., 2009). In the present study, the SO+LO diet, with a vegetable oil blend characterized by high amounts of LA and LNA which are the essential fatty acids for freshwater fish (Sargent el al., 1995), provided the best growth performance in brown trout. In nature, the diets of brown trout consist primarily of two benthic invertebrates: Gammaridae and Tricoptera (Kara and Alp, 2005). The most abundant fatty acids in these aquatic invertebrates are 16:0, 16:1 and OA. Unlike fish oil, DHA level is very low in these organisms. However, EPA profiles of those are similar with fish oil (Sushchik et al., 2003).
fatty acid (Bell et al., 2003). Our results are consistent with earlier studies in which diet independent DHA accumulation was observed in Atlantic salmon that were fed diets in which fish oil was substituted by linseed oil at different levels (Menoyo et al., 2005). However, fish fed HO diet had higher amounts of ARA and 20:3n-6 than fish fed the SO+LO diet, even though the latter diet had more than twice the level of LA, which is a precursor to these fatty acids. These results may be due to the stimulation of the Δ5 desaturase and elongase enzyme activities in the case of lower essential fatty acid presence. The other reason might be the enzyme competition in favor of bioconversion of n3 fatty acids (Torstensen and Tocher, 2010).
Conclusions
In the present study, vegetable oils successfully replaced fish oil in the diet of brown trout. The only exception was hazelnut oil, which lacks essential fatty acids required by fish to thrive. Fish fed the HO diet had depleted growth because of the absence of essential fatty acids. However, further studies should be conducted to optimize hazelnut oil amount used in dietary oil blends meeting the essential fatty acid requirements of fish. The LO+SO diet (a blend of linseed oil and soybean oil) provided the best rate of growth. Replacing fish oil with vegetable oil caused major reduction in LC-PUFAs. The increase in the levels of 20:4n-3, 20:3n-6, 20:4n-6, EPA, and DHA in fish fed the LO+SO and the LE diets, which were rich in LA and LNA, demonstrated that brown trout have the ability to convert 18C fatty acids to LC-PUFAs.
Acknowledgement
This study was supported by the Research Foundation of Ataturk University (Project number: BAP-2008/225) and the State Planning Organization of Prime Ministry of Turkish Republic (Project number: DPT 2006/K03). Thanks are due to Suzanne Brownlow and Tim Parker for manuscript revision and suggestions.
References
Arslan, M., Rinchard, J., Dabrowski, K. and Portella, M.C. 2008. Effects of different dietary lipid sources on the survival, growth and fatty acid composition of South American catfish (Pseudoplatystoma fasciatum), surubim, juveniles. Journal of the World Aquaculture Society, 39: 51-61.
doi: 10.1111/j.1749-7345.2007.00133.x
Arzel, J., Martinez Lopez, F.X., Métailler, R., Stéphan, G., Viau, M., Gandemer, G. and Guillaume, J. 1994. Effect of dietary lipid on growth performance and body composition of brown trout (Salmo trutta) reared in sea water. Aquaculture, 123: 361-375.
doi: 10.1016/0044-8486(94)90071-X
AOAC, 1985. Official Methods of the Association of
Analytical Chemists, 14th Edt., Washington, DC., 1018 pp.
Bell, J.G, Tocher, D.R., Henderson, R.J., Dick, J.R. and Crampton, V.O. 2003. Altered fatty acid compositions in Atlantic salmon (Salmo salar) fed diet containing linseed and rapeseed oils can be partially restored by subsequent fish oil finishing diet. Journal of Nutrition, 133: 2793-2801.
Bonnaire, L., Sandra, S., Helgason, T., Decker, E.A., Weiss, J. and McClements, D.J. 2008. Influence of lipid physical state on the in vitro digestibility of emulsified lipids. Journal of Agricultural and Food Chemistry, 56: 3791-3797.
doi: 10.1021/jf800159e
Caballero, M.J., Izquierdo, M.S., Kjorsvik, E., Montero, D., Socorro, J., Fernandez, A.J. and Rosenlund, G. 2003. Morphological aspects of intestinal cells from gilthead seabream (Sparus aurata) fed diets containing different lipid sources. Aquaculture, 225: 325–340. doi: 10.1016/S0044-8486(03)
Cahu, C.L., Zambonino, J.L. and Barbosa, V. 2003. Effect of dietary phospholipids level and phospholipids: neutral lipid value on the development of sea bass (Dicentrarchus labrax) larvae fed a compound diet. British Journal of Nutrition, 90: 21–28. doi: 10.1079/BJN2003880
Castell, J.D., Lee, D.J. and Sinnhuber, R.O. 1972. Essential fatty acids in the diet of rainbow trout: lipid metabolism and fatty acid composition. Journal of Nutrition, 102: 93–99.
Czesny, S. and Dabrowski, K. 1998. The effect of egg fatty acid concentrations on embryo viability in wild and domesticated walleye (Stizostedion vitreum). Aquatic Living Resources, 11: 371-378.
doi: 10.1016/S0990-7440(99)80002-3
FAO (United Nation’s Food and Agricultural Organization) 2010. The State of World Fisheries and Aquaculture, FAO, Rome.
Folch, J., Lees, M. and Stanley, G.H.S. 1957. A simple method for the isolation and purification of total lipids from animal tissues. The Journal of Biological Chemistry, 226: 497-509.
Geurden, I., Charlon, N., Marion, D. and Bergot, P. 1997. Influence of purified soybean phospholipids on early development of common carp. Aquaculture International, 5: 137–149.
Hadas, E., Koven, W., Sklan,. D. and Tandler, A. 2003. The effect of dietary phosphatidylcholine on the assimilation and distribution of ingested free oleic acid (18:1n-9) in gilthead seabream (Sparus aurata) larvae. Aquaculture, 217: 577-588.
doi: 10.1016/S0044-8486(02)00431-3
Hoffman, L.C. and Prinsloo, J.F. 1995. The influence of different dietary lipids on the growth and body composition of the African sharptooth catfish, Clarias gariepinus (Burchell). South African Journal of Science, 91: 315–320.
Huang, C.H., Huang, M.C. and Hou, P.C. 1998. Effect of dietary lipid on fatty acid composition and lipid peroxidation in sarcoplasmic reticulum of hybrid tilapia, Oreochromis niloticus x O. aureus. Comparative Biochemistry and Physiology - Part B: Biochemistry and Molecular Biology, 120: 331–336. doi: 10.1016/S0305-0491(98)10022-6
hatchery conditions. Journal of Fish Biology, 57: 326-336. doi: 10.1006/jfbi.2000.1305
Juaneda, P. and Rocquelin, G. 1985. Rapid and convenient separation of phospholipids and non phosphorus lipids from rat heart using silica cartridges. Lipids, 30: 40– 41. doi: 10.1007/BF02534360
Kara, C. and Alp, A. 2005. Feeding habits and diet compositions of brown trout (Salmo trutta) in the upper streams of River Ceyhan and River Euphrates in Turkey. Turkish Journal of Veterinary and Animal Sciences, 29: 417-428.
Menoyo, D., Lopez-Bote, C.J., Obach, A. and Bautista, J.M. 2005. Effect of dietary fish oil substitution with linseed oil on the performance, tissue fatty acid profile, metabolism, and oxidative stability of Atlantic salmon. Journal of Animal Science, 83: 2853-2862. Metcalfe, L.D. and Schmitz, A.A. 1961. The rapid
preparation of fatty acid esters for gas chromatographic analysis. Analytical Chemistry, 33: 363-364.
Ng, W.K., Lim, P.K. and Sidek, H. 2001. The influence of a dietary lipid source on growth, muscle fatty acid composition and erythrocyte osmotic fragility of hybrid tilapia. Fish Physiology and Biochemistry,25: 301–310. doi: 10.1023/A:1023271901111
Ng, W.K., Lim, P.K. and Boey, P.L. 2003. Dietary lipid and palm oil source affects growth, fatty acid composition and muscle a-tocopherol concentration of African catfish, Clarias gariepinus. Aquaculture, 215: 119– 143. doi: 10.1016/S0044-8486(02)00067-4
Ng, W.K., Tocher, D.R. and Bell, J.G. 2007. The use of paim oil in aquaculture feeds for salmonid species. European Journal of Lipid Science and Technology, 109: 394-399. doi: 10.1002/ejlt.200600209
Pike, I. 2005. Eco-efficiency in aquaculture: global catch of wild fish used in aquaculture. International Aquafeed, 8: 38–40.
Pirhonen, J. and Forsman, L. 1998. Effect of prolonged feed restriction on size variation, feed consumption, body composition, growth and smolting of brown trout,
Salmo trutta. Aquaculture, 162: 203-217. doi: 10.1016/S0044-8486(98)00215-4
Regost, C., Arzel, J., Cardinal, M., Laroche, M. and Kaushik, S.J. 2001. Fat deposition and flesh quality in sea water reared, triploid brown trout (Salmo trutta) as affected by dietary fat levels and starvation. Aquaculture, 193: 325-345.
doi: 10.1016/S0044-8486(00)00498-1
Rinchard, J., Czesny, S. and Dabrowski, K. 2007. Influence of lipid class and fatty acid deficiency on survival, growth and fatty acid composition in rainbow trout juveniles. Aquaculture, 264: 363- 371.
doi: 10.1016/j.aquaculture.2006.11.024
Ruxton, C.H.S., Calder, P.C., Reed, S.C. and Simpson, M.J.A. 2005. The impact of long-chain n-3 polyunsaturated fatty acids on human health. Nutrition Research Reviews, 18: 113-129.
doi: 10.1079/NRR200497
Sargent, J.R., Bell, J.G. Bell, M.V., Henderson, R.J. and Tocher D.R. 1995. Requirement criteria for essential
fatty acids. Journal of Applied Ichthyology, 11: 183– 198. doi:10.1111/j.1439-0426.1995.tb00018.x Sinclair, A.J., Begg, D.P., Mathai, M. and Weisinger, R.S.
2007. Omega 3 fatty acids and the brain: review of studies in depression. Asia Pacific Journal of Clinical Nutrition, 16: 391-397.
Subhadra, B., Lochmann, R., Rawles, S. and Chen, R.G. 2006. Effect of dietary lipid source on the growth, tissue composition and hematological parameters of largemouth bass (Micropterus salmoides). Aquaculture, 255: 210-222.
doi: 10.1016/j.aquaculture.2005.11.043
Sushchik, N.N., Gladyshev, M.I., Moskvichova, A.V., Makhutova, O.N. and Kalachova, G.S. 2003. Comparison of fatty acid composition in major lipid classes of the dominant benthic invertebrates of the Yenisei River. Comparative Biochemistry and Physiology - Part B: Biochemistry and Molecular Biology, 134: 111-122.
doi: 10.1016/S1096-4959(02)00191-4
Tacon, A.G.J. and Metian, M. 2008. Global overview on the use of fish meal and fish oil in industrially compounded aquafeeds: Trend and future prospects. Aquaculture,285: 146-158.
doi: 10.1016/j.aquaculture.2008.08.015
Tocher, D.R., Bell, J.G., McGhee, F., Dick, J.R. and Fonseca-Madrigal, J. 2003. Effects of dietary level and vegetable oil on fatty acid metabolism in Atlantic salmon (Salmo salar) over the entire production cycle. Fish Physiology and Biochemistry, 29: 193-209. doi: 10.1023/B:FISH.0000045722.44186.ee
Torstensen, B.E. and Tocher, D.R. 2010The effect of fish oil replacement on lipid metabolism of fish. In: G.M. Turchini, W.K. Ng and D.R. Tocher (Eds.) Fish Oil Replacement and Alternative Lipid Sources in Aquaculture Feeds, CRC Press, Boca Raton: 405-437 TUIK (Turkey Statistics Organization) (2001) Agricultural
Production Statistics for 2009, Ankara, Turkey. Turchini, G.M., Mentasti, T., Frøyland, L., Orban, E.,
Caprino, F., Moratti, V.M. and Valfré, F. 2003. Effect of alternative dietary lipid sources on performance, tissue chemical composition, mitochondrial fatty acid oxidation capabilities and sensory characteristics in brown trout (Salmo trutta L.). Aquaculture, 225: 251-267. doi: 10.1016/S0044-8486(03)00294-1
Turchini, G.M., Torstensen, B.E. and Ng, W.K. 2009. Fish oil replacement in finfish nutrition. Reviews in Aquaculture, 1: 10-57.
doi: 10.1111/j.1753-5131.2008.01001.x
Wassef, E.A., Wahby, O.M. and Sakr, E.M. 2009. Vegetable oil blend as alternative lipid resources in diets for gilthead seabream, Sparus aurata. Aquaculture International, 17: 421–435.
doi: 10.1007/s10499-008-9213-7