Cite as
Małodobra-Mazur M, Alama A, Bednarska-Chabowska D, Pawelka D, Myszczyszyn A, Dobosz T. Obesity-induced insulin resistance via changes in the DNA methylation profile of insu-lin pathway genes. Adv Cof insu-lin Exp Med. 2019;28(12):1599–1607. doi:10.17219/acem/110321
DOI
10.17219/acem/110321
Copyright
© 2019 by Wroclaw Medical University This is an article distributed under the terms of the Creative Commons Attribution 3.0 Unported (CC BY 3.0) (https://creativecommons.org/licenses/by/3.0/)
Address for correspondence
Małgorzata Małodobra-Mazur
E-mail: [email protected]
Funding sources
Statutory activity – maintain the research capacity, Wroclaw Medical University, ST.A122.16.030
Conflict of interest
None declared
Received on April 23, 2019 Reviewed on May 7, 2019 Accepted on June 27, 2019
Published online on November 25, 2019
Abstract
Background. Obesity has been shown to play a key role in the development of insulin resistance (IR). Abundant data implicate obesity in DNA hypermethylation at global and site-specific levels, including genes regulating insulin sensitivity. Deregulation of epigenetic marks implicates gene expression and changes in cell metabolism.
Objectives. Our previous reports demonstrated that the strongest risk factor in the development of IR is BMI; accordingly, the objective of this study was to investigate the effect of obesity on DNA methylation and insulin sensitivity.
Material and methods. A study was carried out on lymphocytes (N-34) and visceral adipose tissue (VAT; N-35) of insulin-resistant subjects and healthy controls. Genetic material (DNA and RNA) was extracted from cells. Global and site-specific DNA methylation was analyzed with the use of restriction enzymes fol-lowed by real-time polymerase chain reaction (PCR). Gene expression was analyzed as relative mRNA level normalized to a housekeeping gene.
Results. Global DNA methylation increased in both types of tissue in obese and insulin-resistant individu-als and correlated positively with IR. Two of the 3 investigated promoters of insulin pathway genes were hypermethylated, which correlated negatively with gene expression and positively with IR. The DNMT3a
gene was upregulated in obese insulin-resistant individuals in both types of tissues and correlated positively with global DNA methylation.
Conclusions. DNA methylation profile changed depending on body mass index (BMI) and influenced glucose metabolism and insulin sensitivity in VAT.
Key words: obesity, insulin resistance, DNA methylation, insulin signaling pathway
Obesity-induced insulin resistance via changes
in the DNA methylation profile of insulin pathway genes
Małgorzata Małodobra-Mazur
1,A,C–F, Aneta Alama
1,B,C, Dorota Bednarska-Chabowska
2,B,
Dorota Pawelka
3,B, Aneta Myszczyszyn
4,B, Tadeusz Dobosz
1,A1 Molecular Techniques Unit, Department of Forensic Medicine, Wroclaw Medical University, Poland 2 Department of Angiology, Hypertension and Diabetology, Wroclaw Medical University, Poland
3 1st Department and Clinic of General, Gastroenterological and Endocrinological Surgery, Wroclaw Medical University, Poland 4 1st Department and Clinic of Gynecology and Obstetrics, Wroclaw Medical University, Poland
A – research concept and design; B – collection and/or assembly of data; C – data analysis and interpretation; D – writing the article; E – critical revision of the article; F – final approval of the article
Introduction
Overweight and obesity are among the leading problems of modern civilization. Obesity plays a key role in the de-velopment of insulin resistance (IR), leading to other meta-bolic disorders along with the consequent development of type 2 diabetes (T2D).1 Insulin resistance is defined as a state in which a standard amount of insulin is insuf-ficient to develop the physiological response of the cell, i.e., increasing glucose uptake, storage and oxidation.2
Population and family studies confirmed the genetic background of both obesity and IR, suggesting suscep-tible loci as one of the causes of both conditions. However, the impact of the genetic background on the induction of obesity and obesity-related disorders turned out to be relatively modest. In both conditions (obesity and IR), the key role is played by gene–environment interaction; accordingly, epigenetic changes in chromatin structures and gene function may be responsible for genetic suscepti-bility.3 Epigenetic markers are believed to explain the link between gene–lifestyle interactions and the pathogenesis of numerous metabolic disorders and have even been pro-posed as specific biomarkers of metabolic disorders and possible therapeutic targets.4
Epigenetic modification is defined as the heritable and reversible modification of gene expression without changes in the DNA sequence, maintained over generations.5 Epi-genetic modifications include DNA methylation, the po-sitioning of nucleosomes, and modifications in histones. All of these modifications are involved in establishing and maintaining the 2 major forms of chromosomal structure: the inactive heterochromatin and the transcriptionally active euchromatin.6‒10
Indeed, abundant data implicate obesity in DNA hyper-methylation at both global and site-specific levels, includ-ing genes regulatinclud-ing insulin sensitivity, such as ADIPOQ,
LPL, or PPARγ.11‒13 Zheng et al. reported a link between
obesity and methylation of mtDNA (mitochondrial DNA).14 Analysis of DNA methylation carried out before and af-ter weight loss revealed a differentially methylated region of the genome correlated with numerous genes, including 21 genes regulating insulin sensitivity.15 A genome-wide DNA methylation study showed the differentially meth-ylated profiles of numerous CpG sites in visceral adipose tissue (VAT) of insulin-resistant vs insulin-sensitive obese individuals.16 On the other hand, caloric restriction was demonstrated to modulate chromatin function and in-crease genome stability mainly by reversing DNA methyla-tion, which correlated with improving insulin sensitivity and whole-body weight reduction.17,18
The exact mechanism by means of which obesity influ-ences insulin sensitivity via DNA methylation remains unclear. Some reports indicate the role of inflammatory cytokines.19 Our report, along with others, demonstrat-ed that the greatest risk factor in the development of IR is body mass index (BMI).20,21 Accordingly, the effect
of obesity on DNA methylation and its influence on in-sulin sensitivity was investigated in the present study.
Material and methods
The research protocols were approved by the ethical review board of Wroclaw Medical University, Poland (ap-proval No. KB-556/2008).
Population characterization
All participants were informed about the purposes of the study and all subjects gave written consent for their participation in the study. The T2D patients were selected based on a diagnosis of T2D. Additionally, fasting glucose and insulin level, BMI, IR ratios (homeostatic model as-sessment of insulin resistance (HOMA-IR) or quantita-tive insulin sensitivity check index (QUICKI)), and lipid metabolism were assessed. Type 2 diabetic patients being treated with insulin were excluded. Lymphocytes (L) were collected from whole blood obtained from 13 types 2 dia-betic patients (8 men and 5 women). The type 2 diadia-betic patients were inpatients of the Department of Angiology, Hypertension, and Diabetology, Wroclaw Medical Uni-versity. Control lymphocytes were obtained from healthy subjects (11 men and 10 women) of similar age based on a fasting glucose level below 100 mg/dL, the absence of diabetes in family history, and, for women, no history of gestational diabetes.
Visceral adipose tissue biopsies were collected during abdominal surgeries from 9 patients with T2D (3 men and 6 women) and from 26 controls (17 men and 9 women) of similar age. Adipose tissue donors were inpatients of the First Department and Clinic of General, Gastroenter-ological, and Endocrinological Surgery, Wroclaw Medical University, and of the 1st Department and Clinic of Gynae-cology and Obstetrics, Wroclaw Medical University. Con-trols were selected from patients without T2D undergoing abdominal surgery, based on a fasting glucose level below 100 mg/dL, the absence of diabetes in family history, and, for women, no history of gestational diabetes. The aims of abdominal surgeries were mainly cholecystectomy, surgi-cal repair of an abdominal hernia, or gastric surgery.
Additional excluding criteria for all subjects were as fol-lows: other systemic diseases such as sclerosis, thyroid dysfunction, hepatitis, chronic inflammatory or infective diseases, neurological diseases, and tumors. Heavy drink-ers or those with a positive history were also excluded.
Body mass index and insulin
resistance ratios
obesity as BMI > 30 kg/m2. Insulin resistance rate was as-sessed using IR ratios calculated as follows22:
1) HOMA-IR [(glucose [mmol/L] * insulin [µU/mL])/22.5], 2) QUICKI [1/(log glucose [mg/dL] + log insulin [µU/mL])]. Insulin resistance was diagnosed on the basis of HOMA-IR > 2.5 and QUICKI < 0.321.
Lymphocyte preparation and visceral
adipose tissue biopsy collection
Lymphocytes were isolated from whole blood collected on anticoagulant using centrifugation on Grandison L (AquaLab, Warszawa, Poland). Five milliliters of the whole blood was placed on 2 mL of Grandison L and centrifuged at 2,000 rpm for 20 min at 4°C. The lymphocytes ring was collected and washed twice with phosphate-buffered saline (PBS); the red blood cells were removed using a lysis buffer (HH4Cl, KHCO3, EDTA-Na2). Lymphocytes were suspended in PBS and centrifuged at maximum speed for 2 min at 4°C; PBS was discarded and the pellet was frozen at –80°C pending analysis.
Visceral adipose tissue biopsies taken from patients undergoing abdominal surgery were immediately placed in RNALater (Ambion), incubated at 4°C for 24 h. The RNALater was discarded and the adipose tissue bi-opsies froze at –80°C pending analysis.
RNA extraction and gene
expression study
RNA was isolated from peripheral lymphocytes us-ing a mirVana miRNA Isolation Kit (Ambion, Carlsbad, USA) according to the manufacturers’ protocol for to-tal RNA. RNA from VAT biopsies was isolated using TriPure Isolation Reagent (Roche, Basel, Switzerland)
according to the manufacturers’ protocol. The tissues were homogenized using 2.0 mm zirconia beads (BioSpec Products, Inc., Bartlesville, USA). Following homogeniza-tion, the tissues were centrifuged at maximum speed for 2 min at 4°C in order to collect the fatty deposit at the top of the tube, which was then discarded. The homogenate was extracted with 200 μL of chloroform and centri-fuged for 15 min at maximum speed at 4°C. The aque-ous phase was collected and the RNA precipitated with 500 μL of isopropanol, centrifuged for 10 min at maxi-mum speed, and washed with 1 mL of 70% ethanol. The RNA pellet was dissolved in RNase-Free Water and stored at ‒80°C.
Reverse transcription was performed with the use of a High-Capacity cDNA Reverse Transcription Kit (Ap-plied Biosystems, Foster City, USA). INSR, PIK3R1, and SLC2A4 gene expression levels were analyzed with real-time polymerase chain reaction (RT-PCR) with the use of TaqMan Gene Expression Assays (Applied Biosystems) and Real-Time PCR Universal Master Mix (Applied Biosys-tems). The following TaqMan Gene Expression Assays were used: INSR, Hs00961557_m1; PIK3R1, Hs00381459_m1; SLC2A4, Hs00168966_m1; β-actin, Hs00181698_m1.
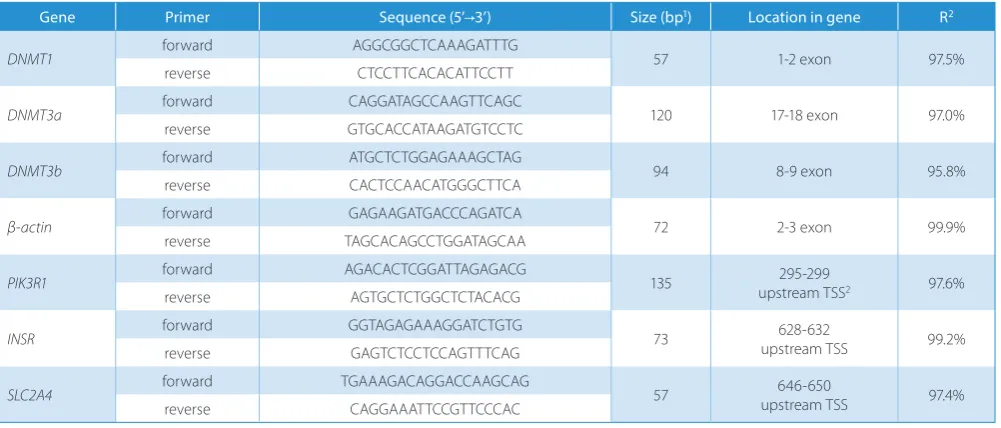
The DNA methyltransferase (DNMT1, DNMT3a, and DNMT3b) expression rate was assessed via Real-Time PCR using a SensiFast SYBR Hi-ROX Kit (Bioline, London, UK). Primers were designed manually to span the exon-exon junction; specificity was checked using Primer-BLAST (NCBI); the secondary structures were analyzed using OligoAnalyzer 3.1 (IDT, Coralville, USA). Prior to Real-Time PCR, the efficiency of primers was analyzed using the standard curve method; specificity was checked based on the denaturation curve. The primer sequences used
for measurements of DNMT expression are presented
in Table 1.
Table 1. Primers sequences used for gene expression analysis (DNMTs) and promoters methylation analysis (insulin pathway genes)
Gene Primer Sequence (5’→3’) Size (bp1) Location in gene R2
DNMT1 forward AGGCGGCTCAAAGATTTG 57 1-2 exon 97.5%
reverse CTCCTTCACACATTCCTT
DNMT3a forward CAGGATAGCCAAGTTCAGC 120 17-18 exon 97.0%
reverse GTGCACCATAAGATGTCCTC
DNMT3b forward ATGCTCTGGAGAAAGCTAG 94 8-9 exon 95.8%
reverse CACTCCAACATGGGCTTCA
β-actin forward GAGAAGATGACCCAGATCA 72 2-3 exon 99.9%
reverse TAGCACAGCCTGGATAGCAA
PIK3R1 forward AGACACTCGGATTAGAGACG 135 upstream TSS295-299 2 97.6%
reverse AGTGCTCTGGCTCTACACG
INSR forward GGTAGAGAAAGGATCTGTG 73 upstream TSS628-632 99.2%
reverse GAGTCTCCTCCAGTTTCAG
SLC2A4 forward TGAAAGACAGGACCAAGCAG 57 upstream TSS646-650 97.4%
reverse CAGGAAATTCCGTTCCCAC
DNA extraction and global
and site-specific DNA methylation
The VAT was dissected and digested with Collagenase A (Roche) overnight at 37°C. DNA was then extracted with the use of a High Pure PCR Template Preparation Kit (Roche). DNA from lymphocytes was extracted using the same kit. The DNA concentration was assessed using NanoDrop ND1000 (Thermo Fisher Scientific, Waltham, USA).
Global DNA methylation in VAT and lymphocytes was measured using an EpiJET DNA Methylation Analysis Kit (Thermo Fisher Scientific) according to the manufactur-ers’ protocol. Briefly, genomic DNA (500 ng from VAT and 200 ng from lymphocytes) was digested with 2 restric-tion enzymes: HpaII and MspI. Both enzymes recognized the same DNA sequence (5′-CCGG-3′); however, when the internal C within the recognized sequence was methyl-ated, cleavage with HpaII was blocked, although unaffected with MspI. After digestion, the DNA treated with HpaII, MspI, and non-digested DNA was separated using 1.2% agarose gel stained with ethidium bromide. The bands of DNA digested with HpaII and non-digested DNA were analyzed using ImageJ (National Institutes of Health, Bethesda, USA). Global methylation was calculated as a percentage of non-digested DNA. Site-specific DNA methylation was analyzed using an EpiJET DNA Meth-ylation Analysis Kit (Thermo Scientific). Real-time PCR was run following the digestion of enzymes using a Sensi-Fast SYBR Hi-ROX Kit (Bioline). Primers were designed manually to hybridize within promoters of investigated genes flanking the recognition sequence (5′-CCGG-3′). Designed primers were analyzed according to specificity (Primer-BLAST, NCBI) and secondary structure forma-tion (OligoAnalyzer 3.1; IDT). A CpG islands predicforma-tion was done using MethPrimer with CG content > 60% and an Obs/Exp ratio > 0.6. Ct values were used to calculate the promoter methylation rate using the formula
% of 5 – mC = 100/(1+E)Cq2‒Cq1
[E – PCR efficiency; Cq1 – threshold cycle of undigested DNA; Cq2 – threshold cycle of HpaII-digested DNA]
The sequences of primers used for promoters methyla-tion analysis are presented in Table 1.
Cytokine levels measurements
Two inflammatory cytokine levels were measured in the plasma of the investigated subjects using commer-cial enzyme-linked immunosorbent assay (ELISA) kits: the PeliKine human IL-6 ELISA and PeliKine human TNF-alpha ELISA Kits (Sanquin, Amsterdam, the Netherlands).
Statistical analyses
Statistical analyses were performed with the use of STA-TISTICA (StatSoft, Inc., Tulsa, USA). Statistical significance
was set at p < 0.05. Differences between the clinical fea-tures of tested groups were assessed using Student’s t-test. Correlation between gene expression level and biochemical parameters was done using Pearson’s coefficient of correla-tion. The power of the study was assessed using STATIS-TICA. The gene expression level was analyzed as relative gene expression normalized to β-actin using the ∆∆Ct quantification model.23
Results
Characterization of study groups
The characterization of enrolled patients was carried out according to the type of biological material (patients from whom lymphocytes or adipose tissues samples were collected). Type 2 diabetic patients in both analyses were characterized by increased BMI and glucose and insu-lin levels, as well as by IR resistance ratios (HOMA-IR and QUICKI). Moreover, an increase in adiponectin and HDL levels were observed in control patients. However, when dividing enrolled patients according to BMI as lean (<25 kg/m2) or obese (≥25 kg/m2), in addition to the above changes, increased TG and IL-6 levels were observed, while HDL and adiponectin levels were decreased in obese sub-jects. A detailed characterization of the study cohort is pre-sented in Table 2.
Global DNA methylation
Global DNA methylation was measured in the L and VAT of healthy subjects and T2D patients over a wide range of BMI. Global DNA methylation was increased in both types of tissue in T2D patients (VAT, p = 0.1940; L, p = 0.0297; Fig. 1A and 1F, respectively). The increase in VAT was not statistically significant. However, when categoriz-ing enrolled subjects accordcategoriz-ing to BMI (lean <25 kg/m2, or overweight and obese ≥25 kg/m2), a greater difference in global DNA methylation was observed (VAT, p = 0.0026; L, p = 0.0001; Fig. 1B and 1G, respectively), with higher global DNA methylation in overweight and obese subjects. What is more, a strong positive correlation was observed between global DNA methylation values measured in both types of tissue and BMI (VAT, R = 0.53, p = 0.0143; L, R = 0.54, p = 0.0122; Fig. 1C and 1H, respectively). These results suggest the strong influence of BMI on global DNA methylation.
a negative correlation was observed between global DNA methylation and QUICKI measured in VAT (R = ‒0.41, p = 0.0475, Fig. 1E) and in L (R = ‒0.51, p = 0.0191, Fig. 1J).
DNA methyltransferase expression
Faced with differentially methylated DNA within the in-vestigated groups, the expression rate of 3 main DNA methyltransferases was analyzed in both types of tissue
in order to determine which DNA methyltransferase is re-sponsible for various profiles of global DNA methylation. In both types of tissue, DNMT3a was upregulated in obese T2D patients compared to controls, with no differences in the expression rate of the other 2 methyltransferases,
DNMT1 and DNMT3b. In VAT the expression rate of
DMNT3a was 1.92 times higher (p = 0.0204) in T2D pa-tients compared to controls (Fig. 2A). In L the expres-sion rate of DNMT3a was 1.59 times higher (p = 0.0052)
Table 2. Characterization of clinical and biochemical features enrolled between (A – visceral adipose tissue; B – lymphocytes)
A
Biochemical feature Control group(mean ±SD) (mean ±SD)T2DM p-value(t-test) Lean (<25 kg/m(mean ±SD) 2) (≥25 kg/mObese 2)
(mean ±SD)
p-value (t-test)
Sex [F/M]1 9/17 6/3 – 6/8 9/12 –
Age [years] 47 ±15 52 ±10 NS 47 ±17 51 ±10 NS
BMI [kg/m2] 24.4 ±5.1 31.8 ±6.2 0.0012 22.5 ±2.4 30.2 ±3.4 <0.0000
Glucose [mg/dL] 95 ±14 146 ±33 <0.0001 105 ±31 122 ±64 NS
Insulin [uU/mL] 7.2 ±8 25.7 ±22 0.0295 10 ±19 42.5 ±27 0.0368
CHOL [mg/dL] 173 ±38 169 ±81 NS 209 ±22 222 ±32 NS
TG [mg/dL] 160 ±48 174 ±59 NS 104 ±50 228 ±103 0.0126
LDL [mg/dL] 120 ±33 81 ±40 NS 122 ±14 146 ±30 NS
HDL [mg/dL] 46 ±11 41 ±11 NS 62.5 ±26 43.3 ±12 0.0382
HOMA-IR 1.6 ±1.8 8.9 ±11.7 0.0236 1.03 ±1 5.05 ±7 0.0500
QIUCKI 0.382 ±0.04 0.318 ±0.03 0.0019 0.399 ±0.04 0.336 ±0.05 0.0029
IL-6 [pg/uL] 18.18 ±10.5 22.23 ±16 NS 19.9 ±6.7 29.5 ±27 0.0426
TNF-α [pg/uL] 2.5 ±0.67 1.7 ±1.15 NS 2.4 ±0.8 2.11 ±0.99 NS
Adiponectin [pg/uL] 16.5 ±7.3 11.5 ±6.9 0.0299 16.2 ±5.3 10.5 ±3.6 0.0276
B
Biochemical feature Control group(mean ±SD) (mean ±SD)T2DM p-value(t-test) Lean (<25 kg/m(mean ±SD) 2) (≥25 kg/mObese 2)
(mean ±SD)
p-value (t-test)
Sex [F/M] 10/11 5/8 – 6/5 11/12 –
Age [years] 50 ±7 50 ±6 NS 46 ±3.7 51 ±6.8 NS
BMI [kg/m2] 27.6 ±3.8 31.7 ±3.4 0.0261 23 ±1.1 31 ±3.2 0.0008
Glucose [mg/dL] 89 ±7.9 182 ±70 0.0019 92 ±6.8 151 ±72 NS
Insulin [uU/mL] 4.0 ±0.8 8.2 ±2.3 0.0009 5.3 ±2.8 6,22 ±3.15 NS
CHOL [mg/dL] 200 ±38 190 ±49 NS 214 ±62 222 ±112 NS
TG [mg/dL] 111 ±45 202 ±130 NS 65 ±35 175 ±112 NS
LDL [mg/dL] 143 ±42 120 ±54 NS 114 ±57 135 ±48 NS
HDL [mg/dL] 68 ±18 43 ±7 0.0009 86 ±12 49 ±13 0.0003
HOMA-IR 1.3 ±1.4 3.6 ±1.3 0.0012 1.9 ±1.99 2.5 ±1.82 NS
QIUCKI 0.395 ±0.04 0.318 ±0.01 <0.0000 0.372 ±0.04 0.346 ±0.05 NS
IL-6 [pg/uL] 16.2 ±5.6 22.2 ±3.1 NS 8.0 ±1.6 16.1 ±3.1 NS
TNF-α [pg/uL] 2.8 ±0.35 3.6 ±0.6 NS 2.7 ±0.3 2.7 ±0.6 NS
Adiponectin [pg/uL] 11.4 ±5 11.5 ±4.9 NS 13.9 ±9.4 12.8 ±3.8 NS
in T2D patients compared to controls (Fig. 2B), again with no changes detected in the gene expression of the other 2 DNA methyltransferases. Moreover, DNMT3a showed a positive correlation with BMI within investigated indi-viduals in both types of tissue (VAT, R = 0.62, p = 0.0041, Fig. 2A; L, R = 0.47, p = 0.0406, Fig. 2B). Furthermore, the DNMT3a expression rate correlated positively with global DNA methylation in VAT (R = 0.65, p = 0.0022, Fig. 2C); however, a relatively weak positive correlation was observed in L.
In order to evaluate the influence of increased DNMT3a on insulin sensitivity, we investigated the correlation the mRNA level of DNMT3a measured in both VAT and L with IR ratios. The mRNA level of DNMT3a correlated positively with HOMA-IR (VAT, R = 0.59; L, R = 0.52) and negatively with QUICKI (VAT, R = ‒0.48; L, R = ‒0.46); however, correlations were close to being significant with the p-value slightly exceeding the limit value of 0.05. No correlation between IR ratios and other DNMTs were observed.
These results link obesity with overexpression of DNMT3a as a possible reason for global DNA hypermethylation in obesity and a possible reason for IR development.
Insulin pathway gene expression
and promoter methylation
Global DNA methylation was shown to strongly corre-late with IR in both types of tissues; accordingly, the gene expression rate and promoter methylation status of 3 main genes belonging to the insulin signaling pathway were investigated, namely the INSR (insulin receptor),
Fig. 2. The expression rate of DNMT3a methyltransferase
The expression of DNMT3a gene in VAT (A) and in L (B) of enrolled patients and its correlation with BMI. Correlation between expression of DNMT3a
gene and global DNA methylation observed in VAT (C).
Fig. 1. Effect of global DNA methylation on insulin sensitivity
Comparison of global DNA methylation in VAT (A and B) and in L (F and G) between T2D and controls and between lean and obese patients. Correlation between global DNA methylation in VAT and BMI (C), HOMA-IR (D) and QUICKI (E); global DNA methylation in L and BMI (H), HOMA-IR (I) and QUICKI (J).
C
A B C D E
F G H I J
% DNA meth
ylation
% DNA meth
ylation
% DNA meth
ylation
% DNA meth
ylation
% DNA meth
ylation
% DNA meth
ylation
% DNA meth
ylation
global DNA meth
ylation [%]
global DNA meth
ylation [%]
global DNA meth
ylation [%]
T2DM lean obese C
R = 0.53
p = 0.0143 R = 0.61
p = 0.0048 R = –0.41p = 0.0475
R = 0.54
p = 0.0122 R = 0.51
p = 0.0183 R = –0.51p = 0.0191 35 30 25 20 15 10 5 0 60 50 40 30 20 10 0 60 50 40 30 20 10 0 60 50 40 30 20 10 0 60 50 40 30 20 10 0 60 50 40 30 20 10 0 60 50 40 30 20 10 0 70 60 50 40 30 20 10 0 80 70 60 50 40 30 20 10 60 50 40 30 20 10 0 T2DM lean obese
10 0 0.3 0.35 0.40
QUICKI HOMA-IR
BMI [kg/m2]
QUICKI HOMA-IR
BMI [kg/m2]
0.45 0.5 2 4 6 8 10 12
20 30 40
10 20 30 40 50 0 20 40 0.2 0.4 0.6
C A
B
C
DNMT3a gene expression
DNMT3a gene expression
DNMT3a gene expression
DNMT3a
gene expr
ession
(normalized to β-ac
tin)
DNMT3a
gene expr
ession
(normalized to β-ac
tin)
global DNA meth
ylation [%] BMI [kg/m 2] BMI [kg/m 2] 2.5 2 1.5 1 0.5 0 2.5 2 1.5 1 0.5 0 45 40 35 30 25 20 15 40 35 30 25 20 15 50 40 30 20 10 0
T2D 0 0.02 0.04
0 0.02 0.04
C
R = 0.62 p = 0.041
R = 0.47 p = 0.0406
R = 0.65 p = 0.0022
PIK3R1 (phosphoinositide-3-kinase regulatory subunit 1), and SLC2A4 genes (solute carrier family 2, facilitated glucose transporter, member 4). First, the gene expres-sion rate was analyzed in both the L and VAT of the en-rolled individuals. There was no difference in the ex-pression rate of analyzed genes in L between the studied groups. SLC2A4 gene expression was slightly reduced and PIK3R1 gene expression slightly increased in T2D patients, though without statistical significance. Nor were there any statistically significant differences in promoter methylation between study groups of analyzed genes in L, although the global DNA methylation rate in L was in-creased in T2D patients.
All 3 examined genes displayed a reduced expression rate in the VAT of T2D patients when compared to control subjects.
The INSR gene was downregulated in the VAT of T2D patients (p = 0.0355, Fig. 3A); on the other hand, the pro-moter methylation rate of this gene was increased (p = 0.0206). What is more, the promoter methylation rate negatively correlated with INSR gene expression (R = ‒0.39, p = 0.0591, Fig. 3A); however without sta-tistical significance. An interesting positive correlation was observed between INSR promoter methylation and the BMI of the investigated subjects (R = 0.45, p = 0.05, Fig. 3A). Subjects with BMIs under 30 kg/m2 were char-acterized by a relatively low INSR promoter methylation rate, as opposed to subjects with BMIs over 30 kg/m2, characterized by a significantly increased INSR promoter methylation rate. Furthermore, INSR promoter methyla-tion correlated with IR in investigated individuals. A posi-tive correlation between the methylation of INSR pro-moter and HOMA-IR (R = 0.48, p = 0.0386, Fig. 3A) and a negative correlation between the methylation of INSR
promoter and QUICKI (R = –0.46, p = 0.0483, Fig. 3A) were observed.
The PIK3R1 gene also showed decreased expression rate in T2D patients when compared to healthy individuals (p = 0.0199), along with a slightly increased rate of PIK3R1 promoter methylation measured in this group (p = 0.0581). However, no correlation was observed between PIK3R1 promoter methylation and gene expression, BMI or IR.
The SLC2A4 gene encoding glucose transporter type 4 (GLUT4) was downregulated (p = 0.0569, Fig. 3B) and SLC2A4 promoter methylation upregulated (p = 0.0158) in the VAT of T2D patients compared to controls. Fur-thermore, the expression rate was negatively correlated with promoter methylation (R = ‒0.46, p = 0.0460, Fig. 3B). Interestingly, the promoter methylation of the SLC2A4 gene positively correlated with BMI within investigated individuals (R = 0.55, p = 0.012, Fig. 3B). What is more, SLC2A4 promoter methylation displayed a positive cor-relation with HOMA-IR (R = 0.58, p = 0.0082, Fig. 3B) and a negative correlation with QUICKI (R = ‒0.67, p = 0.0012, Fig. 3B) in investigated subjects.
Discussion
In the present study, we investigated the influence of obesity on IR development through epigenetic mecha-nisms. We have shown that global DNA methylation in-creased in cases of obesity and correlated positively with IR. It was found that in obese individuals the expression of DNMT3a was increased, which could be the reason for the subsequent increase in global and site-specific DNA methylation, including promoters of main genes belonging to the insulin pathway (INSR, SLC2A4).
Fig. 3. Promoter methylation of insulin pathway genes
The differences in expression and methylation profile of promoters of 2 genes belonging to insulin signaling pathway: INSR gene (A) ad SLC2A4 gene (B) in VAT along with correlation of promoter methylation with gene expression, BMI and IR.
1.8 1.6 1.4 1.2 1 0.8 0.6 0.4 0.2 0 7 6 5 4 3 2 1 0 0.7 0.6 0.5 0.4 0.3 0.2 0.1 0 14 12 10 8 6 4 2 0 3.5 3 2.5 2 1.5 1 0.5 0 2.5 2 1.5 1 0.5 0 45 40 35 30 25 20 15 10 45 40 35 30 25 20 15 10 30 25 20 15 10 5 0 30 25 20 15 10 5 0 0.5 0.45 0.4 0.35 0.3 0.25 0.2 0.5 0.45 0.4 0.35 0.3 0.25 0.2 0.15 C T2DM
C T2DM C T2DM
C T2DM 0
0 0.2 0.4
SLC2A4 promoter methylation
INSR promoter methylation
IN SR promo te r met hy lation SL C2 A4 promo te r met hy lation SL C2 A4 gene expressio n (normalized t o β -ac tin ) IN SR gene expressio n (normalized t o β -ac tin ) QUICKI HOMA -IR BMI [ kg /m 2] QUICKI HOMA -IR BMI [ kg /m 2] SL C2 A4 expressio n (normalized t o β -ac tin ) IN SR gene expressio n (normalized t o β -ac tin )
INSR promoter methylation INSR promoter methylation INSR promoter methylation
SLC2A4 promoter methylation SLC2A4 promoter methylation SLC2A4 promoter methylation
0.6 0.8 1 0 0.2 0.4 0.6 0.8 1 0 0.2 0.4 0.6 0.8 1 0 0.2 0.4 0.6 0.8 1
0 0.25 0.5 0.75 1 0 0.25 0.5 0.75 1 0 0.25 0.5 0.75 1
0.5 R = –0.39 p = 0.0591 A
B
R = –0.46
p = 0.0460 R = 0.55p = 0.0120 R = 0.58p = 0.0082 R = –0.67p = 0.0012
R = 0.45
p = 0.0501 R = 0.48p = 0.0386 R = –0.46p = 0.0483
The global DNA methylation rate is tissue-specific; therefore, 2 different types of tissue were investigated in the present study in order to better assess their asso-ciation with obesity and IR. Peripheral lymphocytes have been widely studied by many researchers, with various outcomes. In some studies, there was no association be-tween BMI and global DNA methylation24‒26, while others showed results contradictory to ours, in which global DNA methylation negatively correlated with BMI.27 In the pres-ent study, we showed increased global DNA methylation in the lymphocytes of obese individuals, which corre-sponds to other studies.28,29 What is more, global DNA methylation measured in lymphocytes showed associations with IR (assessed based on HOMA-IR and QUICKI). Simi-lar results were obtained by others who showed a positive association between global DNA methylation and fasting glucose levels30,31 or HOMA-IR32 in those cells. Although a positive correlation between global DNA methylation and IR has been shown in the present study, no signifi-cant changes, either in gene expression or in the promoter methylation profile of insulin pathway genes, were ob-served. Further research needs to be done in order to draw specific conclusions, especially on a larger number of in-vestigated subjects. It is also possible that different pat-terns of DNA methylation in insulin-resistant subjects influence other pathways or genes important for proper lymphocytes metabolisms, like cytokine or inflammatory markers secretion, which might as well influence insulin sensitivity. Indeed, an inverse relationship between meth-ylation of leptin and adiponectin promoters in peripheral blood samples and IR was observed by García-Cardona et al.33 Similarly, a GWAS study performed by Su et al.34 also showed a correlation between the methylation status of the lymphocyte antigen 86 (LY86) gene and obesity, IR, and inflammatory markers, which provides further evidence of the influence of epigenetic regulation on IR and obesity-related disorders.
Peripheral blood lymphocytes constitute relatively good study material with respect to their easy collection and isolation methods; however, the proper cells for the evalua-tion of IR are adipocytes or skeletal muscles, because these tissues utilize the greatest amount of glucose provided along with food in an insulin-dependent manner. There-fore, global DNA methylation and associations with IR were investigated in VAT samples collected from patients undergoing abdominal surgery. Similarly to lymphocytes, positive associations between DNA methylation, BMI and IR were shown. We have shown that, in both types of inves-tigated tissue, global DNA methylation differed between lean and obese subjects, despite a relatively low number of investigated subjects. Furthermore, we observed a posi-tive association between global DNA methylation and IR among enrolled subjects. The implication of epigenetic regulation in IR pathogenesis was also confirmed when analyzing the DNMT3a expression rate within enrolled individuals. DNMT3a correlated positively with BMI and
IR ratios. The correlation with IR ratios (HOMA-IR and QUICKI) did not reach significance; however, the overall relationship was noticed. For sure, by increasing the num-ber of investigated subjects we would obtain statistical significance.
Taking everything together, obesity influences glob-al DNA methylation level in VAT and in lymphocytes by stimulating the expression rate of DNA methyltrans-ferases, mainly DNMT3a. We have concluded that if there is a positive correlation between DNA methylation and IR, some insulin pathway genes must be epigenetically regu-lated by promoter methylation. Indeed, 2 of the 3 inves-tigated genes were shown to be differentially methylated at the promoter sites; moreover, the methylation status correlated positively with BMI and IR ratios and negatively with gene expression. Other researchers, such as Barajas-Olmos et al.,35 provided further evidence that an altered DNA methylation rate of numerous genes (mainly glucose metabolism, lipid metabolism and cell-cycle regulation genes) is a mechanism that may be involved in the patho-genesis of obesity-related disorders, including T2D.
To the best of the author’s knowledge, there are only a few reports concerning the epigenetic regulation of insu-lin pathway genes. Jones et al.36 demonstrated a decreased INSR expression rate in the subcutaneous adipose tis-sue of women with the influence of obesity, not of PCOS, on the expression of the INSR gene. The IRS1 and SLC2A4 genes exhibited a decreased expression rate, which corre-lated with an increase in promoter methylation in the skel-etal muscle of adult rats which had been undernourished during the fetal stage.37 The greatest difference in gene expression and promoter methylation of both genes was seen in the 20th week of postnatal life, which correlated with increased body weight and IR in those rats.
The relationship between DNA methylation and IR has been shown by other researchers, who described promoter methylation of other genes regulating IR, such as the adi-ponectin19, leptin and PPARγ genes, etc.11‒13 The potential mechanism regulating the methylation status of the adipo-nectin gene was related to increased expression of DNMT1, stimulated by TNF-α.19 In our study, we have shown altered expression of DNMT3a in both types of tissues, as the po-tential reason for differently methylated global and site-specific DNA methylation, especially insulin signaling pathway genes. DNMT3a was previously implicated with obesity-induced IR development, as Dnmt3a knock-out mice are protected from diet-induced IR.38 Our results confirm the implication of DNMT3a with epigenetic regu-lation of IR in humans. There was no association between 2 other DNA methyltransferases (DNMT1 and DNMT3b) and insulin resistance; therefore, DNMT3a was selectively shown to play a key role in obesity-related IR pathogenesis.
ORCID iDs
Małgorzata Małodobra-Mazur https://orcid.org/0000-0002-9864-5928 Aneta Alama https://orcid.org/0000-0001-8428-1089
Dorota Bednarska-Chabowska https://orcid.org/0000-0002-8920-7571 Dorota Pawelka https://orcid.org/0000-0003-2077-7629
Aneta Myszczyszyn https://orcid.org/0000-0003-3138-7554 Tadeusz Dobosz https://orcid.org/0000-0003-0413-9109
References
1. Nguyen DM, El-Serag HB. The epidemiology of obesity. Gastroen-terol Clin North Am. 2010;39(1):1–7.
2. Brady MJ, Saltiel AR. Closing in on the cause of insulin resistance and type 2 diabetes. J Clin Invest 1999;104(6):675–676.
3. Drong AW, Lindgren CM, McCarthy MI. The genetic and epigenetic basis of type 2 diabetes and obesity. Clin Pharmacol Ther. 2012;92(6): 234–237.
4. Hamilton JP. Epigenetics: Principles and practice. Dig Dis. 2011;29(2): 130–135.
5. Londono Gentile T, Lu C, Lodato PM, et al. DNMT1 is regulated by ATP-citrate lyase and maintains methylation patterns during adipocyte differentiation. Mol Cell Biol. 2013;33(19):3864–3878.
6. Deaton AM, Bird A. CpG islands and the regulation of transcription.
Genes Dev. 2011;25(10):1010–1022.
7. Zhang Q, Ramlee MK, Brunmeir R, Villanueva CJ, Halperin D, Xu F. Dynamic and distinct histone modifications modulate the expression of key adipogenesis regulatory genes. Cell Cycle. 2012;11(23):4310–4322. 8. Anamika K, Krebs AR, Thompson J, Poch O, Devys D, Tora L. Lessons
from genome-wide studies: An integrated definition of the coacti-vator function of histone acetyl transferases. Epigenetics Chromatin. 2010;3(1):18–28.
9. Riccio A. New endogenous regulators of class I histone deacetylases.
Sci Signal. 2010;3(103):pe1. doi:10.1126/scisignal.3103pe1
10. Gregoretti IV, Lee YM, Goodson HV. Molecular evolution of the his-tone deacetylase family: Functional implications of phylogenetic analysis. J Mol Biol. 2004;338(1):17–31.
11. Pietiläinen KH, Ismail K, Järvinen E, et al. DNA methylation and gene expression patterns in adipose tissue differ significantly within young adult monozygotic BMI-discordant twin pairs. Int J Obes (Lond).
2016;40(4):654–661.
12. Arner P, Sinha I, Thorell A, Rydén M, Dahlman-Wright K, Dahlman I. The epigenetic signature of subcutaneous fat cells is linked to altered expression of genes implicated in lipid metabolism in obese women.
Clin Epigenetics. 2015;7:93.
13. Drogan D, Boeing H, Janke J, et al. Regional distribution of body fat in relation to DNA methylation within the LPL, ADIPOQ and PPARγ pro-moters in subcutaneous adipose tissue. Nutr Diabetes. 2015;5(7):e168. 14. Zheng LD, Linarelli LE, Liu L, et al. Insulin resistance is associated with epigenetic and genetic regulation of mitochondrial DNA in obese humans. Clin Epigenetics. 2015;7:60.
15. Benton MC, Johnstone A, Eccles D, et al. An analysis of DNA methyla-tion in human adipose tissue reveals differential modificamethyla-tion of obe-sity genes before and after gastric bypass and weight loss. Genome Biol. 2015;16:8.
16. Crujeiras AB, Diaz-Lagares A, Moreno-Navarrete JM, et al. Genome-wide DNA methylation pattern in visceral adipose tissue differen-tiates insulin-resistant from insulin-sensitive obese subjects. Transl Res. 2016;178:13–24.e5.
17. Vaquero A, Reinberg D. Calorie restriction and the exercise of chro-matin. Genes Dev. 2009;23(16):1849–1869.
18. Wheatley KE, Nogueira LM, Perkins SN, Hursting SD. Differential effects of calorie restriction and exercise on the adipose transcrip-tome in diet-induced obese mice. J Obes. 2011;2011:265417.
19. Kim AY, Park YJ, Pan X, et al. Obesity-induced DNA hypermethylation of the adiponectin gene mediates insulin resistance. Nat Commun. 2015;3:585.
20. Malodobra M, Pilecka A, Gworys B, Adamiec R. Single nucleotide polymorphisms within functional regions of genes implicated in insulin action and association with the insulin resistant phenotype.
Mol Cell Biochem. 2011;349(1–2):187–193.
21. Kelley DE, Thaete FL, Troost F, Huwe T, Goodpaster BH. Subdivision of subcutaneous abdominal adipose tissue and insulin resistance.
Am J Physiol Endocrinol Metab. 2000;278(5):941–948.
22. Ruano M, Silvestre V, Castro R, et al. HOMA, QUICKI and MFfm to mea-sure insulin resistance in morbid obesity. Obes Surg. 2006;16(5):549–553. 23. Pfaffl MW. A new mathematical model for relative quantification in
real-time RT-PCR. Nucleic Acids Res. 2001;29(9):2002–2007. 24. Zhang FF, Cardarelli R, Carroll J, et al. Significant differences in global
genomic DNA methylation by gender and race/ethnicity in periph-eral blood. Epigenetics. 2011;6(5):623–629.
25. Gomes MVM, Toffoli LV, Arruda DW, et al. Age-related changes in the global DNA methylation profile of leucocytes are linked to nutrition but are not associated with the MTHRF C677T genotype or to func-tional capacities. PLoS One. 2012;7(12):52570.
26. Ulrich CM, Toriola AT, Koepl LM, et al. Metabolic, hormonal and immu-nological association with global DNA methylation among post-menopausal women. Epigenetics. 2012;7(9):1020–1028.
27. Zhang F, Santell R, Wolff M. White blood cell global methylation and IL-6 promoter methylation in association with diet and lifestyle risk factors in a cancer-free population. Epigenetics. 2012;7(6):606–614. 28. Kim M, Long TI, Arakawa K, Wang R, Yu MC, Laird PW. DNA methyla-tion as a biomarker for cardiovascular disease risk. PLoS One. 2010; 5(3):9692.
29. Cash HL, McGarvey ST, Houseman EA, et al. Cardiovascular disease risk factors and DNA methylation at the LINE-1 repeat region in periph-eral blood from Samoan Islanders. Epigenetics. 2011;6(10):1257–1264. 30. Oggiioni C, Lara J, Wells JCK, Soroka K, Siervo M. Shifts in population dietary patterns and physical inactivity as determinants of global trends in the prevalence of diabetes: An ecological analysis. Nutr Metab Cardiovasc Des. 2014;24(10):1105–1111.
31. Uusitupa M. Gene-diet interaction in relation to the prevention of obesity and type 2 diabetes: Evidence from the Finnish Diabetes Prevention Study. Nutr Metab Cardiovasc Dis. 2005;15(3):225–233. 32. Bernstein BE, Stamatoyannopoulos JA, Costello JF, et al. The NIH
roadmap epigenomics mapping consortium. Nat Biotechnol. 2010; 28(10):1045–1048.
33. García-Cardona MC, Huang F, García-Vivas JM, et al. DNA methyl-ation of leptin and adiponectin promoters in children is reduced by the combined presence of obesity and insulin resistance. Int J Obes (Lond). 2014;38(11):1457–1465.
34. Su S, Zhu H, Xu X, et al. DNA methylation of the LY86 gene is asso-ciated with obesity, insulin resistance, and inflammation. Twin Res Hum Genet. 2014;17(3):183–191.
35. Barajas-Olmos F, Centeno-Cruz F, Zerrweck C, et al. Altered DNA methylation in liver and adipose tissues derived from individuals with obesity and type 2 diabetes. BMC Med Genet. 2018;19(1):28. 36. Jones MR, Brower MA, Xu N, et al. Systems genetics reveals
the func-tional context of PCOS loci and identifies genetic and molecular mech-anisms of disease heterogeneity. PLoS Genet. 2015;11(8):e1005455. 37. Liu HW, Mahmood S, Srinivasan M. Developmental programming
in skeletal muscle in response to overnourishment in the immedi-ate postnatal life in rats. J Nutr Biochem. 2013;24(11):1859–1869. 38. You D, Nilsson E, Tenen DE, et al. Dnmt3a is an epigenetic mediator