-55-
NEUTROPHIL GELATINASE–ASSOCIATED LIPOCALIN (NGAL) AS AN EARLY
BIOMARKER OF ACUTE KIDNEY INJURY IN HEPATIC PATIENTS
Yousef Ahmed Kadry1,Abd Allah Abd El Aziz Abd Allah1, Atef Abd El Aziz Abd El Hadi Ali1 and Hisham Mohammed Omar2.
1
Internal Medicine Department, Faculty of Medicine, Zagazig University, Egypt. 2
Clinical Pathology Department, Faculty of Medicine, Zagazig University, Egypt.
ABSTRACT
Background :Acute kidney injury(AKI) is common in cirrhosis but differential diagnosis remains a challenge. Serum creatinine (SCr) less sensitive in reflecting renal dysfunction in cirrhotic patients. Aim of the Work: to study the usefulness of NGAL as an early biomarker of AKI in cirrhotic patients. Subjects and Methods: 80 subjects included, classified into 3 groups: GroupΙ: 10 control subjects. Group Π (GpΠ): 40 compensated hepatic patients without AKI, further subdivided into four subcategories: (GpΠa1): 10 patients with HCV under interferon plus ribavirin therapy. (GpΠa2): 10 patients with HCV not under interferon or ribavirin therapy. (GpΠb): 10 patients with Bilharzial liver fibrosis. (GpΠc): 10 patients with combined HCV and Bilharzial liver fibrosis. Group Ш (GpШ): 30 decompensated hepatic patients with AKI, further subdivided into three subcategories: (Gp Шa): 10 patients with Acute tubular necrosis . (Gp Шb): 10 patients with hepatorenal syndrome . (Gp Шc): 10 patients with Pre-renal azotemia. All participants were subjected to the routine lab investigations in addition to specific lab test plasma NGAL (pNGAL).Results: No significant difference was found in kidney function parameters (SCr, urea, GFR) between patients with AKI and patients without AKI. However, patients with AKI had higher pNGAL compared to patients without AKI. There were significant difference among group III subcategories, patients with ATN had pNGAL levels markedly higher (mean 295 ng/ml) compared to those of patients with PRA (mean 86.5 ng/ml), Patients with HRS had intermediate values {mean 142 ng/ml}. In patients with ATN, pNGAL markedly rise within 3 hrs of kidney injury compared to SCr which rises after 24 hrs. Among GpΠ subcategories, no significant difference was found in either pNGAL or kidney function parameters. Conclusions: pNGAL is an early biomarker of AKI and it can also discriminate type of AKI in cirrhosis
Keywords: Acute kidney injury, Cirrhosis, Acute tubular necrosis, Hepatorenal syndrome, Pre-renal azotemi./
INTRODUCTION
cute kidney injury (AKI) is very common in patients with advanced cirrhosis; the most common causes are pre-renal azotemia (PRA) due to volume depletion, acute tubular necrosis (ATN) and hepatorenal syndrome (HRS), with prevalence rates of 68%, 33%, and 25% respectively. [1] Because renal dysfunction is directly linked to the mortality rate of cirrhotic patients, a precise assessment of renal function is required to estimate the prognosis and determine the correct therapeutic intervention and response. [2]
Serum creatinine (SCr) could not represent GFR in several conditions, especially in liver disease [3] as it is synthesized in the liver so any cause of hepatic parenchymal dysfunction will directly reduce creatine production. [4] Therefore, SCr may overestimate renal function in these patients and normal SCr level cannot exclude early renal dysfunction in patients with liver cirrhosis. [5] So we aimed in this work to study the usefulness of plasma Neutrophil gelatinase associated lipocalin (pNGAL) as an early biomarker
of tubular damage and in the differential diagnosis of impairment of kidney function in cirrhosis.
SUBJECTS AND METHODS
This study has been conducted in collaboration between the Hepatology outpatient clinic, Al Ahrar hospital, Zagazig, Ministry of Health and the Internal Medicine outpatient clinic and the Hepatology Intensive Care Unit, Faculty of Medicine, Zagazig university hospitals during the period from April 2011 to April 2013.
It included 70 hepatic patients: 40 without AKI and 30 with AKI, in addition to 10 healthy control subjects. Their ages ranged from 38 to 54 yrs old with mean ± SD 46.7 ±3.91 years and 47 of them are males and other 33 are females.
Inclusion criteria:
Patients who were diagnosed to have chronic liver disease were included in this study either with AKI or not.
Exclusion criteria:
Patient with infection especially urinary tract infection, hypertension, diabetes, cardiac, hematologic, immunologic, malignant diseases were excluded from this study.
-56-
Subjects were classified into 3 main groups:
Group Ι (control GpΙ): It included 10 healthy volunteer control subjects (7 male and 3 female), their age ranged from (38 -50) year, with X (mean) ± SD (standard deviation) = 44.9±3.35 year.
Group Π (GpΠ): compensated hepatic patients without AKI: It included 40 patients (22 male and 18 female), their age ranged from (40 – 53) year, with X± SD = 46.4±3.82 year. All of them had compensated liver disease {clinically (no ascites or oedema), laboratory (normal serum albumin and no coagulopathy) radiologically (no ascites or portal hypertension) and endoscopically (no varices) This group was further subdivided into four subcategories according to the cause of hepatic impairment:
(GpΠa1): Hepatic patients with HCV under interferon plus ribavirin therapy. They were evaluated before starting the drug and 3 months after starting it. It included 10 patients (6 male and 4 female), their age ranged from (42 – 52) year, with X±SD = 46.9±3.18 year.
(GpΠa2): Hepatic patients with HCV not under interferon or ribavirin therapy. It included 10 patients (5 male and 5 female), their age ranged from (42 – 52) year, with X±SD = 47.3±3.68 year. (GpΠb): Hepatic patients with Bilharzial liver fibrosis. It included 10 patients (7 male and 3 female), their age ranged from (40–52) year, with X±SD = 46.1±4.15 year.
(GpΠc):Hepatic patients with combined HCV and Bilharzial liver fibrosis. It included 10 patients (4 male and 6 female), their age ranged from (40 – 53) year, with X±SD = 44.3±4.45 year.
Group Ш (GpШ): Decompensated hepatic patients with AKI: It included 30 patients (18 male and 12 female), their age ranged from (42- 54) year, with X±SD = 47.7±4.01 year. All of them had decompensated liver disease {clinically (ascites and oedema), laboratory (low serum albumin and coagulopathy) radiologically (ascites and portal hypertension) and endoscopy (esophageal varices). This group was further subdivided into three subcategories according to the cause of kidney injury:
(Gp Шa): Acute tubular necrosis (ATN) OR intrinsic AKI (iAKI). It included 10 patients (6 male and 4 female), their age ranged from (42- 54) year, with X±SD = 49.3±4.14 year.
(Gp Шb): Hepatorenal syndrome (HRS). It included 10 patients suspected at 1st presentation and later on proved to have HRS. (7 male and 3
female), their age ranged from (42- 51) year, with X±SD = 47.7±3.34 year.
(Gp Шc):Pre-renal azotemia (PRA)due to volume depletion. It included 10 patients (5 male and 5 female), their age ranged from (42- 52) year, with X±SD = 46.2±4.29 year.
AKI is diagnosed according to the final consensus proposal of the Working Party that accept the definition of AKI in cirrhosis as an increase in serum creatinine of >50% from baseline or a rise in sCr of ≥ 0.3 mg/dl in <48 h.Type 1 HRS can be regarded as a specific form of AKI . Chronic kidney disease defined as GFR of < 60 ml/min for > 3 months calculated using MDRD 6 formula. HRS type 2 is a specific form of chronic kidney disease. [6]
All participants were subjected to the following:-
Full history taking and detailed clinical examination with particular consideration on symptoms and sings of AKI.
Routine laboratory investigations.
o Complete blood picture using sysmex S.F3000 automated analyzer.
o Liver function tests using Dimnsion E.S. chemical auto analyzer.
o Kidney function tests using Dimnsion E.S. chemical auto analyzer, itwas measured 2 times in (group Πa1); before starting Interferon and Ribavirin therapy and 3 months after. Also, measured 3 times in ATN (group Шa); basal (before AKI), after 3 hrs and after 24 hrs of AKI.
o Estimation of GFR using Modification of Diet in Renal Disease (MDRD) equation.
o Viral hepatitis markers: hepatits B surface Antigen (HBsAg) and hepatitis C antibodies(HCV Abs). HCV polymerase chain reaction (HCV- PCR) Quantitative
o Complete Urine analysis and (Urine Na in patients with AKI)
o Liver biopsy when available.
o Abdominal ultrasonography .
Specific laboratory investigations: Measurement of pNGAL by Enzyme linked immunosorbent assay
(ELISA). Using human lipocalin-2/NGAL
immunoassay, catalog number DLCN2,
-57-
in ATN (group Шa); basal (before AKI), after 3 hrs and 24 hrs of AKI.
RESULTS
1- Study of the demographic data among studied groups:
Table (1) shows the demographic data among the studied groups. The hepatic patients without AKI group comprised 18 women and 22 men while hepatic patients with AKI group comprised 12 women and 18 men, the sex distribution didn’t differ significantly between the two groups. The age rang in the group without AKI was (40-53) years while it was in the group with AKI (42-54), the mean age in the group without AKI was (46.4±3.82) while it was (47.7±4.01) in the group with AKI. The mean age didn’t differ significantly between the two groups.
2- Study of the biochemical parameters among the groups:
Table (2) shows comparison between the groups of the study as regards their biochemical parameters using analysis of variance (ANOVA test). High significant difference was found in ALT, AST, serum albumin, PT, PTT, INR, WBCs, HB and platelets between studied groups (P <0.0001). 3- Study of the kidney functions parameters among the groups:
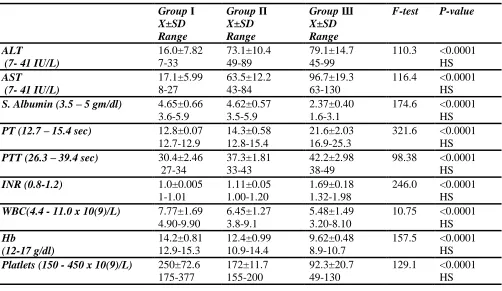
Table (3) shows there was high significant difference in pNGAL means among the studied groups, patients with AKI (GpШ) had higher pNGAL compared to patients without AKI (GpΙ
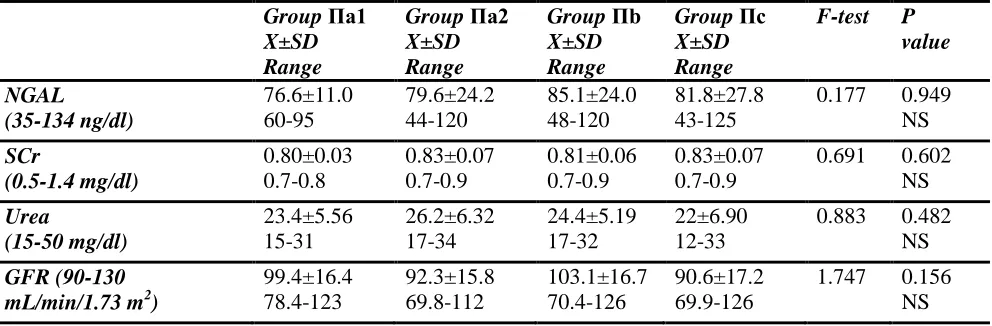
and GpΠ) P <0.0001. There was no significant difference in either SCr or blood urea or GFR meansamong the studied groups (P < 0.05). Table (4) shows no statistical significant difference among GpΠ subcategories as regarding pNGAL, sCr, blood urea and GFR. (P < 0.05).
Table (5) shows comparison between (X±SD) of values among group Πa patients before taking interferon plus ribavirin therapy and 3 months after the therapy using paired t test. High significant difference was found in AST, AST, WBCs, HB, platelets (P <0.0001). No significant difference was found in pNGAL, SCr, blood urea , GFR and S.albumin. (P < 0.05).
Table (6) shows high significant difference in pNGAL means among subcategories of GpШ (P <0.0001), patients with ATN (GpШa) had highest NGAL means (295±19.08), patients with HRS
(GpШb) had intermediate NGAL means
(142±48.5), patients with PRA (GpШc) had lowest NGAL means (86.5±11.22). On the other hand, there was no statistical significant difference among GpШ subcategories as regarding SCr, blood urea and GFR. (P < 0.05).
Table (7) shows time-course of pNGAL and kidney function parameters in patients with ATN (GpШa). There was significant difference along the time course of NGAL (after 3 hours of AKI), sCr, blood urea and GFR (after 24 hours of AKI).
Table (8) shows comparison between the basal and 3 hours values of NGAL and kidney function parameters in patients with ATN (GpШa) using paired t test. There was high statistical significant increase in pNGAL(P >0.0001),while there was no significant increase in sCr, blood urea and GFR in those patients (P < 0.05).
Table (9) shows comparison between the basal and 24 hours values of NGAL and kidney function parameters in patients with ATN (GpШa) using paired t test. There was high statistical significant increase in pNGAL, sCr, blood urea and GFR in those patients (P >0.0001)
Table (10) shows validity of NGAL as a predictor of AKI within 3 hours. Setting a cutoff value of 134 ng/dl for pNGAL yielded a sensitivity and specificity of 98.1 % and 91.9 % respectively with positive predictive value (PPV) of 55.4 % and predictive value negative (NPV) of 96.7 % .
4-correlation and regression analysis:
Table (11) shows correlation between NGAL and other parameters among the studied groups. In both control subjects and hepatic patients with AKI there was no significant correlation between pNGAL levels and all other parameters (p > 0.05). In hepatic patients with AKI, (After 3 hours of AKI), there was no significant correlation between pNGAL levels and all other parameters except ALT and AST (positive correlation) and S.albumin (negative correlation). (p >0.05). Linear regression analysis shows that ALT and platelets were the most important independent factors related to pNGAL. (Table 12)
-58-
Table (1) Demographic Data and classification of studied population using analysis of variance (ANOVA test) .
Group N Sex F P Age range (year)
X±SD
F P
M F
Group Ι 10 7 3 0.376 0.688
NS
38-50 44.9±3.35
2.300 0.107 NS
Group Π 40 22 18 40-53
46.4±3.82
Group Ш 30 18 12 42-54
47.7±4.01
G
roup
Π
subca
tegor
ie
s
Πa1
10 6 4 1.180 0.331
NS
42-52 46.9±3.18
0.519 0.672 NS
Πa2 10 5 5 42-52
47.3±3.68
Πb 10 7 3 40-52
46.1±4.15
Πc 10 4 6 40-53
45.3±4.45
G
roup Ш
subca
tegor
ie
s
Шa 10 6 4 0.386 0.684
NS
42-54 49.3±4.14
1.546 0.231 NS
Шb 10 7 3 42-51
47.7±3.34
Шc 10 5 5 42-52
46.2±4.29
Table (2): (X±SD) of values of studied Laboratory data among the different groups of patients using analysis of variance (ANOVA test).
Group Ι X±SD Range
Group Π X±SD Range
Group Ш X±SD Range
F-test P-value
ALT
(7- 41 IU/L)
16.0±7.82 7-33
73.1±10.4 49-89
79.1±14.7 45-99
110.3 <0.0001 HS
AST
(7- 41 IU/L)
17.1±5.99 8-27
63.5±12.2 43-84
96.7±19.3 63-130
116.4 <0.0001 HS
S. Albumin (3.5 – 5 gm/dl) 4.65±0.66 3.6-5.9
4.62±0.57 3.5-5.9
2.37±0.40 1.6-3.1
174.6 <0.0001 HS
PT (12.7 – 15.4 sec) 12.8±0.07 12.7-12.9
14.3±0.58 12.8-15.4
21.6±2.03 16.9-25.3
321.6 <0.0001 HS
PTT (26.3 – 39.4 sec) 30.4±2.46 27-34
37.3±1.81 33-43
42.2±2.98 38-49
98.38 <0.0001 HS
INR (0.8-1.2) 1.0±0.005
1-1.01
1.11±0.05 1.00-1.20
1.69±0.18 1.32-1.98
246.0 <0.0001 HS
WBC(4.4 - 11.0 x 10(9)/L) 7.77±1.69 4.90-9.90
6.45±1.27 3.8-9.1
5.48±1.49 3.20-8.10
10.75 <0.0001 HS
Hb
(12-17 g/dl)
14.2±0.81 12.9-15.3
12.4±0.99 10.9-14.4
9.62±0.48 8.9-10.7
157.5 <0.0001 HS
Platlets (150 - 450 x 10(9)/L) 250±72.6 175-377
172±11.7 155-200
92.3±20.7 49-130
-59-
Table (3): (X±SD) of values of kidney function parameters among the different groups using analysis of variance (ANOVA test).
Group Ι
X±SD Range
Group Π X±SD Range
Group Ш X±SD Range
F-test P-value
NGAL
(35-134 ng/dl)
79.3±28.1 45-130
80.8±22.0 43-125
174.8±94.5 69-318
22.55 <0.0001 HS
SCr
(0.5-1.4 mg/dl)
0.83±0.07 0.7-0.9
0.82±0.06 0.7-0.9
0.85±0.06 0.75-0.96
2.25 0.112
NS
Urea
(15-50 mg/dl)
21.9±6.08 15-31
24.0±6.00 12-34
21.6±3.31 15-27
2.08 0.131
NS
GFR (90-130 mL/min/1.73 m2)
106±12.1 90-130
96.4±16.7 69.6-126
92.4±13.9 67.6-118
2.87 0.062
NS
Table (4): (X±SD) of values of kidney function parameters among groupΠ subcategories using analysis of variance (ANOVA test).
Group Πa1 X±SD Range
Group Πa2 X±SD Range
Group Πb X±SD Range
Group Πc X±SD Range
F-test P value
NGAL
(35-134 ng/dl)
76.6±11.0 60-95
79.6±24.2 44-120
85.1±24.0 48-120
81.8±27.8 43-125
0.177 0.949 NS
SCr
(0.5-1.4 mg/dl)
0.80±0.03 0.7-0.8
0.83±0.07 0.7-0.9
0.81±0.06 0.7-0.9
0.83±0.07 0.7-0.9
0.691 0.602 NS
Urea
(15-50 mg/dl)
23.4±5.56 15-31
26.2±6.32 17-34
24.4±5.19 17-32
22±6.90 12-33
0.883 0.482 NS
GFR (90-130 mL/min/1.73 m2)
99.4±16.4 78.4-123
92.3±15.8 69.8-112
103.1±16.7 70.4-126
90.6±17.2 69.9-126
-60-
Table (5):Comparison between (X±SD) of values among group Πa patients before taking interferon plus ribavirin therapy and 3 months after the therapy using paired t test.
Before After t P
NGAL
(35-134 ng/dl)
76.6±10.9 60-90
80.4±23.4 44-130
-0.644 0.536
NS
Creatinine (0.5-1.4 mg/dl)
0.79±0.02 0.73-0.82
0.80+0.02 0.73-0.83
-0.921 0.381
NS
Urea
(15-50 mg/dl)
23.4+5.5 15-31
27.3+6.53 20-40
-1.78 0.108
NS
GFR (90-130 mL/min/1.73 m2)
99.3+16.4 78-123
99+16.5 76.7-123.4
0.544 0.600
NS
ALT
(7- 41 IU/L)
85.5+3.13 80-89
37.9+2.92 33-42
-33.4 <0.0001
HS
AST (7- 41 IU/L)
79.7+2.05 77-84
37.7+1.70 35-40
-50.6 <0.0001
HS
Albumin (3.5 – 5 gm/dl)
4.47+0.54 3.5-5.3
4.41+0.30 3.8-4.8
0.415 0.688
NS
WBC
(4.4 - 11.0 x 10(9)/L)
6.02+1.29 4.0-7.8
3.61+0.68 2.4-4.5
7.38 <0.0001
HS
HB
(12-17 g/dl)
13.5+0.59 12.4-14.4
10.9+0.94 9.3-12.1
10.89 <0.0001
HS
Platlets
(150 - 450 x 10(9)/L)
188+8.45 170-200
109+16.4 90-134
12.07 <0.0001
HS
Table (6): (X±SD) of values of kidney function parameters among groupШ subcategories using analysis of variance (ANOVA test).
Group Шa X±SD Range
Group Шb
X±SD Range
Group Шc X±SD Range
F-test P-value
NGAL
(35-134 ng/dl)
295.3±19.08 260-318
142.7±48.5 89-263
86.5±11.2 69-105
110.9 <0.0001 HS
SCr
(0.5-1.4 mg/dl)
0.85±0.07 0.76-0.95
0.87±0.06 0.78-0.96
0.82±0.05 0.75-0.88
1.314 0.285
NS
Urea
(15-50 mg/dl)
19.9±2.84 15-25
22.1±3.31 18-26
22.7±3.37 19-27
0.876 0.463
NS
GFR (90-130 mL/min/1.73 m2)
91.5±12.9 67.6-110
91.9±13.4 71-114
93.8±16.5 71.7-118
2.360 0.088
-61-
Table (7):Time-course of NGAL and kidney function parameters in patients with ATN (GpШa).
Biomarker Basal 3hs 24hs f p
NGAL
(35-134 ng/dl)
76.6±20.9 45-120
29519.08 260-318
18731.89 160-225
166 >0.0001
HS
Creatinine (0.5-1.4 mg/dl)
0.8407 0.75-0.95
0.840.07 0.76-0.95
1.37±07 1.25-150
139 >0.0001
HS
Urea
(15-50 mg/dl)
18.52.32 15-22
19.92.85 15-25
36.7±5.56 28-46
34.8 >0.0001 HS
GFR (90-130 mL/min/1.73 m2) 91.9513.2 67.6-110
91.512.9 67.6-110
52.4±7.26 39.9-60.7
38.9 >0.0001 HS
Basal (before kidney injury) 3hs (after 3 hours of AKI)24hs(after 24 hours of AKI).
Table (8): Comparison between the basal and 3 hours valuesof NGAL and kidney function parameters in patients with ATN(GpШa) using paired t test.
Basal 3hrs t p
NGAL
(35-134 ng/dl)
76.6±20.9 45-120
29519.08 260-318
-18.943 >0.0001
HS
Creatinine (0.5-1.4 mg/dl)
0.8407 0.75-0.95
0.840.07 0.76-0.95
1.912 0.081
NS
Urea
(15-50 mg/dl)
18.52.32 15-22
19.92.85 15-25
-1.769 0.111
NS
GFR (90-130 mL/min/1.73 m2) 91.9513.2 67.6-110
91.512.9 67.6-110
1.964 0.088
NS
Table (9): Comparison between the basal and 24 hours values of NGAL and kidney function parameters in patients with ATN (GpШa) using paired t test.
Basal 24 hrs t p
NGAL
(35-134 ng/dl)
76.6±20.9 45-120
18731.89 160-225
-9.278 >0.0001
HS
Creatinine (0.5-1.4 mg/dl)
0.8407 0.75-0.95
1.37±07 1.25-150
-31.741 >0.0001
HS
Urea
(15-50 mg/dl)
18.52.32 15-22
36.7±5.56 28-46
-10.181 >0.0001
HS
GFR (90-130 mL/min/1.73 m2)
91.9513.2 67.6-110
52.4±7.26 39.9-60.7
16.106 >0.0001
HS
Table (10): Validity of NGAL as a predictor of AKI within 3 hours
Biomarker Sensitivity Specificity PPV NPV
NGAL 98.1 91.9 84.2 96.7
-62-
Table (11): Correlation coefficient (r) between NGAL and other parameters among the studied groups after 3 hours of kidney injury.
Gp I Gp Π Gp Ш
r p r p r p
Creatinine -0.304 0.393 0.226 0.161 0.241 200
Urea -0.272 0.446 -0.020 0.904 -0.251 180
GFR 0.360 0.308 -0.092 0.571 -0.070 712
ALT -0.051 0.890 -0.125 0.443 0.679 >0.0001 (S)
AST 0.298 0.402 -0.051 0.756 0.689 >0.0001 (S)
S. Albumin -0.416 0.231 0.142 0.381 -0.313 0.046
(S)
PT 0.063 0.863 0.177 0.274 -0.223 235
PTT -0.560 0.092 0.242 0.132 -0.220 0.242
INR 0.271 0.449 0.178 0.271 -0. 114 0.574
WBC -0.018 0.960 -0.175 0.280 -0.098 0.607
HB 0.345 0.329 -0.173 0.287 0.291 0.119
Platelets -0.568 0.086 -0.122 0.452 0.137 0.460
Table (12): Linear regression analysis between pNGAL and other parameters after 3 hours of kidney injury in hepatic patients with AKI (Gp Ш).
Beta Std. Error (SE) t p
GFR 0.3751.59 0.235 0.820 NS
Urea -5.495.03 -1.09 0.307 NS
SCr -444287.9 -1.54 0.162 NS
ALT 7.701.82 4.22 0.003 S
AST -1.561.42 -1.101 0.303 NS
Albumin -43.1648.98 -0.881 0.404 NS
WBCs -0.60011.65 -0.051 0.960 NS
HB 7.3849.45 0.149 0.885 NS
Platelets 2.450.811 3.02 0.017 S
PT -30.7424.05 -1.28 0.237 NS
PTT 6.347.02 0.903 0.393 NS
INR 302.9334.8 0.905 0.392 NS
Table (13): Correlation coefficient (r) between NGAL and kidney function parameters after 24 hours of kidney injuryin hepatic patients with AKI (Gp Ш)..
Gp Ш (Decompensated hepatic patients with AKI)
r p
SCr 0.810 >0.0001 (S)
Urea -0.075 0.695 NS
-63-
Table (14): Linear regression analysis between pNGAL and kidney function parameters after 24 hours of kidney injury in hepatic patients with AKI (Gp Ш).
Beta Std. Error (SE) t p
SCr 438.72072.306 6.068 >0.0001 S
Urea -1.441.764 -1.886 0.070 NS
GFR .494.544 0.907 0.373 NS
Fig. (1): Curve estimation of relationship between SCr and NGAL in group III after 24 hours of AKI by linear regression analysis.
250.00 200.00
150.00 100.00
NGAL
1.50
1.40
1.30
1.20
1.10
1.00
SCr
Linear Observed
DISCUSSION
AKI in patients with cirrhosis is common and deadly. Up to 20 % of hospitalized patients with cirrhosis develop AKI [1] and once AKI occurs there is a reported fourfold increased risk of mortality [7]. In cirrhosis, AKI types include PRA, HRS and intrinsic acute kidney injury (iAKI) or ATN but their effect on mortality risk varies. [1] The differential diagnosis of AKI types in cirrhosis is important to apply specific therapies for each cause. PRA should be treated with plasma volume expansion, while this is not effective and may be even deleterious in patients with ATN. [8] ATN should in general be treated with Renal Replacement Therapy (RRT) while HRS should be treated with vasoconstrictors an albumin. [9]
Unfortunately these forms of AKI are difficult to distinguish clinically as SCr, the clinical standard to define kidney function, poorly discriminates AKI type in cirrhosis [10], as it is associated with many problems: (A) SCr is influenced by age, gender and ethnicity. [11] (B) SCr is a byproduct of the metabolism of creatine, which is stored in muscles, so it reflects endogenous muscle mass as well as protein intake. [4] (C) It is
synthesized in the liver, so any hepatic parenchymal dysfunction will directly reduce creatine production.
[4]
(D) The oedematous state in ascitic patients leading to creatinine dilution in the body with low serum levels. [12] (E) SCr concentrations may not change until a significant amount of kidney function has already been lost, meaning that renal injury is already present or occurs before SCr is elevated. Also, the capacity of the kidneys to excrete creatinine is hardly predictable for the individual; it also depends on some medication interfering with tubular creatinine transport. Finally, during acute changes in glomerular filtration, SCr does not accurately depict kidney function until steady-state equilibrium has been reached, which may require several days. [13]
These factors render SCr less sensitive in reflecting renal dysfunction in cirrhotic patients; the sensitivity of SCr for reduced GFR may be as low as 18.5%. [14] Therefore, there is an urgent need for objective methods in the differential diagnosis of impairment of kidney function in cirrhosis.
-64-
kidney biomarkers, that are released at the time of injury of tubular cells and could be used for an early diagnosis of acute kidney injury and also for differential diagnosis of impaired kidney function
[15]
. Among the different biomarkers, NGAL has received a great deal of attention. A number of studies have shown that NGAL predicts the development of kidney injury in different clinical settings, and may also be helpful in the prediction of the need for dialysis and early mortality. [16] However, the existing information on the potential usefulness of NGAL in the differential diagnosis of impaired kidney function in cirrhosis is very scant. [17] So, in our study, the usefulness of plasma NGAL ( pNGAL) as an early biomarker of AKI and as a biomarker for the differential diagnosis of causes of AKI in cirrhosis has been investigated.
Our study revealed that hepatic patients with AKI (GpШ) had no significant different in kidney function parameters compared to hepatic patients without AKI and control. (P < 0.05). This came in consistence with Sherman, D.S., et al.who proved that SCr in patients with decompensated cirrhosis can still be within the normal range despite significant renal dysfunction.[5] Also, Nguyen, M.T and Devarajan,P. proved that SCr does not accurately depict kidney function until a steady-state equilibrium has been reached, which may require several days.[13]
On the other hand, pNGAL was
significantly higher in hepatic patients with AKI compared to hepatic patients without AKI and control. P <0.0001. The present study correlates with Portal, A.J., et al. who proved that pNGAL was significantly elevated in hepatic patients with AKI post liver transplantation (i.e decompasated cirrhosis) compared to those without AKI (P < 0.001). [18] Also, Fagundes, C., et al. proved that patients with cirrhosis and kidney dysfunction irrespective of aetiology had greater serum NGAL levels compared to those without kidney dysfunction.[19]
Among the 4 subcategories of group (II), ALT and AST were significantly higher than control group reflecting hepatocellular injury rather than synthetic liver function which is better reflected by albumin and prothrombin time [20]. (Which are not significantly different from control). Also, values of PT, PTT, INR, WBCs, Hb and platelets were significantly higher than in control group (yet all were within the normal range).such findings confirm the state of compensation in such patients .
Kidney function parameters (SCr, Urea and GFR) and pNGAL in such 4 subcategories were found not significantly different from control group or between the subcategories and some of them. i.e no renal deterioration was found. Our finding reflected and confirmed normal kidney function (no kidney injury) among them. Our finding came in consistence with the study of Gungor, G., et al. proved there was no significant difference between stable cirrhosis patients and control subjects in either kidney function parameters (SCr and GFR) or pNGAL levels.(p < 05).[21]
Considering the subcategory IIa1, our finding came in consistence with the study of Montalbano, M., et al. who proved that treatment withpegylated-IFN-alpha2b and ribavirin in a liver/kidneytransplant recipient didn't affect kidney function.[22]
In the same subcategory IIa1, high significant difference was found in ALT, AST, WBCs, HB and platelets (P <0.0001). table (5). This came in consistence with Wittho, Th, et al. who reported that median ALT and AST levels, (which were elevated as expected in patients suffering from hepatitis C), decreased during treatment and were within the normal range or slightly above at the end of treatment. Also, reported that the median values of WBCs and platelets as well as median haemoglobin concentration decreased during treatment with interferon therapy.[23]
-65-
present in our patients (our patients in group II were compensated, no gastrointestinal bleeding, so no renal abnormality found.
Among the subcategories of group (III), ALT and AST were significantly higher than control group (reflecting hepatocellular injury) associated with evidence of impaired hepatic synthetic function (low serum albumin, elevated PT, PTT, INR significantly different from compensated group II and control subjects) and portal hypertension (splenomegaly with low WBCs, Hb, platelets significantly different from compensated group II and control subjects)[20] .All were present in such patients of group III confirming the state of decompensation in such patients.
Kidney function parameters in such 3 subcategories were found not significantly different between the subcategories and some of them(P < 0.05), our finding correlated with the study of Garcia-Tsao, G., et al.[1] that reported SCr is not helpful in distinguishing various causes of renal injury. Also, Verna,E.C., et al.[27] proved that SCr in patients with iAKI was statistically similar to those with PRA and HRS.
pNGAL was significantly different between the subcategories and some of them (P <0.0001), patients with ATN (GpШa) had highest NGAL means (295±19.08), patients with HRS (GpШb) had intermediate NGAL means (142±48.5), patients with PRA (GpШc) had lowest NGAL means (86.5±11.22).
The mechanism by which patients with HRS have intermediate pNGAL levels remains uncertain. HRS physiology is classically thought to be an extreme prerenal state [28] with severe renovascular vasoconstriction and decreased GFR, but normal intrinsic kidney function. Kidney function can return to normal after improvement of hepatic hemodynamics (i.e. TIPS, surgical portal-caval shunts and liver transplant) [29] or after transplantation of the kidney into a recipient with normal hepatic function [30]. However, pathologic investigations have reported subtle kidney tubular and glomerular damage in HRS kidneys, some seen only with electron microscopy [31], perhaps resulting from the cellular changes associated with chronic activation of angiotensin-aldosterone signaling
[32]
.So, HRS could not be enterely functional in nature but may be associated to tubular damage.
Our study correlates with Niculae, A. et al.[33] who observed that NGAL serum values increased significantly in patients with different
etiologies of acute renal failure, as compared to those diagnosticated later with hepatorenal syndrome (HRS).Similar results was found in other studies used urinary NGAL (uNGAL) as diagnostic tool in the differential diagnosis of impaired kidney function in hepatic patients of them the studies of Verna, E.C.,[27] et al. Fagundes, C., et al.[19] and El-Bassat, H.,et al.[34] allproved that patients with ATN had the highest values of uNGAL, while patients with pre-renal azotemia had the lowest values, patients with HRS had intermediate values.
In patients with ATN (GpШa), there was significant difference along the time course of pNGAL and kidney function parameters, however, pNGAL shows high significant rise within 3 hrs of kidney injury compared to kidney function parameters that rise after 24 hours.These values came in consistence with the findings of Mori K and Nakao K who observed earlyrise of NGAL in the course of AKI, prior to SCr elevation [35].
CONCLUSION
pNGAL is an early biomarker of AKI and it can also discriminate type of AKI in cirrhosis.
HRS could not be enterely functional in nature but may be associated to tubular damage.
pegylated interferon doesn't cause AKI. REFERENCES
1. Garcia-Tsao G, Parikh CR and Viola A. (2008): Acute kidney injury in cirrhosis. Hepatology. 48(6):2064–2077.
2. Kim DJ, Kang HS, Hyuk Soon Choi HS, et al. (2011): Serum cystatin C level is a useful marker for the evaluation of renal function in patients with cirrhotic ascites and normal serum creatinine levels. The Korean Journal of Hepatology .17(2):130-138.
3. Arroyo V, Terra C and Ginès P. (2007): Advances in the pathogenesis and treatment of type-1 and type-2 hepatorenal syndrome. J Hepatol.46(5): 935-946.
4. Peake M and Whiting M. (2006): Measurement of serum creatinine-current status and future goals. Clin Biochem Rev .27(4):173-184.
5. Sherman DS, Fish DN and Teitelbaum I. (2003): Assessing renal function in cirrhotic patients: problems and pitfalls. Am J Kidney Dis .41(2):269–278.
6. Wong F, Nadim MK, Kellum JA, et al. (2011):
Working Party proposal for a revised
-66-
7. du Cheyron D, Bouchet B, Parienti JJ, et al. (2005): The attributable mortality of acute renal failure in critically ill patients with liver cirrhosis. Intensive Care Med. 31(12):1693– 1699.
8. Mehta RL and Bouchard J. (2011): Controversies in acute kidney injury: effects of fluid overload on outcome Contrib Nephrol. 174 , pp. 200–211 9. Gines P, Angeli P, Lenz K, et al.(2010): EASL
clinical practice guidelines on the management of ascites, spontaneous bacterial peritonitis, and hepatorenal syndrome in cirrhosis.J Hepatol. 53(3):397-417.
10. Cholongitas E, Shusang V, Marelli L, et al. (2007): Review article: renal function assessment in cirrhosis—difficulties and alternative measurements. Aliment Pharmacol Ther. 26(7):969-978.
11. Francoz C, Glotz D, Moreau R, et al. (2010): The evaluation of renal function and disease in patients with cirrhosis. J Hepatol . 52(4):605-613.
12.Perrone RD, Madias NE and Levey AS. (1992): Serum creatinine as an index of renal function: new insights into old concepts. Clin Chem .38(10):1933 1953
13.Nguyen MT and Devarajan P. (2008):. Biomarkers for the early detection of acute kidney injury. Pediatr Nephrol .23(12):2151-2157.
14.Caregaro L, Menon F, Angeli P, et al. (1994): Limitations of serum creatinine level and creatinine clearance as filtration markers in cirrhosis. Arch Intern Med .154(2):201–205. 16. Siew ED, Ware LB and Ikizler TA. (2011):
Biological markers of acute kidney injury. J Am Soc Nephrol. 22(5):810-820.
16.Singer E, Elger A, Elitok S, et al.(2011): Urinary neutrophil gelatinase-associated lipocalin distinguishes pre-renal from intrinsic renal failure and predicts outcomes. Kidney Int. 80(4): 405-414.
17.Verna E, Farrand E, Pichardo E, et al.(2009): Urinary neutrophil gelatinase associated lipocalin (UNGAL) distinguishes type of kidney failure and predicts mortality in patients with cirrhosis. Hepatology. 50(4):311A
18. Portal, A.J., McPhail, M.J.W., Bruce, M., et al. (2010): Neutrophil gelatinase-associated lipocalin predicts acute kidney injury in patients undergoing liver transplantation. Liver Transplant . 16(11): 1257–1266.
19. Fagundes C, Pépin M, Guevara M, et al. (2012): Urinary neutrophil gelatinase-associated lipocalin as biomarker in the differential diagnosis of impairment of kidney function in cirrhosis. Journal of Hepatology. 57(2): 267-273. 20. Fraser, A. (2007): Interpretation of liver enzyme
tests–A rapid guide. New Zealand Family Physician (NZFP). 34 (3):194-196.
21.Gungor, G., Ataseven, H., Demir, A., et al. (2014): Neutrophil gelatinase-associated lipocalin in prediction of mortality in patients with hepatorenal syndrome: a prospective observational study. Liver International . 34(1):49-57.
22. Montalbano, M., Pasulo, L., Sonzogni, A., et al (2007): Treatment with pegylated interferon and ribavirin for hepatitis C virus-associated severe cryoglobulinemia in a liver/kidney transplant recipient. J Clin Gastroenterol. 41(2):216-220. 23. Wittho Th, Moller, B., Wiedmann, K.H., et al.
(2007): Safety, tolerability and efficacy of peginterferon alpha-2a and ribavirin in chronic hepatitis C in clinical practice: The German Open Safety Trial. Journal of Viral Hepatitis. 14(11): 788–796.
24. Kamal, S., Madwar, M., Bianchi, L., et al.
(2000): Clinical, virological and
histopathological features: long-term follow-up in patients with chronic hepatitis C co-infected with S. mansoni. Liver. 20(4):821– 822.
25.Mahmoud, K.M., Sobh, M.A., El Agroudy, A.E., et al. (2001): Impact of schitosomiasis on patient and graft outcome after renal transplantion:10
years follow up.Nephrol Dial
Transplant.16(11):2214-2221.
26. Abbas, O.M., Omar, N.A., Zaghla, H.E., et al. (2009): Schistosoma mansoni coinfection could have a protective effect against mixed cryoglobulinaemia in hepatitis C patients. Liver international. 29 (7): 1065-1070.
27.Verna, E.C., Brown, R.S., Farrand, E., et al.
(2012): Urinary Neutrophil
Gelatinase-Associated Lipocalin Predicts Mortality and Identifies Acute Kidney Injury in Cirrhosis. Dig Dis Sci . 57(9):2362-2370.
28.Ochs, A., Rossle, M., Haag, K., et al. (1995): The transjugular intrahepatic portosystemic stent-shunt procedure for refractory ascites. N Engl J Med. 332(18):1192–1197.
-67-
patients with advanced liver cirrhosis. Dig Dis Sci. .48(1):179–186.
30.McDonald, F.D., Brennan, L.A and Turcotte, J.G. (1973): Severe hypertension and elevated plasma renin activity following transplantation of ‘‘hepatorenal donor’’ kidneys into anephric recipients. Am J Med. 54(1):39–43.
31.Kanel, G.C and Peters, R.L. (1984): Glomerular tubular reflux–a morphologic renal lesion associated with the hepatorenal syndrome. Hepatology. 4(2):242–246.
32.Hollenberg, N.K. (2004): Aldosterone in the development and progression of renal injury. Kidney Int. 66(1):1–9.
23.Niculae,A., Checherita, I and
Ciocalteu,A.(2013): Is NGAL useful in
prediction of hepatorenal syndrome diagnosis in patients with hepatic cirrhosis? International Society Of Nephrology.World congress of nephrology. abstracts. Session Info: Moderated Poster Session: Biomarkers for Acute Kidney Injury.Suppl:143
34.El Bassat, H., Ziadaa, D.H., Taha, A., et al. (2014): Urinary neutrophil gelatinase-associated lipocalin as a biomarker for the diagnosis of hepatorenal syndrome in cirrhotic patients. Tanta Medical Journal 41(4)-346–352.