Development of a computer vision system to detect inactivity in
group-housed pigs
Christopher Chijioke Ojukwu
1,
Yaoze Feng
1,2*,
Guifeng Jia
1,2,
Haitao Zhao
1,
Hequn Tan
1,2(1. College of Engineering, Huazhong Agricultural University, Wuhan 430070, China;
2.Key Laboratory of Agricultural Equipment in Mid-lower Yangtze River, Ministry of Agriculture and Rural Affairs, Wuhan 430070, China)
Abstract: Excessive inactivity in farm animals can be an early indication of illness. Traditional way for detecting excessive inactivity in pigs relies on manual inspection which can be laborious and especially time-consuming. This paper proposed a computer vision system that could detect inactivity of individual pigs housed in group pens which is potential in alarming the farmer of the animals concerned. The system recorded sequential depth images for the animals in a pen and implemented a proposed image processing and logic analysis scheme named as ‘DepInact’ to keep track of the inactive time of group-housed individual pigs over time. To verify the robustness and accuracy of the developed system, a total of 656 pairs of corresponding depth data and color images, consecutively taken 4 s apart from each other, were attained. The verification process involved manually identifying all pigs using the color images captured. The results of identification of all pigs that were inactive for more than the preset period of time by DepInact were compared to those by manual inspection through the color images captured. An accuracy of 85.7% was achieved using the verification data, thus demonstrating that the developed system is a viable alternative to manual detection of inactivity of group-housed pigs. Nevertheless, more research is still needed to improve the accuracy of the developed system.
Keywords: Matlab, computer vision, sows, machine vision, depth image, pigs, inactivity DOI: 10.25165/j.ijabe.20201301.5030
Citation: Ojukwu C C, Feng Y Z, Jia G F, Zhao H T, Tan H Q. Development of a computer vision system to detect inactivity in group-housed pigs. Int J Agric & Biol Eng, 2020; 13(1): 42–46.
1 Introduction
Advancements in camera technology have triggered the extensive use of computer vision techniques in agricultural automation. This has enabled automation in many farm operations that are labor-intensive and costly when handled manually. Computer vision techniques generally offer the advantage of being non-invasive and non-intrusive which has encouraged their application in the agricultural farming sector[1].
These applications range from weight estimation[2,3] to behavior
monitoring[4], to tracking[5]. Various researchers have tried to
measure activity in animals by, for example, manually assigning gait scores to animals and then comparing the scores to activity levels observed through image analysis[6,7], but most of these
researches only consider the animal in motion[8,9] and thus, do not
factor in the length of time the animal stays immobile in a particular position.
Though inactivity has been given varying definitions by different authors[10,11], this paper defines inactivity as the absence
of movement of the whole or greater part of the body of the animal.
Received date: 2019-03-14 Accepted date: 2019-11-07
Biographies: Christopher Chijioke Ojukwu, Master, research interest: intelligent detection and control technology, Email: [email protected]; Guifeng Jia, PhD, Lecturer, research interest: intelligent detection and control technology, Email: [email protected]; Haitao Zhao, Master, research interest: intelligent detection and control technology, Email: [email protected]; Hequn Tan, PhD, Professor, research interest: livestock and poultry breeding technology and equipment, Email: [email protected].
*Corresponding author: Yaoze Feng, PhD, Associate Professor, research interest: intelligent detection and control technology. College of Engineering, Huazhong Agricultural University, Wuhan 430070, China. Tel: +86- 15527056850, Email: [email protected].
This definition is consistent with research[12] in applied animal
behavior where video recordings are used. A lot of research has pointed to a correlation between inactivity and animal welfare. Excessive inactivity in animals can be an early indicator of ill-health[13]. The positive correlation between stressful conditions
(experience of loss, lack of reward) and low activity has been highlighted by previous research[14]. Animals have also been
known to decrease general activity when threatened by predators or when they feel danger[15]. While inactivity or its lack thereof is
not usually a definitive indicator of an animal’s welfare state[16], it
could point the farmer in the right direction so that further investigations can be carried out on the animal concerned.
As far as the authors are aware of, there is scarcely any published research that aims to detect inactivity or immobility in animals using computer vision techniques. Most similar researches, however, focus on lameness[17] i.e. they focus on the
animals when they were in motion, while ignoring them at rest. Therefore, the objective of this research was to develop a computer vision system to monitor the length of time an animal stays inactive in a particular position and implement real data to validate the developed system.
2 Materials and methods
2.1 Data collection
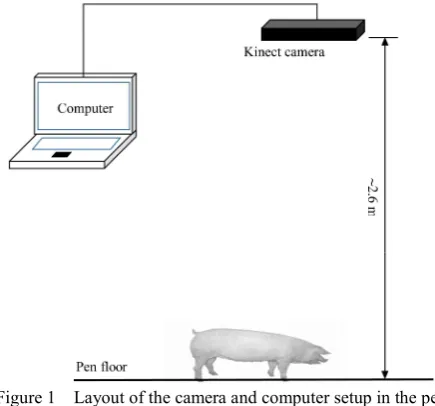
PC (HP Pavilion g6 with Intel Pentium M processor and 4 gigabytes RAM) running Windows 10 operating system. The algorithm was developed and implemented in Matlab. Each data entry consisted of a corresponding pair of raw depth data and color image. The data set was recorded from about 08:00 to 11:00. This time period roughly corresponds to the most active period of the pigs’ daily routine and encompasses their feeding time.
Figure 1 Layout of the camera and computer setup in the pen It should be noted that the algorithm described in this research, when deployed commercially, is supposed to take inputs (raw depth data) from the camera mounted above the test area in the farm and process them immediately in order to output actionable information. However, because of limited access to the test area, the test data used here was pre-collected, stored in a hard disk and then later used to test the algorithm in the lab. It should also be noted here that pre-collection of the test data does not alter the fidelity of the algorithm in any way as the data was collected in the same way that it would have been collected, had it been done during runtime in the farm.
2.2 Algorithm
The basic logic in the algorithm involves updating the pig models (a pig model contains pixel coordinates, mean pixel value and inactive time) in a support map after comparing the current depth image to the previous depth image. This comparison seeks to identify the pigs in the current image that maintained their position with regards to the previous image. The comparison is based on the mean value of the pixel distances from the camera for each pig in each image. The assumption here is that over time, the depth data for inactive pigs (and thus the mean value) would remain the same or change just a little bit. Pig models for pigs that maintain their position are added to the support map while pig models for pigs that have changed their position are ignored. At the end of every loop, the loop count is incremented by one for all the pigs in the support map. When the loop count for any pig in the support map equals a preset limit (15 in this study, as an example), a signal is sent to an alarm circuit and a visual output highlighting the position of the concerned pig is displayed on the computer screen.
It should be noted here that the algorithm only considers sitting and lying pigs since standing pigs are assumed to be active. It should also be noted that because of the complications involved in the segmentation of pigs lying very close to each other (with their bodies in contact), the support map for this algorithm only stores pig models for single pigs that are not in contact with other pigs
and are thus, segmented properly. However, inactive single pigs that have already been segmented properly but lie in contact with other pigs in subsequent images can still be distinguished (and detected) properly using their pixel coordinates.
2.2.1 Image Processing
Since the focus of this research was squatting and lying pigs, pixels representing standing pigs were first eliminated by assigning them the same values as the image background (pen floor). From the grayscale images (Figure 2), a simple threshold segmentation method was then used to extract the binary images (Figure 3). Multiple threshold values between zero and one were tested on the images and 0.7 was chosen as the optimal value for squatting and lying pigs since it gave the best segmentation result for these pigs.
Figure 2 Grayscale image before segmentation
Figure 3 Binary image after segmentation
The use of watershed segmentation[18] was also attempted in
order to segment pigs lying in contact with each other but this resulted in over-segmented images and was thus, not reliable. Blobs whose areas were greater than 13 000 pixels were not transferred into the support map since they were assumed to contain more than a single pig. The logic here is that inactive pigs originally lying in contact with other pigs and are thus not captured by the algorithm, will eventually lie alone since the active pigs would get up to feed or drink. The algorithm would then capture them and eventually alert the farmer. Blobs that were less than 2000 pixels were removed using the ‘bwareaopen’ function in Matlab.
2.2.2 Basic Loop
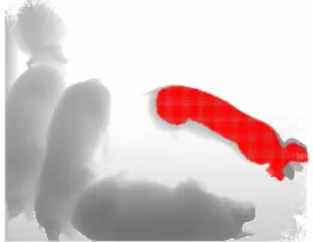
particular blob has changed its posture or position and thus this blob is ignored. However, if the difference is less than the threshold, it would mean that the pig represented by this blob has not changed its position and thus, the pig model for this blob is updated and added to the support map. It should be noted that different α values were compared in this study to optimize the identification of inactivity of pigs so as to provide accurate alarming of possible sick pigs. Updating a pig model involves increasing the loop count (by one) for the pig represented by that model. At this point, the pig models in new-image are then compared to the pig models in the support map so that pigs that were not in old-image but appear in the new-image are identified and their models are updated and included in the support map. Then, all the pig models in the support map are checked, if the loop count for any pig model in the support map is equal to 15, all the pixels that make up this pig model are highlighted in red, on a grayscale image (obtained from the current depth data) and displayed on the computer screen (Figure 5). It should be noted that 15 was taken in this study just for illustration purpose and the precise loop count for any pig model in the support map should be carefully determined as advised by veterinarians in real applications. In the present example, given the time interval between pictures of 4 s, the pig will be made red when inactive for 1 min. After this, a signal can then be sent to a connected alarm which alerts the farmer. After this, all the pig models in the support map are transferred to the old-image variable. Then the new-image and support map variables are wiped clean and the loop starts again. The loop runs continuously and only terminates after the last image in the batch has been processed. Given that B is the matrix of the raw depth image values obtained from a particular pig’s coordinates in old-image and A is the matrix of the raw depth image values for the same coordinates in new-image, then the condition that must be satisfied before a pig model can be transferred to the support map from the old-image variable can be expressed thus:
(mean(B) – α) < mean(A) < (mean(B) + α)
where, α gives the threshold and mean(A) and mean(B) are the mean depth image values in the same defined coordinates for the new and old images, respectively.
Figure 4 Flow chart of algorithm loop
Figure 5 Output image showing inactive pig plotted in red
3 Results
3.1 Manual verification
Manual verification of the output involved looking at each of the 656 input images critically in the order in which they were captured and trying to spot an inactive pig in 15 consecutive images. This verification adhered strictly to the definition of inactivity provided earlier in this article. It should also be noted that the algorithm was designed to trigger an alarm for a particular scenario once and would thus ignore this scenario even if the pig was still inactive long after the alarm had been triggered. This fact was also considered in the manual verification process where scenarios depicting inactive pigs in 15 consecutive images were only counted once. The manual verification was able to detect seven images which translate to seven scenarios where a pig was inactive in 15 consecutive loops or 60 s.
3.2 Identification of inactive pigs
656 images captured 4 s apart were fed into this algorithm. Run time lasted for about 105 s. The threshold (α) was set at 75 pixels while the loop count was set at 15. The algorithm gave six images as output. This means that these six images should contain at least one pig that was inactive for 60 s. The inactivity time (T) is deduced from a simple multiplication of the loop count (15) and time interval (4 s). Further observation revealed that these six scenarios fell in the seven scenarios of human verification. This implies that the algorithm was able to detect six out of seven scenarios correctly. Thus the percentage accuracy of the algorithm can easily be calculated as (6/7)×100% = 85.7% (approx. 86%). Though few inactive pigs were identified for the data set involving over 650 images, this study clearly demonstrated the feasibility of the current algorithm for identifying inactive pigs. 3.3 Threshold and loop count
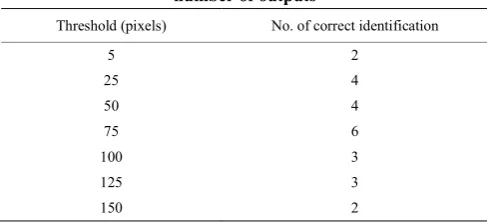
Table 1 Summary of threshold values and corresponding number of outputs
Threshold (pixels) No. of correct identification
5 2
25 4
50 4
75 6
100 3
125 3
150 2
This clearly leads to the conclusion that 75 is the optimal value of the threshold since the highest number of identification rate was recorded here. Therefore, the threshold was set to 75 pixels. Thus, if the mean pixel value for a pig changes by more than 75 pixels in two consecutive images, then the pig model for this pig is ignored and not included in the support map. Also, the loop count is directly correlated to the inactivity time and while it was chosen as 15 for this research in order to set the inactivity time at 60 s, developers looking to deploy this system commercially would likely need to consult farmers and industry experts before coming up with an appropriate value that works commercially. In this study, 60 s was only used to demonstrate the validity of the proposed system and detection scheme.
4 Discussion
Group housed livestock breeding represents the future of animal husbandry. This trend is in part spurred by animal-friendly regulations around the world[19]. It is however
unfortunate that most computer vision researches that are intended to help farms automate manual processes focus on individual pigs usually housed in tight stalls. In this study, group-housed pigs at rest are monitored in a bid to track how long they remain inactive in a particular position and alert the farmer when it exceeds a preset time. The system detects inactivity automatically and thus has the potential to replace the traditional manual method of animal welfare inspection.
To the best of the authors’ knowledge, this is the first application of depth images for detecting and tracking the inactivity of group-housed animals at rest.
While the developed system eventually detects all inactive pigs over time due to the mobility of the active pigs, detecting inactive pigs as soon as possible would still be an improvement on this system since it would result in earlier interventions. An improved system would likely have to find a way to segment pigs lying in contact to one another reliably. The researchers have not come across any research that executed this segmentation accurately. This stems from the fact that pigs tend to lie in unpredictable positions while in contact with each other. An interesting approach would be the use of machine learning to teach the computer how to handle each segmentation scenario. This would, however, require a lot of data. It should also be pointed out that while the developed system requires initial accurate segmentation for each pig in an image, it does not require segmenting the pigs in subsequent images since it makes use of pixel coordinates to locate the pigs in subsequent images.
Automating some of the variables would also increase the scalability of the system. The algorithm could be improved by making it to automatically determine the maximum size (in pixels) of a single pig so that it can be deployed for any pig age group
without manual configurations. The threshold could also be calculated automatically by considering the standard deviation of the mean pixel values for single lying pigs over time. This is however tricky as the value of threshold could be a product of subjective opinion with regards to the definition of inactivity. Besides the possible improvement in accuracy of inactivity detection, it is of great importance to investigate the actual relationship between inactivity and illness of pigs so that a reasonable loop count for any pig model in the support map can be determined for real applications and false alarms are expected to be avoided.
5 Conclusions
A novel computer vision system was developed to detect inactivity in group-housed pigs. The system employed a depth camera connected to a computer system running an algorithm on Matlab. The system was able to achieve a detection accuracy of 85.7% if the threshold and loop count were set to 75 pixels and 15 respectively. It was suggested to use more advanced segmentation techniques in order to improve its accuracy. Even though the developed system is still a prototype, when it is eventually deployed commercially, it is intended to run round the clock and assist farmers in detecting animals that have been inactive for a preset period of time. This would reduce labour costs for farms and in turn reduce the unit cost of meat production around the world.
Acknowledgements
The current study was finally supported by National Key R&D Program of China (2018YFD0500700) and Natural Science Foundation of Hubei Province (2018CFB099).
[References]
[1] Chen Y-R, Chao K, Kim M S. Machine vision technology for agricultural applications. Computers and Electronics in Agriculture, 2002; 36(2): 173–191. [2] Amraei S, Abdanan Mehdizadeh S, Salari S. Broiler weight estimation based on machine vision and artificial neural network. British Poultry Science, 2017; 58(2): 200–205.
[3] Mortensen A K, Lisouski P, Ahrendt P. Weight prediction of broiler chickens using 3D computer vision. Computers and Electronics in Agriculture, 2016; 123: 319–326.
[4] Lao F, Brown-Brandl T, Stinn J P, Liu K, Teng G, Xin H. Automatic recognition of lactating sow behaviours through depth image processing. Computers and Electronics in Agriculture, 2016; 125: 56–62.
[5] Ahrendt P, Gregersen T, Karstoft H. Development of a real-time computer vision system for tracking loose-housed pigs. Computers and Electronics in Agriculture, 2011; 76(2): 169–174.
[6] Aydin A, Cangar O, Ozcan S E, Bahr C, Berckmans D. Application of a fully automatic analysis tool to assess the activity of broiler chickens with different gait scores. Computers and Electronics in Agriculture, 2010; 73(2): 194–199.
[7] Aydin A. Development of an early detection system for lameness of broilers using computer vision. Computers and Electronics in Agriculture, 2017; 136: 140–146.
[8] Silvera A M, Knowles T G, Butterworth A, Berckmans D, Vranken E, Blokhuis H J. Lameness assessment with automatic monitoring of activity in commercial broiler flocks. Poultry Science, 2017; 96(7): 2013–2017.
[9] Kongsro J. Development of a computer vision system to monitor pig locomotion. Open Journal of Animal Sciences, 2013; 3(3): 7.
[10] Fanselow M S. The postshock activity burst. Animal Learning & Behaviour, 1982; 10(4): 448–454.
behaviour, physiology and welfare? Applied Animal Behaviour Science. 2008; 111(3): 329–341.
[12] Burrell A M, Altman J. The effect of the captive environment on activity of captive cotton-top tamarins (Saguinus oedipus). Journal of Applied Animal Welfare Science: JAAWS, 2006; 9(4): 269–276.
[13] Hart B L. Biological basis of the behaviour of sick animals. Neuroscience & Biobehavioural Reviews, 1988; 12(2): 123–137. [14] Mendl M, Burman O H P, Paul E S. An integrative and functional
framework for the study of animal emotion and mood. Proceedings Biological Sciences, 2010; 277(1696): 2895–2904.
[15] Dalm S, de Visser L, Spruijt B M, Oitzl M S. Repeated rat exposure inhibits the circadian activity patterns of C57BL/6J mice in the home cage. Behavioural Brain Research, 2009; 196(1): 84–92.
[16] Fureix C, Meagher R K. What can inactivity (in its various forms) reveal about affective states in non-human animals? A review. Applied Animal Behaviour Science, 2015; 171: 8–24.
[17] Zhao K, Bewley J M, He D, Jin X. Automatic lameness detection in dairy cattle based on leg swing analysis with an image processing technique. Computers and Electronics in Agriculture, 2018; 148: 226–236. https://doi.org/10.1016/j.compag.2018.03.014
[18] Eddins S. The watershed transform: strategies for image segmentation. MathWorks, 2002. https://www.mathworks.com/company/newsletters/ articles/the-watershed-transform-strategies-for-image-segmentation.html. Accessed on [2018-12-29].