An Empirical Comparison of the Major Stock Exchanges:
NYSE, NASDAQ and LSE in Perspective
MBA Isida Mansaku
MSc. Saimir Mansaku
Ioannis Tampakoudis, PhD
Canadian Institute of Technology, Tirana, Albania Email: i.mansaku@cit.edu.al; saimir.mansaku@cit.edu.al; ioannis.tampakoudis@cit.edu.al
Doi:10.5901/ajis.2016.v5n3s1p406
Abstract
As (Considering that) listing on any exchange provides a great opportunity to the corporates or entrepreneurs for raising capital in order to fund new projects or to undertake expansions or diversifications, we have conducted an empirical research on the largest stock exchanges worldwide, focusing more on New York Stock Exchange, London Stock Exchange and NASDAQ respectively. The main purpose of this study is to provide evidence on the performance of the three exchanges with the emphasis on some key indicators for the period spanning from 2010 to 2014. The analysis conducted on these indicators reflects the progress of the exchanges during this period and provides a great statistical significance. Moreover, the recent trends are tracked down to demonstrate how this valuable source can be channeled into decision making. The findings outline that the stock exchanges are reliable barometers to measure the economic growth of a country and could be beneficial for a range of market participants, such as companies or current and potential investors when selecting a stock exchange, for issuers, and of course for scholars to get a better idea about the important happenings on stock exchanges and to understand the impact that one exchange movement has on other.
Keywords: NYSE, NASDAQ, LSE, stock exchange, performance indicators, marcap, trading volume
1. Introduction
Listing on any exchange provides a great opportunity to the corporates or entrepreneurs to raise capital in order to fund new projects or to undertake expansions or diversifications. Listing is beneficial to the companies, to the investors and to the general public at large. It brings on a continuous basis adding prestige and importance to listed companies. Stock exchanges facilitate transparency during the trade of listed securities in equality and competitive conditions. The exchange prices can be used as an index of the economy state. In general, the advantages of being listed are that the stock exchanges provide:
A premier and orderly marketplace Visibility and liquidity
Transaction speed Fair-price determination
Continuous reporting on sales and quotations and information on listed companies Strict regulation to protect the security holders
A stock exchange can be considered an economic mirror where the important changes in a country and the economy are reflected in the shares prices. Any increase or decrease in the prices of shares indicates the boom or recession time period of the economy respectively.
1.1 The objectives and the research question
The main objective of this research study is to provide evidence on the performance of the three exchanges. According to this, we observe the movements during the chosen period and we examine if the increased competiveness between the exchanges helps improving the quality of each of them.
Thus, it is an empirical issue to determine the trends on the key pre selected indicators. The analysis conducted on these indicators as a response to the question raised, reflects the progress of the exchanges and provides a great statistical significance. Also, some useful data are shown to demonstrate how this valuable source can be channeled into decision making.
The second major intent is to help all market participants to identify potential efficiencies through the discretions and to support them to use these facts. Moreover, the valuation of the tradable securities is useful for the creditors and the government. The creditors can assess the creditworthiness and the government can impose taxes on the value of securities.
1.2 Methodology
The research covers NYSE, NASDAQ and LSE which are three giants of the stock market worldwide. We select these stock exchanges as parts of different socio-economic and geographic backgrounds. With respect to our goal, firstly we choose an appropriate methodology and identify some key criteria. We try to provide empirical evidence on measures of the three exchanges’ quality and report significant differences and similarities between the exchanges.
The main part of the study is the analysis of the key performance indicators, wherein the exchanges have been compared on certain qualitative and quantitative parameters for the period from January 2010 to December 2014. These parameters are used to determine important aspects of any stock exchange, for instance, the market capitalization gives an idea about the size of the respective exchanges; whereas the number of listed securities acts as an indicator for the volume and liquidity. The main intent of using this time period is to show recent trends in the performance of the exchanges. The data presented refer to the monthly and annual statistics published by World Federation of Exchanges, a trade association of 64 publicly regulated stock, futures and options exchanges. Data of listed companies on the LSE are downloaded from the Exchange’s website.
2. The Stock Market
2.1 What is the Stock Market?
The Stock Market is a public entity where the stocks or other securities of a company are traded at an agreed price. It is also known as “Equity Market”. The securities are listed on stock exchanges or they are traded privately. There are two options when it is looked to raise capital: debt or equity. Debt can be a bond, loan, mortgage or any other type of credit instrument. Usually, the issuers have the obligation to make regular payments, thus the interest on the debt and to pay back the entire amount borrowed, the principal at maturity. The other option is equity. Equity financing means issuing shares of a business for sale to potential investors and the main benefit of it is not being linked to obliged payments. Share, Stock, Equity, all mean the same, and it is one of the most popular financial instruments.
2.2 The Main Reasons why Companies and Governments Raise Capital
The companies and governments need to raise funds for a variety of reasons, such as: Business growth
Acquisitions of other firms
The purchases of long term assets such as land, building or equipment Facilitation of financial instruments’ trade
2.3 Definition of Stock Exchanges
A stock exchange serves the purpose of a platform of an organized and regulated market where investors and issuers can indulge in the activity for the purchase and sale of various industrial and financial securities like shares, bonds, government securities, commodities, currency, pooled investment products or unit trusts. It also provides facilities for issue and redemption of securities and other financial instruments, and capital events including the payment of income and dividends.
2.4 Characteristics of Stock Exchanges
The main characteristics of stock exchanges are as follows: An organized securities market
Constituent of capital market, market for long-term finance
Voluntary association, only the members can deal, buy and sell securities
The dealings in an exchange are under certain accepted code of conduct, rules and regulation Acts as financing industry
Used as a benchmark for evaluating the investors’ portfolio
3. The Major Stock Exchanges in the World
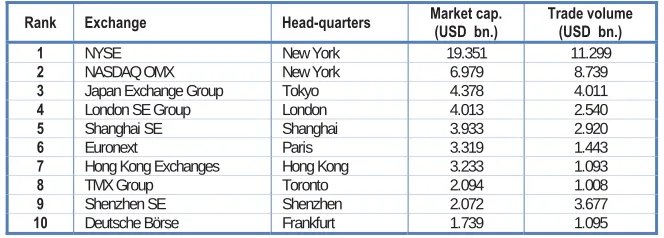
The table below shows the largest stock exchanges worldwide by domestic market capitalization of listed companies as of December 31, 2014. In fact, stock exchanges are also taking advantages of global opportunities that arise, whether from new listings of foreign companies or through mergers, acquisitions and strategic alliances.
Table 1: The largest stock exchanges in the world by domestic market capitalization
Rank Exchange Head-quarters Market cap.(USD bn.) Trade volume (USD bn.)
1 NYSE New York 19.351 11.299
2 NASDAQ OMX New York 6.979 8.739
3 Japan Exchange Group Tokyo 4.378 4.011
4 London SE Group London 4.013 2.540
5 Shanghai SE Shanghai 3.933 2.920
6 Euronext Paris 3.319 1.443
7 Hong Kong Exchanges Hong Kong 3.233 1.093
8 TMX Group Toronto 2.094 1.008
9 Shenzhen SE Shenzhen 2.072 3.677
10 Deutsche Börse Frankfurt 1.739 1.095
Source: World Federation of Exchanges
In order to be more familiar how the stock exchanges operate, we are going to analyze in details three of the major stock exchanges listed above, thus New York Stock Exchange, NASDAQ and London Stock Exchange. The information shown below represents in general a summary of these exchanges and in particular analyzes some indicators that are used to evaluate the individual performance of the exchanges as well to compare them.
3.1 NYSE
3.1.1 Introduction
the Buttonwood Agreement. In the beginning there were only five securities traded and the Bank of New York became the first listed company on NYSE. Crashes over the years affected the NYSE. On October 24, 1929 also called Black Thursday, stock prices fell sharply by a volume of about 13 million shares. After five days, on October 29 the market crashed on a volume of over 16 million shares. This crash marked the beginning of the Great Depression. The main reason behind the crash was that stocks were overpriced. On October 10, 1953 the trade volume on the NYSE reached 900,000 shares, this marked the last day that the daily volume of the NYSE was under 1 million shares. Another crash happened on October 19, 1987, Black Monday when the Dow Jones Industrial Average fell to 508 points or 22.61%, the largest one-day percentage drop in history. One day after, the volume reached 608 shares. In 2000, DJIA experienced its biggest one-day point jump, at 499.19 points and it closed at 10,630.60.
3.1.2 NYSE’s Market Model
“High Tech, High Touch” is the market model of NYSE. The Exchange used for many years only the open-outcry system on the floor trading. Nowadays, although the open-outcry system is still used to set pricing and to trade in high volume for institutions, more than the half of all trades is conducted via electronic networks. Believing that nothing can replace the human judgment and accountability, this market model combines advanced tech capabilities with the supervision of professionals. The connection with human being lowers volatility, offers deeper liquidity and improves prices.
3.1.3 Markets of NYSE
NYSE operates as a strong, transparent financial market. It has the networks of 5 regulated markets including New York Stock Exchange, Arca Equities, MKT, Arca Options and Amex Options. As the NYSE evolved, there are several trading platforms to its ranks, which include four major asset classes; equities, exchange-traded products, options and fixed income. The equity markets offer their customers new technology, and value added trading techniques while options markets provide customers a combination of open outcry trading with advanced electronic capabilities.
3.2 NASDAQ
3.2.1 Introduction
The NASDAQ Stock Market commonly known as NASDAQ was founded in 1971 by the National Association of Securities Dealers (NASD) as the world’s first electronic stock market aiming the reduction of inefficient person-to-person stock transactions and creating a more transparent and faster system.. At the beginning it was merely a quotation system, which went live for 2,500 over-the-counter securities. It lowered the spread between the bid and the ask price of stocks, but this led to dissatisfaction of the brokerage firms which make much of their gains on the spread. Until 1987, the trade occurred through the telephone calls. However after 1987, the trade started to be performed through Small Order System (SOES), an electronic method established to remedy the troubles created during the stock market crash of that year. In 2006, NASDAQ separated from the NASD and changed its status to a licensed national securities exchange. In 2007, NASDAQ joined with the powerful Scandinavian exchange group OMX and it became officially the NASDAQ OMX Group.1
3.2.2 Market Methodology and Market Tiers
NASDAQ features a price/time priority model where the execution logic is fair and transparent for all market participants. All displayed limit orders are treated equally and executed in the order in which they were received at the same price. Non-displayed shares are executed after displayed shares in the order in which they were received at that price. 2 In
celebration of its 35-year history, NASDAQ introduced for first time three distinctive market tiers which are:
The NASDAQ Global Select Market (large-cap.) consists of companies that meet the highest financial and liquidity requirements of NASDAQ’s market tiers and the strict corporate governance standards. Every year, Listing Qualifications
Department reviews the Global Market Composite to determine if any of its stocks have become eligible to be listed on the Global Select Market.
NASDAQ Global Market (mid-cap.) consists of stocks that meet NASDAQ's financial and liquidity requirements, and corporate governance standards. The Global Market is less exclusive than the Global Select Market.
Capital Market (small-cap) is an equity market for companies that have relatively small levels of market capitalization. The listing requirements for these companies are less stringent than for companies of other markets which are listed with significantly higher mar cap.
A company which applies to trade on NASDAQ, it must satisfy certain financial, liquidity and corporate governance requirements of at least one of these three market tiers.
3.2.3 Levels of Information Access3
There are a variety of ways in which NASDAQ quotes security prices to the public. These levels vary on the amount of information and access they provide to investors.
Level I: This type of quote is most often published on the net as a "real-time quote." It consists of real-time bid/ask quotes for securities trading on the NASDAQ. This type of access does not disclose who is bidding or asking for the stock and it does not show how many shares the market maker is looking for. Market makers love clients who have this type of access because it doesn't show them the order sizes, and therefore the order may be passed around or held until the market makers can make the profit from that order.
Level II: This type of quotation system is a step up from the Level I. It also gives the name of the market maker looking to trade the stock. It allows traders to see in what a stock market makers are showing the most interest and to identify the patterns for each market maker. Level II access is available over the internet - but at a cost. This can range in the hundreds of dollars per month depending on the company. For clients placing a large number of trades, the firm may waive the access fee because they will make up the costs on the commissions.
Level III: This trading service consists of everything in Level II plus the ability to enter quotes, execute orders and send information. This service is restricted to NASDAQ member firms that function as registered market makers. Level III allows the members to enter bid/ask quotes as the trades are being executed right in front of them. It is the fastest way to execute a trade and is typically found only on the trading floors of brokerage firms and market makers.
3.3 London Stock Exchange
3.3.1 Introduction
London Stock Exchange is Europe’s oldest stock exchange and one of the oldest stock exchanges in the world which over the centuries following has been developed as a strong, well-regulated stock market and today stays at the heart of global financial markets. Starting its life in coffee houses, the Exchange nowadays is located in the City of London, in United Kingdom. LSE is the first stock exchange established by East India Company in 18th century in London. Its history tracks back more than 300 years ago in 1698 when John Casting began to issue “at this Office in Jonathan’s Coffee-house” a pricing list of stock and commodities called “The Course of the Exchange and other things”. This is the earliest evidence for an organized trade in London securities market. On March 3, 1801 began officially the history of the London Stock Exchange. In 1923 the motto of the London Stock Exchange became “Dictum MeumPactum” which means “My Word is my Bond. In 1986, the market got deregulated, known as “Big Bang, the trading name became “The London Stock Exchange”. In order to facilitate the trading, bringing greater speed and to make it more efficient for members and for customers, LSE launched in 1997 the Stock Exchange Electronic Trading Service (SETS) and also CREST4
settlement service.
3.3.2 Markets of LSE
The London Stock Exchange offers the UK and international companies a number of routes to enter the market and to list
their securities:
Main Market: It offers access to one of deepest capital pool in Europe. According to LSE statistics of September 30, 2010, £20.8 billion has been raised on LSE, of which £17.9 billion raised on the Main Market. There are more than 14,500 debt securities worldwide listed on this market including a number of sovereign issues and well-known companies. The value of debt securities exceeds £1.65 trillion, almost a quarter of the £6 trillion total of all securities listed. This leads to an exposure of debt securities to a wide audience of financial markets.
Alternative Investment Market-AIM: AIM is a very successful growth market for smaller companies from UK and across the world. It is launched in 1995 and since that time over 3,000 companies from different countries and sectors have joined AIM with a total of £86 billion raised. Referring to March 2014 data, there are 1,094 companies from all over the world admitted in AIM with an aggregate value of over £78 billion.
Professional Securities Market: The Prospectus Directive, implemented in the UK in July 2005, set up new documentation requirements for securities seeking admission to Regulated Markets in the EEA. In order to offer more flexibility, the LSE enlarged its market structure and created the Professional Securities Market (PSM). This new market offers an alternative documentation system for the issuers of debt, convertibles and depositary receipts (DRs).
Special Fund Market: It is a regulated market by UK’s Financial Conduct Authority (FCA) for specialist investment funds. It provides investment managers a global market with a variety of corporate structures in a flexible regulatory environment. The target groups of this market are institutional, professional and highly knowledgeable investors. It is open to UK and also foreign investment funds which use London to access permanent global capital.
4. Market Data Analysis
The three designated exchanges account for the trading of a major portion of securities from all over the world. At the same time, they differ in the way they operate and in the types of securities they trade. The following is an empirical analysis on some performance indicators for the period from 2010 to 2014, tracked down to show the progress of these exchanges among the ten largest stock exchanges in the world during this period and to capture the trends in order to demonstrate how this valuable source can be channeled into decision-making. The data is held mostly from World Federation of Exchanges and it provides a great statistical significance.
4.1 Largest Stock Exchanges in the World by Market Capitalization
The graph below shows the largest stock exchange operators worldwide by domestic market capitalization of listed companies (in billion US dollars). Market capitalization, is a term used to signify the value of tradable shares of a listed company. It is also known as market cap and it is calculated by multiplying the current price of a share by the number of outstanding shares5. At the end of December 2014, NYSE ranked as the largest stock exchange by domestic market cap
with a value of 19,351 billion and all NYSE companies account for 27,000 billion. The aggregate market cap of NYSE companies is almost equal to the market cap of the listed issuers of next four largest exchanges together.
5Authorized Shares indicate the maximal number of shares that can be issued by a company. The number of authorized shares is
defined at the creation of the company and can only be changed through the vote of shareholders. Authorized shares include Treasury and Outstanding shares.
Treasury- Number of shares, the company keeps in their own treasury for any specified reasons.
Figure 1: Leading stock exchanges by domestic market capitalization Source: World Federation of Exchanges
4.2 Largest Stock Exchanges Worldwide by Value of Shares Traded
The statistic below indicates the largest global stock exchanges ranked by the volume of shares traded from 2010 up to 2014, registered in Electronic Order Book (EOB).
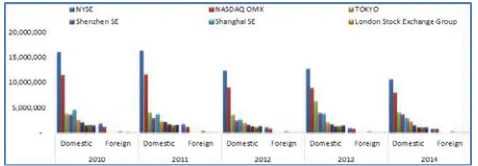
The Figure 2 shows the EOB volume of shares trading in total (in billions of US Dollars), while the Figure 3 compares the EOB domestic trade volume with the trading volume of foreign firms listed in the respective exchanges.
Figure 2: Leading stock exchanges by volume of EOB share trading Source: World Federation of Exchanges
In 2014, the total NYSE volume of share trade, including the negotiated deals is around 15,000 billion US dollar. The NYSE traded EOB security shares are worth around 11,300 billion US dollars followed by NASDAQ OMX with a total traded value of almost 9,000 billion US dollars. Although it is still the global leader in equity trading, the NYSE shows in 2014 a decrease of 37% compared to the trade value of 2010 (17,796 billion US dollars).
Figure 3: Domestic versus foreign trading value Source: World Federation of Exchanges
4.3 Largest Stock Exchanges by Volume of Global Stock Trading Shares
The statistic below shows the number of trades in global stock markets which are registered in the Electronic Order Book. In 2014, the largest stock exchange by the number of equity trade is NASDAQ OMX compared to LSE, which is the last of the top ten exchanges.
Figure 4: Number of EOB trades in equity Source: World Federation of Exchanges
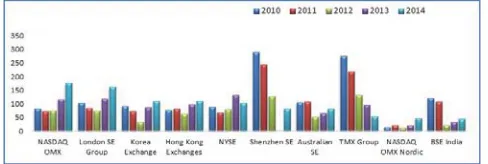
4.4 Largest Stock Exchanges Worldwide by Number of Company IPOs
In order to trade its shares, the company is firstly required to undergo a flotation, thus to have made its Initial Public Offering (IPO) on that particular exchange. An IPO is a stock market launch of a company’s stock sale to the general public for the first time. After the initial offering of their stocks, the companies cease to be private enterprises, whose shares are owned and traded privately and become publicly traded companies. IPOs are made for various reasons; smaller sized companies may want to be listed on any exchange in order to raise capital needed for further expansion. Other bigger companies that are of considerable size may want to take advantages of improvement and diversification in securities based exchanges and also of increased public awareness by undergoing initial public offerings. IPOs may also be unsuccessful, in particular when the stocks fail to trade up on the first day or stagnate in the following period, which leads to the loss of investors’ confidence in the company and as the result the stock price may decrease significantly.
The statistic below shows the ten leading stock exchanges in the world by the number of new companies listed through IPOs. At the NASDAQ OMX, there are in total 176 new companies registered, and in LSE there are 163 IPOs, where 24 of them are foreign deals. According to NYSE 2014 data6, the NYSE raised more than 70,000 billion US dollar
in IPOs and it has 32 new technology listings with 29,000 billion US dollar in proceeds. NYSE lists the largest IPO of all time, that of Alibaba Group Holding Ltd, which raised 25,000 billion US dollar. In 2012, LSE topped the European list with 73 company IPOs and the Shenzhen Stock Exchange led China stock market with 129 company IPOs. At that year, the total volume of IPOs in Europe was 263 amounting to an offering value of around 10.93 billion Euros and the total volume of IPOs in China was 239 amounting to an offering value of around 29.5 billion US dollars.
Figure 5: Number of worldwide initial public offerings Source: World Federation of Exchanges
4.5 Largest Stock Exchanges by Number of Publicly Traded Companies
The statistic below represents the total number of listed companies on the ten leading stock exchanges, ranked as of the end of December 2014. In December 2014, BSE India topped the list of the stock exchanges in Asia- Pacific region and worldwide with 5,542 listed companies and it is followed by the Canada-based TMX Group with 3,761 companies. However, 90% of Dow Jones Industrial Average, 78% of S& P 500 or 77% of the Fortune 500 are companies listed on the NYSE. Regarding LSE, in 2014 it listed around 2,500 companies, where 837 were foreign ones from 68 different countries, making LSE the most international of all exchanges.
Figure 6: Number of listed companies
Source: World Federation of Exchanges, www.londonstockexchange.com
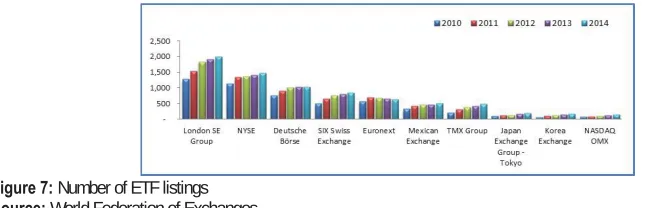
4.6 Largest Stock Exchanges in the World by Number of ETFs
London Stock Exchange Group is the global leader in ETF listings with almost 2,000 ETFs, while NYSE Arca leads the US market in ETFs with over 1,400 ETF listings. According to the figure below, the NASDAQ OMX lists only 150 ETFs, being the last in top-ten ranking.
Figure 7: Number of ETF listings Source: World Federation of Exchanges
4.7 Largest Stock Exchanges by Number of Trades In ETFs
Referring to the table below, the Mexican Exchange shows a dramatic change in number of ETF trades from 2010 (276,000) to 2014 (963,720,000). Following the trend of only the three exchanges which we analyze, the number of trades in ETFs tend to move slightly upwards and downwards over the years.
Table 7: Number of trades in ETFs listings
Stock Exchange 2010 2011 2012 2013 2014
Mexican Exchange 276 547 709 780.893 963.720
BM &FBOVESPA 197 578 993 1.139 533.146
NASDAQ OMX 248.011 365.503 232.276 222.712 269.087
NYSE 228.171 235.686 133.490 134.584 181.979
Korea Exchange 8.014 30.508 30.350 34.320 27.329
Shanghai SE 6.977 4.363 4.359 8.446 10.546
TMX Group 10.160 8.670 7.569 6.279 6.536
London SE Group 4.570 5.126 4.200 4.375 4.967
Shenzhen SE 2.944 2.403 3.066 3.704 3.560
5. Concluding Remarks
Today, business leaders have many options to take into consideration when they decide for an initial public offering. The selection of an appropriate stock exchange is a long-term strategic decision that is primarily determined by the firm’s major business drivers.
The scope of this research encompassed three main components of stock market in US and Europe. It provided evidence on the performance of NYSE, NASDAQ and LSE exchanges with the emphasis on some key indicators from 2010 to 2014 and it brought forth some distinct conclusions. Overall we come to the conclusion that the stock exchanges are reliable barometers which could be used to define economic growth of a country. The analysis also proved the progress of the three exchanges during the chosen period.
In the future, further studies are projected to include the Asian stock markets. Furthermore, a deep analysis will be conducted both qualitatively and quantitatively with the focus on price volatility and price correlation among exchanges, on liquidity and also on technology and systems used to prove whose reaction is more tandem with those seen globally. It would also be interesting to examine the regulatory environment and corporate governance requirements.
References
Ernst & Young Report. (2007). IPO insights comparing global stock exchanges.
Huang, R. & Stoll, H. (1996). Dealer versus Auction Markets: A paired comparison of execution costs on NASADAQ and the NYSE. Journal of Financial Economics, 313-357.
Schwartz, R. A., & Francioni, R. (2004). Equity Markets in Action: The Fundamentals of Liquidity, Market Structure & Trading. New York: John Wiley & Sons
Websites
www.nyse.com
www.londonstockexchange.com www.nasdaq.com
www.world-exchanges.org www.sec.gov/