Predicting 3D forces of disc tool and soil disturbance area using fuzzy logic
model under sensor based soil-bin
Farman Ali Chandio
1,2,
Yaoming Li
1*,
Lizhang Xu
1,
Zheng Ma
1,
Fiaz Ahmad
1,3,
Do Minh Cuong
4,
Imran Ali Lakhiar
1(1. School of Agricultural Equipment Engineering, Jiangsu University, Zhenjiang, Jiangsu 212013, China; 2. Department of Farm Power and Machinery, Faculty of Agricultural Engineering, Sindh Agriculture University,
Tandojam, 70060 Sindh, Pakistan;
3. Department of Agricultural Engineering, Bahauddin Zakariya University, Multan 60800, Pakistan; 4. University of Agriculture and Forestry, Hue University, Hue 54000, Vietnam)
Abstract: A knowledge-based fuzzy logic model was developed on experimental data and used to predict the draft, side and vertical forces and soil disturbance area by disc tillage tool operation. The laboratory research work was conducted to evaluate the performance of the disc tool at three working speeds (1.25 m/s, 1.98 m/s and 2.47 m/s,respectively) and depths (0-5 cm, 5-10 cm and 10-15 cm, respectively) on paddy soil under soil-bin environment. Further, draft (Fx), side (Fz) and vertical (Fy) forces of disc and soil disturbance area were assessed and predicted towards working speeds and depths. A fuzzy prediction model with two input variables (speed and depth) and four output variables was developed and the Mamdani inference approach was used. Draft, side and vertical forces of disc and soil disturbance area were positively responded 0.97, 0.95 and 0.84 and 0.99, respectively. The prediction results showed a close relationship between measured and predicted data. Similarly, the measured and predicted results revealed that the draft, side, vertical forces, and soil disturbance area slightly increased, while increasing the speed and depth of the disc tool. Furthermore, disc forces and soil disturbed area were highly significant (p<0.05) for higher speed towards depth. It was concluded that the fuzzy model may be introduced for predicting the disc forces and soil disturbance area during the disc tillage tool operation with high accuracy.
Keywords: disc tillage tool, ANN fuzzy model, 3D forces, sensor, soil bin, soil disturbance area
DOI: 10.25165/j.ijabe.20201304.5115
Citation: Chandio F A, Li Y M, Xu L Z, Ma Z, Ahmad F, Cuong D M, et al. Predicting 3D forces of disc tool and soil disturbance area using fuzzy logic model under sensor based soil-bin. Int J Agric & Biol Eng, 2020; 13(4): 77–84.
1 Introduction
The tillage process is known to the mechanical treatment of soil to improve soil structure and to develop favorable seedbed for crop growth[1,2]. It improves the soil fragmentation of aggregates and soil structure by mixing and overturning[3,4]. The forces of tillage equipment play an important role in the consideration of design agricultural tools and operators their proper matching of tillage tools during the field conditions. Design, fabrication, and evaluation of tillage tools performance and their energy requirements during operation has been of great concern to engineers and farmers as this has a very important effect on the
Received date: 2019-04-26 Accepted date: 2020-05-15
Biographies: Farman Ali Chandio, PhD, Post-Doc Fellow, research interests: design of modern agricultural machinery, Email: [email protected]; Lizhang Xu, PhD, Professor, research interests: design and research of modern agricultural machinery, Email: [email protected]; Zheng Ma, PhD, Associate Researcher, research interests: design and research of modern agricultural machinery, Email: [email protected]; Fiaz Ahmad, PhD, Assistant Professor, research interests: agricultural mechanization engineering, Email: [email protected]; Do Minh Cuong, PhD, Lecturer, research interests: agricultural mechanization engineering, Email: [email protected]; Imran Ali Lakhiar, PhD Scholar, research interests: soil and water conservation, Email: [email protected];
*Corresponding author: Yaoming Li, PhD, Professor, research interest: design and research of modern agricultural machinery. Jiangsu University, School of Agricultural Equipment Engineering, Zhenjiang 212013, Jiangsu, China. Tel: +86-13805283656; Email: [email protected], [email protected].
efficiency of tillage operations. Studies have been useful in using instrumentations for measuring and evaluating forces, energy requirements and extent of soil failure under rotary tillage[5-8]. Soil-bin facilities are usually employed for such controlled studies. The use of microcomputer-based data acquisition and control system has greatly enhanced data collection and processing and ensured better monitoring of the parameters varied during the experiments in the soil-bins[5-8].
angle on forces acting on a single-disc type no-till seeder opener. The empirical methods are laborious and time-consuming whereas soft computing technique is known as an integrated area of research in computational sciences. Currently, different soft computing techniques, such as statistical method, machine learning, deep learning, and Artificial Intelligence (AI) are being used for exploratory data analysis. Thus, artificial intelligence techniques (neural network and fuzzy computing) have been exploiting and gaining attention in the modeling of the soil-tillage tool and soil-machine interaction[21,22].
Fuzzy inference is the definite procedure of mapping from a known set of inputs to an output variable based on a set of fuzzy rules. The identification of fuzzy rules is the core of fuzzy modeling. There are four primary units (fuzzification, knowledge base, inference engine, and defuzzification) which are considered obligatory for the true application of any fuzzy modeling approach[23-26]. Fuzzy rules have two parts: circumstances of the independent variable (s) are described in the first part whereas in second part dependent variable (s)[24,22].
Currently, fuzzy inference systems are extensively used in various areas of agriculture, water management, and processing industry. Mamdani approach fuzzy modeling approach has been used to investigate the relationship between tire working parameters and soil compaction characteristics and to illustrate how the fuzzy expert system might play an important role in the prediction of soil[22]. The fuzzy model correctly predicted the penetration resistance, lasting pressure with mean relative error 3.35%, 7.76%, and 2.98%, respectively. Similarly, Marakoglu and Carman[27] also designed a Mamdani fuzzy knowledge-based logic model to forecast soil loosening and draft efficiency in tillage operation. The model showed a mean relative error of 2.41% for soil loosening and 2.68% for draft efficiency. Abbaspour-Gilandeh[28] studied for predicting soil fragmentation during tillage operation using a fuzzy logic approach.
Some studies were carried out the interaction of soil-forces of tillage tools but no review was found which properly pointed out the comparative study of experimental results and predicted ANN model disc; disc tool forces acting on paddy soil towards different plowing depths and speeds under soil bin conditions. There are many benefits of field experiments but experimental conditions are very difficult to manage at field circumstances of Nanjing. Soil-bin is mostly used to simulate a field condition for studies because it has many advantages in studying the interaction of disc tools and soil.
This study aimed to evaluate the draft, vertical, side forces and soil disturbed area of the single-disc type of disc (Plough) tillage tool forces acting on paddy soil using a soil bin condition and develop a fuzzy knowledge-based model using the Mamdani approach to predicting the forces and soil disturbed area.
2 Materials and methods
2.1 Experimental setup
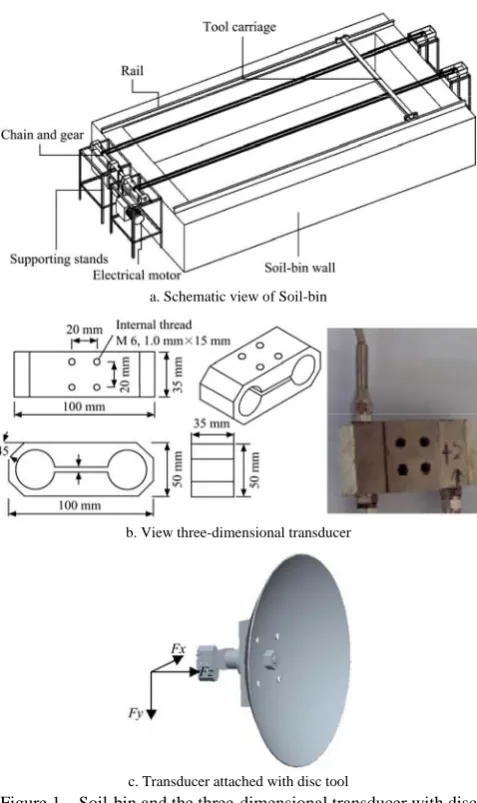
The paddy soil was taken from Jiangpu Experimental Farm and placed in a soil bin (Figure 1a) for experiments. The soil bin experimental tests were conducted at the Soil Mechanics Lab, Department of Agricultural Mechanization, College of Engineering, Nanjing Agricultural University. A 250 cm wide, 600 cm long and 78 cm deep soil bin filled with paddy field soil to the depth of 50 cm was used. Soil-bin was equipped with a carriage track system to allow the movement of the tillage tool along its length. Vertical steel rod connected with a disc tool, which was made holes
(5 cm, 10 cm, 15 cm, 20 cm, 25 cm, 30 cm, 35 cm and 40 cm) for adjusting and controlling the depths of the tillage tool. A variable high-speed motor was connected to the soil-bin carriage for controlling the tool forward speed. Similarly, depths of disc tool and tool angle were controlled by adjusting the vertical position of the rectangle tool steel rod with the frame. The single-disc tool was attached with leg assembly which was designed to maintain a specific tillage depth and tool angle. The leg assembly was connected to the carriage system of soil bin that can provide various disc speeds. The disc was set at an angle of 25° for maximum penetration into the soil[29].
a. Schematic view of Soil-bin
b.View three-dimensional transducer
c. Transducer attached with disc tool
Figure 1 Soil-bin and the three-dimensional transducer with disc tool
2.2 Soil preparation
Table 1 Experimentation parameters of disc tillage tool and soil condition under soil-bin
Parameters Values
Diameter of disc/cm 55.1
Depths of disc tool/cm 0-15
Speed of disc tillage tool/m·s-1 1.25, 1.98 and 2.47 Texture/% Silt-clay soil (47 silt, clay 42 and 11 loam)
Disc angle/(°) 25
Moisture content of soil/% 18
Bulk density/g·cm-3 1.41
Soil internal frictional angle/(°) 32
Soil cohesion/kPa 6.86
Cone index of soil/kPa 211, 311, 352
2.3 Transducer placement and measurement set-up
The three-dimensional transducer was placed between the leg and disc in order to measure forces in three dimensions as horizontal (Fx), side (Fz) and vertical (Fy) (Figures 1b and 1c)[26]. The load cell designated as LSR-2A (2 kN, Shanghai, Zhendan Sensor, and Instrument Factory, China) was fixed in between leg and disc rolling shaft to measure draft, lateral and vertical forces. The double extended octagonal ring (DEOR) transducer (Figure 1) was developed by referring to different equations[9,10,19]. Hence, forces on the disc were measured at three speeds 1.25 m/s, 1.98 m/s and 2.47 m/s (50 r/min, 80 r/min and 100 r/min) three operating depths (5 cm, 10 cm and 15 cm).
2.4 Soil disturbance area
After each test run, the soil disturbance area in the soil profile[19,30] was measured by the profile meter. The scale was placed over the disturbed soil surface to measure the disturbance height. At the same time, disturbance width was also measured at the same location. Soil disturbance area was measured at 0-5 cm, 5-10cm and 10-15 cm, respectively.
2.5 Fuzzy logic modeling
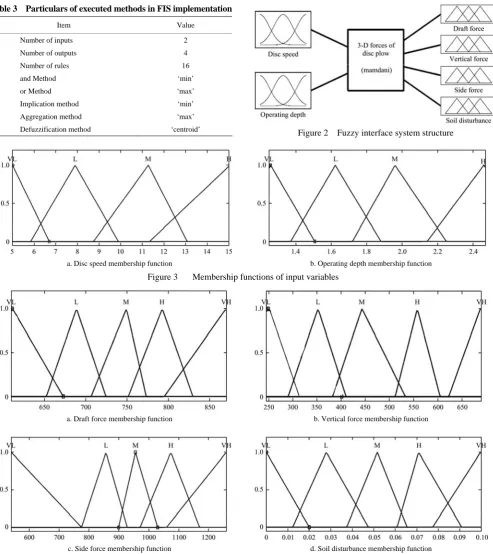
Fuzzy logic modeling was performed by MATLAB 7.10 (fuzzy logic toolbox) for MS Windows which executed the fuzzy set theory. To predict 3D forces (draft force (DF), vertical force (VF) and the side force (SF)) and soil disturbance in fuzzy interface system (FIS), disc speed (DS) and the operating depth of disc (OD) were the input variables (Figure 2). The linguistic inputs variables VL (very low), L (low) (L), M (middle) (M), H (high) and VH (very high) were used for the fuzzification of these variables. Mamdani max-min inference for inference system was considered.
The membership function plot of every element of X was membership value that ranged between 0 and 1 value. The triangular type membership functions (trimf) were applied for both input and output variables as it is considered more accurate[28] (Figure 3 and Figure 4). The fuzzification processes of parameters were completed by the following functions. These formulas were determined using measurement values.
1 1 1 :1.25 2.47 ( ) 0 : i i DS i otherwise ≤ ≤ ⎧ ⎫ = ⎨ ⎬
⎩ ⎭ (1)
1 2
2
: 5 15
( ) 0 : i i OD i otherwise ≤ ≤ ⎧ ⎫ = ⎨ ⎬
⎩ ⎭ (2)
1 1
1
: 425 1000
( ) 0 : i o DF o otherwise ≤ ≤ ⎧ ⎫ = ⎨ ⎬
⎩ ⎭ (3)
1 2
2
: 250 700
( ) 0 : i o VF o otherwise ≤ ≤ ⎧ ⎫ = ⎨ ⎬
⎩ ⎭ (4)
1 3
3
: 540 1260
( ) 0 : i o SF o otherwise ≤ ≤ ⎧ ⎫ = ⎨ ⎬
⎩ ⎭ (5)
1 4
4
: 0.01 0.06
( ) 0 : i o SD o otherwise ≤ ≤ ⎧ ⎫ = ⎨ ⎬
⎩ ⎭ (6)
Membership functions and their preliminary values of membership functions based on the available knowledge and the experimental results. In general, the following equation represents the triangular membership function mathematically[23].
0, , ( ; , , ) , 0, x a x a
a x b b a
f x a b c
c a
b x c c b c x ≤ ⎧ ⎫ ⎪ − ⎪ ⎪ ≤ ≤ ⎪ ⎪ − ⎪ = ⎨ − ⎬ ⎪ ≤ ≤ ⎪ ⎪ − ⎪ ⎪ ≤ ⎪ ⎩ ⎭ (7)
The above expression can be presented in a more comprehensive form as follow;
( ; , , ) max min x a c, x ,0 f x a b c
b a c b
⎡ ⎡ − − ⎤ ⎤
= ⎢ ⎢ ⎥ ⎥
− −
⎣ ⎦
⎣ ⎦ (8)
The a and c parameters were at the base of the triangle whereas b parameter was at the peak of the triangle. Fuzzy logic contains the conditional statements which were formulated by If-Then rule statements. A single fuzzy If-Then rule supposes the form:
IF x is A THEN y is B (9) where, A and B are linguistic values defined by fuzzy sets on the ranges (UoD) X and Y, respectively.
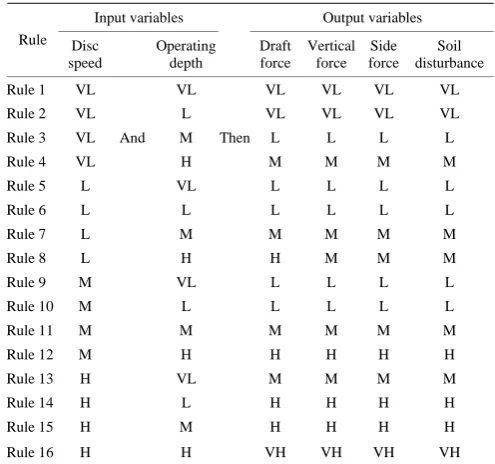
A total of 16 rules were generated using IF and Then rules. Parts of fuzzy rules are presented in Table 2. The inputs were disc speed (cm), operating depth (cm) and output draft force (N), vertical force (N), side force (N) and soil disturbance (m2) received from fuzzy logic toolbox from MATLAB 7.10 software. The crisp values of output variables were found out from the aggregate output fuzzy set in the last step of FIS implementation. In this study, a common center of gravity (COG) method was used for executing the defuzzification step. Defuzzification is the technique to generate a quantifiable result in fuzzy logic. The comprehensive information of input/output variables and methodology in each step of the Fuzzy Inference System (FIS) execution to develop model are presented in Table 3.
Table 2 Fuzzy inference system rules
Input variables Output variables Rule Disc speed Operating depth Draft force Vertical force Side force Soil disturbance
Rule 1 VL VL VL VL VL VL
Rule 2 VL L VL VL VL VL
Rule 3 VL And M Then L L L L
Rule 4 VL H M M M M
Rule 5 L VL L L L L
Rule 6 L L L L L L
Rule 7 L M M M M M
Rule 8 L H H M M M
Rule 9 M VL L L L L
Rule 10 M L L L L L
Rule 11 M M M M M M
Rule 12 M H H H H H
Rule 13 H VL M M M M
Rule 14 H L H H H H
Rule 15 H M H H H H
Table 3 Particulars of executed methods in FIS implementation
Item Value
Number of inputs 2
Number of outputs 4
Number of rules 16
and Method ‘min’
or Method ‘max’
Implication method ‘min’
Aggregation method ‘max’
Defuzzification method ‘centroid’
Figure 2 Fuzzy interface system structure
a. Disc speed membership function b. Operating depth membership function Figure 3 Membership functions of input variables
a. Draft force membership function b. Vertical force membership function
c. Side force membership function d. Soil disturbance membership function Figure 4 Membership functions of output variables
3 Results and discussion
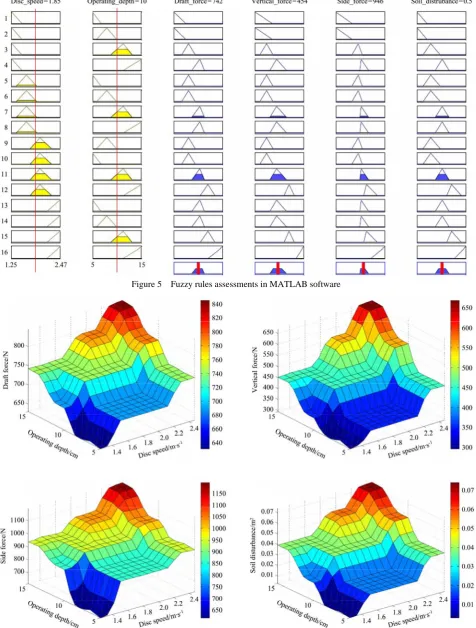
The knowledge-based model was designed and used input variables (disc speed, operating depth) and dependent factor (draft force, vertical force, side force and soil disturbance area) (Figure 5). Figure 6 expresses the fuzzy rules applied for the present study and the prediction process for a specific condition. Fuzzy rules were based on the experimental results. For instance, for the disc speed of 1.85 m/s, the operating depth 10 cm and the outcome results of draft force (746 N), vertical force (454 N), side force (946 N) and soil disturbance (0.024) were based on the fuzzy rules in a fuzzy system. The measured values of draft, vertical and side forces during the soil bin test of the disc tool for the object to validate the
FIS model are presented in Figure 5.
The comparison between FIS results and measured results has been shown in Figure 6. The correlation between measured and predicted values of the draft, vertical, side forces and soil disturbance in disc speed and an operating depth of the disc Figures 7-10. A significant positive correlation coefficient was found in draft force, vertical force, and side force 0.97, 0.95, 0.84 and 0.99, respectively.
3.1 Experimental and predicted disc tool forces acting on paddy soil under soil bin conditions
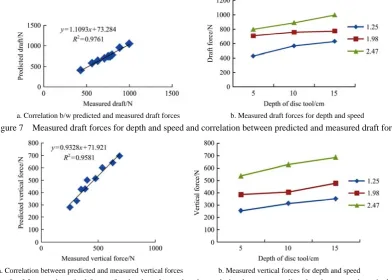
depths (5 cm, 10 cm and 15 cm) is presented in (Figures 7-9). Experimental results showed that the draft, vertical and side forces varied from 429 N to 997 N, 253 N to 687 N and 544 N to 1249 N towards 1.25-2.47 m/s for 5-15 cm. The highest magnitude of the draft force of the disc tool was obtained towards 2.47 m/s for 15 cm.
The increase in disc tool speed has more effect on side force as compared to increasing depth. The speed impact on the magnitude of side force became more dominant especially when the disc was running on the highest experimental depth of 15 cm. Moreover, a good trend was obtained to compare the predicted value and the measured values.
Figure 5 Fuzzy rules assessments in MATLAB software
a. Correlation b/w predicted and measured draft forces b. Measured draft forces for depth and speed
Figure 7 Measured draft forces for depth and speed and correlation between predicted and measured draft forces
a. Correlation between predicted and measured vertical forces b. Measured vertical forces for depth and speed
Figure 8 Measured vertical forces for depth and speed and correlation between predicted and measured vertical forces
a. Correlation between predicted and measured side forces b. Measured side forces for depth and speed
Figure 9 Measured side forces for depth and speed and correlation between predicted and measured side forces
Figures 7-9 compare the trained results of acting forces of the disc on the soil surface and ANN model with the corresponded experimental results. The high relationship of the trained results with the measured results would be linear lined. Similarly, the obtained results from the FIS results subjected more accurate results than the predicted correlations, while the correlation was found in the draft force, vertical force, and side force 0.97, 0.95 and 0.84. Figures 7-9 showed that the developed model corresponds with the experimental results.
The results indicated that decreasing disc speeds and depth tool decreasing the plowing draft, vertical and side forces. According to Li[34] who found that the highest draft force (1531 N) of subsoilers subjected towards 0.8 m/s for 35 cm in soil-bin condition. The difference in draft, vertical and side force concerning disc speeds and depths were statistically significant (p<0.05) on 2.47 m/s at 15 cm. Furthermore, correlation of draft, vertical and side force predicted and measured results were 0.97, 0.95 and 0.84. This is due to the vertical component of the high internal friction forces between stagnant soil and the soil slices invert by the time, the acceleration force, and the adhesion force between soil slice and the disc. Though, it was difficult to assess each result component separately. The trained result of the model showed a good agreement with the experimental measurements.
This is supported by Saleh and Ayman[31] who developed an Artificial Neural Network model for predicting the plowing performance of plowing tines using the error back propagation learning algorithm. The Artificial Neural Network model (ANN) results showed a good agreement with the corresponding experimental data where the relative error is found in the order of ±2%. Predicted draft force values by the FIS model were compared with the measured draft force values by soil bin tests. It was revealed that predicated values slightly higher than measured but a similar trend was observed towards higher depths and speeds of disc tool. This is consistent with Akbarnia[32] who concluded that the developed Artificial Neural Network (ANN) model for prediction of draft requirements of winged share tillage tools with a mean relative error (0.56) and mean square errors (0.049). Ahmad et al.[32] also concluded that the Mamdani approach fuzzy logic approach provided substitutes under the selected experimental conditions. Similarly, according to Mari[19] mentioned that the draft, vertical and side forces represented direct relationship with speeds and depths of disc tillage tool under straw incorporation soil in soil-bin.
penetration into the soil and overturning of soil for the increase in the magnitude of vertical forces with speed and time[34,35]. Such an increasing relationship between vertical force and speed was also reported in many studies[33]. Although these forces were found smaller as compare to the side forces the variation trend with speed and depth remained the same as observed for side forces. The difference inside force concerning disc speeds and depths were statistically significant (p<0.05) on 2.47 m/sat 15 cm. At this depth, more surface area was exposed to the soil which increased disc soil interaction that ultimately caused increased in force[36]
speed and depth significantly influenced the draft and vertical forces of the disc type furrow openers[33,35].
3.2 Soil disturbance area influenced by Disc tool
The cross-sectional area of soil disturbed by a single pass of the disc is shown in (Figure 10). Increasing the speed of the disc tool from 1.25 m/s to 2.47 m/s increased the soil disturbance area from 0.18 m2 to 0.30 m2. Similarly, predicted results (Figure 10b)
were showed that speed and depth of disc tillage tool were increased, while increased the soil disturbance area towards 2.47 m/s for 15 cm. The maximum soil disturbance area was observed towards 15 cm for 2.47 m/s.
a. Correlation between predicted and measured soil disturbance
b. Surface soil disturbance by FIS at depth and speed
Figure 10 Surface soil disturbance by FIS at depth and speed and correlation between predicted and measured soil disturbance
Moreover, the soil disturbance area of R2 (0.99) was computed from the fuzzy model. This is consistent with Abbaspour-Gilandeh and Sedghi[37] who mentioned that Predicting soil fragmentation during tillage operation and found R2=0.988 which was significantly higher than regression modeling. These observations occur with Jia[36] who concluded that tillage depth has a more significant effect on soil disturbance rate than cutter spacing under the test levels. These results in agreement with Vozka[38], they studied at soil bin to evaluate that soil disturbance area observed more disturbed of soil with disc and moldboard plow.
4 Conclusions
The draft, vertical and side disc forces of disc tool increased the speed and depth. The highest experimental draft, vertical and side forces observed at the maximum experimental speed and depth.
Mamdani approach fuzzy logic intelligent model was developed to predict 3D forces of disc plow and soil disturbance during disc operation in paddy soil under soil bin conditions. A significant positive correlation coefficient was found in draft force, vertical force, and side force 0.97, 0.95, 0.84 and 0.99, respectively. The soil disturbance area increased with an increase in the depth of operation, the largest soil disturbance area was observed at greater speed and depth. A great depth of disc tool improves the physical properties for providing the platform for seed germination. The developed model can present itself as an alternative and useful tool for soil-tool interaction study. FIS model used fuzzy and imprecise variables under real field conditions and can be helpful to decrease the machine testing cost.
Acknowledgements
This work is financially supported by the National Key Research of Development Program of China (Grant No. 2016YFD0702004), the National Natural Science Foundation of China (Grant No.51605196), the Jiangsu Key Research and Development Program of China (Grant No. BE2016356), the Natural Science Foundation of Jiangsu Province of China (Grant No. BK20160532), the National Science Foundation for Post-doctoral Scientists of China (Grant No. 2016M591788) and Natural Science Foundation of the Higher Education Institutions of Jiangsu Province, China (Grant No.17KJB416003).
[References]
[1] Olatunji O M. Modeling the effect of weight, draught and speed on the depth of cut of disc plough during ploughing. M.Tech. Thesis, Department of Agricultural and Environmental Engineering, Rivers State University of Science and Technology, Port Harcourt, Nigeria, 2007; 102p. [2] Claude C. Farm Machinery. 10th Edn., Granada Publishing Ltd.,
Technical Book Division Frogmore, St. Albans, Berts., A. 122NF, 1984; pp.10–24.
[3] Six J, Elliott E T. Paustian, K. Soil macroaggregate turnover and microaggregate formation: a mechanism for C sequestration under no tillage agriculture. Soil Biol and Biochem, 2000;32(14): 2099–2103. [4] Al-Kaisi M M, Yin X. Tillage and crop residue effects on soil carbon and
carbon dioxide emission in corn-soybean rotations. J Environ Qual, 2005; 34: 437–445.
[5] Odey S O, Manuwa S I. Development of Profilometer for Measuring Area of Soil Disturbance by Narrow Tillage Tools. IJRES, 2018; 6(1): 26–32, 39.
[6] Odey S O, Ovat F A, Orok O O. Draughts, Power Requirements and Soil Disruption of Subsoilers. Int. J. of Em Eng Res & Tech, 2018; 6(9): 24–38, 40.
[7] Odey S O, Manuwa S I. Design Steps of Narrow Tillage Tools for Draught Reduction and Increased Soil Disruption. A Review. Agric Eng. Int: CIGR Journal, 2016; 18(1): 91–102.
[8] Odey S O, Manuwa S I, Ewetumo T. Instrumentation assembly for measuring draughts of subsoilers in outdoor soil bin facility. IJRES, 2018; 6(2): 1–10.
[9] Godwin R J, O’Dogherty M J, Saunders C, Balafoutis A T. A force prediction model for mouldboard ploughs incorporating the effects of soil characteristic properties, plough geometric factors and ploughing speed. Biosyst Engg, 2007; 97: 117–129.
[10] O’Dogherty M J. The design of octagonal ring dynamometers. J Agric Engg Res, 1996; 63: 9–18.
[11] Zhang J I, Kushwaha R L. A modified model to predict soil cutting resistance. Soil & Till Res, 1995; 34(3): 157–168.
[12] Godwin R J. A review of the effect of implement geometry on soil failure and implement forces. Soil & Till Res, 2007; 97: 331–340.
[13] Sahu R K, Raheman H. An approach for draft prediction of combination tillage implements in sandy clay loam soil. Soil & Till Res, 2006; 90: 145–155.
of the remolded soil cutting test. Soil & Till Res, 2014; 137: 58–66. [15] Lindwall C W, LarneF J, Johnston A M, Moyer J R. Crop management
in conservation tillage systems. In: Unger, P W (Ed.), Managing Agricultural Residues. CRC Press, BocaRaton, USA, 1994; pp.185–209. [16] Hanna H M, Melvin S W, Pope R O. Tillage implements operational
effects on residue cover. Appl Engin in Agric, 1995; 11: 205–210. [17] Kepner R A, Bainer R, Barger E L. Principle of farm machinery. Delhi:
CBS Publishers and Distributors, 1987; 582p.
[18] Rahman S, Chen Y. Laboratory investigation of cutting forces and soil disturbance resulting from different manure incorporation tools in a loamy sand soil. Soil Till Res, 2001; 58: 19–29.
[19] Irshad A M, Farman A C, Ji C, Arslan C, Asma S, Tagar A A, Fang H. Performance and evaluation of disc tillage tool forces acting on straw incorporation soil. Pak. J. Agri. Sci, 2014; 51(4): 855–860.
[20] Malasli M Z, Celik A. Disc angle and tilt angle effects on forces acting on a single-disc type no-till seeder opener. Soil & Till Res., 2019; 194: 104304. https://doi.org/10.1016/j.still.2019.104304.
[21] Okayasu T, Morishita K, Terao H, Mitsuoka M, Inoue E, Fukami K O. Modeling and prediction of soil cutting behavior by a plow. In: CIGR-Ag Eng. Agriculture & Engineering for a Healthier Life, 23, Valencia, 2012; 84-615-9928-4.
[22] Carman K. Prediction of soil compaction under pneumatic tires a using fuzzy logic approach. J. Terrramech, 2008; 45(4): 103–105.
[23] Zadeh L A. Fuzzy sets. Inform. Control, 1965; 8: 338–353.
[24] Abbaspour-Gilandeh Y, Rasooli-Sharabiani V, Khalilian A. Effects of tillage methods on soil fragmentation in loamy-clay soils. Am. J. Agric. Biol. Sci, 2009; 4(2): 131–136.
[25] Allahverdi N. Expert Systems: An artificial intelligence application. Atlas Press, Istanbul, 2002; 248p.
[26] Lakhiar I A, Gao J, Sayed T B, Chandio F A, Buttar N A, Qurashi W A. Monitoring and control systems in agriculture using intelligent sensor techniques: A review of the aeroponic system. Hindawi, J. of Sensors, 2018; 2: 8672769, 18p. https://doi.org/10.1155/2018/8672769 3. [27] Marakoglu T, Carman K. Fuzzy knowledge-based model for prediction
of soil loosening and draft efficiency in tillage. J. Terrramech, 2010;
47: 173–178.
[28] Abbaspour-Gilandeh Y, Sedghi R. Predicting soil fragmentation during tillage operation using fuzzy logic approach. J. Terrramech, 2015; 57: 61–69.
[29] Bentaher H, Hamza E, Kantchev G, Maalej A, Arnold W. Three-point hitch mechanism instrumentation for tillage power optimization. Biosyst Engg, 2008; 100: 24–30.
[30] Ademosun O C, Akande L O, Manuwa S I, Ewetumo T. Development of liquid animal manure injector equipment with instrumentation for draught measurement of tillage tools. J of Agri; Engg and Techn (JAET), 2014; 22(1): 9–18.
[31] Saleh, B, Ayman A A. Artificial neural network model for evaluation of the ploughing process performance. Int. J. of Control, Automation and System, 2013; 2(2): 1–11.
[32] Akbarnia A, Mohammadi A, Farhani F, Alimardani R. Simulation of draft force of winged share tillage tool using artificial neural network model. Agric Eng Int: CIGR J, 2014; 16(4): 57–65.
[33] Ahmad F, Weimin D, Qishuo D, Hussain M, Jabran K. Forces and straw cutting performance of double disc furrow opener in no-till paddy soil. PLoS One, 2015; 10: e0119648. doi: 10.1371/journal.pone.0119648. [34] Li B, Xia R, Liu F Y, Chen J, Han W T, Han B. Determination of the
draft force for different subsoiler points using discrete element method. Int J Agric & Biol Eng, 2016; 9(3): 81–87.
[35] Ahmad F, Weimin D, Qishou D, Rehim A, Jabran K, 2017. Comparative performance of various disc-type furrow openers in no-till paddy field conditions. Sustainability, 2017; 9: 1143. doi: 10.3390/su9071143. [36] Jia H L, Jiang X M, Yuan H F, Zhuang J, Zhao J L, Guo M Z. Stalk
cutting mechanism of no-tillage planter for wide/narrow row farming mode. Int J Agric & Biol Eng, 2017; 10(2): 26–35.
[37] Abbaspour-Gilandeh Y, Rasooli-Sharabiani V, Khalilian A. Effects of tillage methods on soil fragmentation in loamy-clay soils. Am. J Agric Biol Sci, 2009; 4(2): 131–136.