A Wireless Sensor Network-Based Defence Model against
Selective Forwarding Attack
https://doi.org/10.3991/ijoe.v14i05.8651
Yun Ji
Chongqing College of Electronic Engineering, Chongqing, China
Abstract—Due to low communication costs and convenient deployment, wireless sensor network has been widely applied in various fields. However, it still has some problems in the defence against selective forwarding attacks. To address these problems, this paper proposes a model against selective forward-ing attacks, which is built on the threshold secret sharforward-ing mechanism and adopts the individualized path routing protocol. Through simulation test, this paper studies the effects of attack intensity on the successful transmission rate and communication load under the same network deployment and communication topology but at different node densities and average neighbourhood degrees. The results show that this model can effectively defend against forwarding at-tacks, also saves communication resource, offering a technical reference for similar studies.
Keywords—wireless sensor, individualized path, selective forwarding attack, defence
1
Introduction
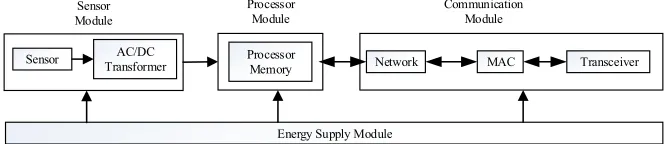
Wireless sensor network (WSN) [1-2] consists of a large number of sensor nodes with wireless communication and computing capabilities deployed in the work area in a self-organized manner [3-5]. Its endings can sense and examine the external world, which greatly expands human’s ability to perceive the outside world. Therefore, it is widely applied in many fields, such as environmental protection, national defence and military affairs, medical and health services and earthquake relief work [6]. The com-position of a WSN is shown below:
Fig. 1. Composition of wireless sensor network
Sensor TransformerAC/DC Processor Memory Network MAC Transceiver
Energy Supply Module Sensor
The first condition for the normal operation of a WSN is to ensure that the infor-mation collected by the sensing module is accurate and reliable when being trans-formed, analysed and transmitted [7-8]. Therefore, the security of network communi-cations is crucial. However, due to its formation characteristics, WSN is vulnerable to various kinds of external and internal attacks such as eavesdropping and tampering during wireless communications [9]. Among them, selective forwarding attack is a kind of attack pattern by which the attacker located in the vicinity of the data trans-mission path obstructs, interferes with or blocks the normal delivery of information, causing key data to be lost [10-11]. This attack is very secretive and poses a serious threat to the security of an infinite sensor network [12]. In order to prevent selective forwarding attacks to the wireless sensor network, scholars at home and abroad have done a lot of research [13-14]. However, the current research methods still have many problems, like great communication overheads, occupancy of large storage space and not enough resistance to ensure accurate data transmission.
The SPREAD scheme based on the (T, N) threshold secret sharing mechanism proposed by Lou [15] has certain resistance against the joint attack of malicious nodes. However, communication resources are seriously wasted as large amount of duplicate information is transmitted. This paper draws on the idea of secret sharing in the SPREAD scheme and proposes a selective forwarding defence model based on individualized path to handle selective forwarding attacks and save communication resources.
2
Defence mechanism against selective forwarding attacks
2.1 Event division
In the event region i, the secret Di is split into Ti shares and transmitted through Xi
paths; j represents network node; kj is the only key to the node j. Di is divided as shown in equation (1):
(1)
!!!!! means the shares that node j needs to transmit, where !!! is the split
infor-mation of the secret Di with equal length (t=0,1, …, Ti-1). After the division, in the event region i, there will be Xi paths for data share transmission. As long as the base
station receives Ti shares, it can obtain a complete secret Di
The data share can be successfully delivered to the base station if and only if there is no packet loss caused by the malicious node along the path where the data share is delivered. Therefore, the probability Pi of each data share of the secret Di in the event
region i being successfully transmitted to the base station is shown in equation (2):
(2)
1
0 1 1
( ) (
...
i)mod
1,2,...,
i
T
i i i
j j T j
f k
d d k
d k
!pj
N
!
=
+
+ +
"
1
1,2,...
1
i
h
i
n
dp
P
i
M
N
!
"
=
%
#
&
$
#
From equation (2), we can see that the number of malicious nodes n, packet loss probability Pd and node distance vector hi are the three important factors that affect the successful reception of data. And the probability of successful reception decreases with the increase of these three factors.
The probability of the secret Di being successfully received is:
(3) Due to the randomness of network deployment, the number of network nodes is different in different event regions and the shares Ti of data divided are also different. As can be seen from the above formula, when the number of nodes and the probabil-ity of each data share being successfully transmitted are constant, the probabilprobabil-ity Pi
that the secret Di is successfully received increases with Ti decreasing. But the smaller
Ti is, the higher the communication cost will be, so the value of Ti should consider both security strength and communication cost.
In addition, the successful transmission rate of secrets can be expressed with the Beta function:
(4) Suppose Pexp is the expected probability of the secret Di being successfully
trans-mitted, then the reasonable value range for Ti should be as shown in equation (5):
(5)
2.2 Routing protocol
In order to minimize the damages to the split data shares by malicious nodes, the greedy algorithm is used to find the neighbour that satisfies the conditions with the smallest distance vector from the neighbour table as the point for the next hop so as to make each data share forwarded by different intermediate nodes if possible. Suppose the execution node is x, then the following algorithms are involved:
(1) Sending algorithm: find a neighbour that satisfies the following conditions, starting from the beginning of the neighbour table:
1) Hop count ! x.hop;
2) The event region is not x.eventid;
3) No share of x.eventid related event has been forwarded. (2) Forwarding algorithm:
1) Find the sender node according to the sender id in the neighbour table;
2) Find, from the beginning of the neighbour table, a neighbour that satisfies the following conditions:
a Hop count < x.hop;
b The event region is not sender.eventid;
(
)
i(1
)
ii
X
i k X k
i i i i
k T
X
P k T
p
p
k
!=
"
#
$
=
%
&
!
'
(
)
(
)
i( ,
1)
i i p i i i
P k T
!
=
I T X T
"
+
exp
(
)
(
1)
i i i i
c No share of sender.eventid related event has been forwarded. (3). Monitoring algorithm: over-hearing
In the execution process of the sending algorithm and forwarding algorithm, the priority is as follows: the neighbour meeting the three conditions is given the first priority; otherwise the first neighbour is regarded as the routing node for the next hop.
3
Performance analysis
The hypothetic base station in this paper has sufficient storage space, strong com-puting capability and adequate power supply and is safe and reliable. The EIDs of all the nodes are controlled by the base station, and the attacker can capture any other node except in the base station. The performance of the above strategy is analysed from such aspects as storage load, communication load and security.
3.1 Computation and storage loads
The calculation of the secret split shares Ti can be done at the base station or in the
background. For a common sensor, regarding the secret Di, only one Ti -1-order poly-nomial needs to be calculated, whose calculation amount depends on Ti, which is smaller than the number of nodes Xi, so the calculation overhead is not large. In route
selection, the neighbour table needs to be searched. The size of the neighbour table is determined by the density and communication distance of the network. Generally speaking, the neighbour degree d is a few to a few dozens, so the routing algorithm is not computationally intensive. Regarding the storage space, the EIDs of the shares forwarded by routing protocols and nodes need to be stored, and the EID length is less than the node ID, so the storage space is not large.
3.2 Communication load
Node traffic is mainly determined by the data shares transmitted to the base station. Suppose the average distance vector is hi, and the data length is L, then the most eco-nomical communication traffic Cb is calculated as follows:
(6) Suppose the split isometric information !!! of the secret Di is of the same length li
as the node-calculated shares, then,
L=TiliL. When all shares are normally delivered to the base station, the maximum amount of information is
(7)
1
M b i
i
C
h L
=
=
!
1 M b i iC
h L
=
=
!
1
M p i i i
i
C
h X l
=
Therefore, the total communication rate is
(8) As can be seen, Rc decreases with Ti increasing, that is, the communication load decreases as the number of data shares decreases.
3.3 Security
In the path design, the dynamic routing affected by the order of communication be-tween nodes is adopted, which makes it harder for the attackers to launch attacks. In addition, as each node shares a unique key with the base station, without knowing the key, even if the malicious node collects all the relevant data shares, it still cannot recover the secret Di. At the same time, data shares will not be tampered with by a few malicious nodes. Even if the shares of the data forwarded are tampered with, the base station still can identify them through the redundant shares.
4
Test and results
4.1 Test environment
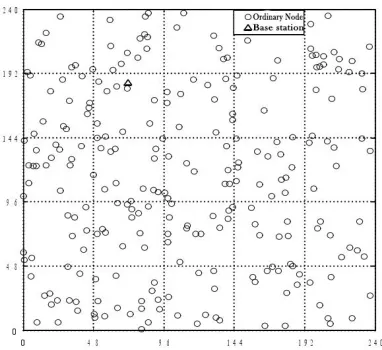
The 250 nodes are randomly and uniformly deployed on a 240 " 240m2 area, which is divided into 25 event regions. Let the base station ID be 0 and the location random.
Fig. 2. Node deployment and event region division in the simulation experiment
1
1
M i i
i
p i
M b
i i
X
h
T
C
Rc
C
h
=
=
=
=
!
As the base station is trusted, malicious nodes are randomly assigned among the remaining nodes. In the simulation experiment, each time the locations of malicious nodes are different. Multiple rounds of experiments are performed with different parameters adjusted. In each round of experiment, the statistical average of 500 simu-lation results is used as the experimental result. In the simusimu-lation experiment, for simplicity, this paper does not consider the data tempering by malicious nodes, and corrects the communication load according to the successful transmission rate P, which is Rc/P.
4.2 Test results
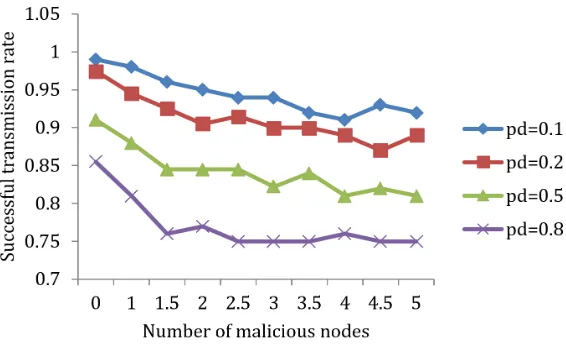
Test 1: Under the same network deployment and communication topology, analyse the impacts of attack intensity on the successful transmission rate and communication load.
Given d=20, X=10 (X=250, M=25) and Pexp=0.85, and the malicious packet loss
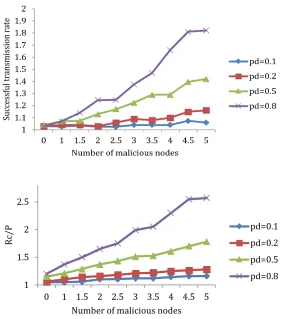
rates are 0.1, 0.2, 0.5 and 0.8, respectively, 4 rounds of simulation tests are performed, with the results shown in Fig.3 and Fig.4.
Fig. 3. Effects of different attack intensities on the successful transmission rate
Fig. 4. Effects of different attack intensities on the communication load
Test 2: Effects of attack intensity on the successful transmission rate and commu-nication load under different node densities.
In this experiment, N nodes in the network are adjusted and the average number of nodes Xi is changed, in order to test the impacts of attack intensity on the successful transmission rate and communication load under different node densities. Let N be 200, 250 and 300, respectively, and then Xi is 8, 10 and 12. The malicious packet loss rate is fixed at 0.5, while d is maintained at 20. The results are shown in Fig.5 and Fig.6.
Fig. 5. Effects of attack intensity on the actual successful transmission rate under the condition of node density in different event regions
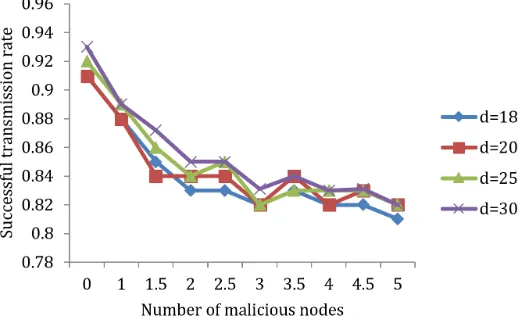
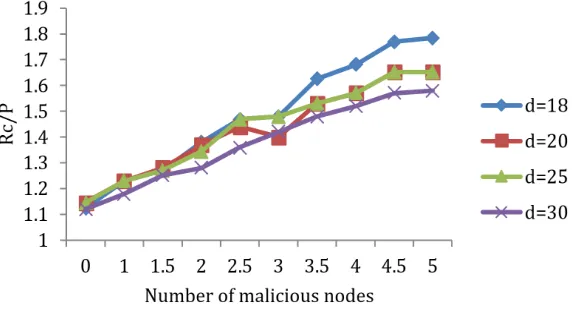
Test 3: Effects of attack intensity on the successful transmission rate and commu-nication load under different average neighbourhood degrees
The simulation is performed, given X=10, Pexp=0.85, Pd=0.5 and d is 18, 20, 25 and 28. The results are shown in Fig.8 and Fig.9.
The value of Ti has considered the impact of communication hops, and the average neighbourhood degree d mainly affects the number of communication hops, so it can be seen from the figure that the average neighbourhood degree d has little effect on the successful transmission rate and communication load. When d increases, the dis-persion of the data share delivery path becomes better, which in turn makes the com-munication load smaller.
Fig. 8. Effects of attack intensity on the communication load under different node neighbour degrees
5
Conclusions
Based on the threshold secret sharing mechanism, this paper designs individualized path routing to defend against the selective forwarding attacks in the wireless sensor network. Through simulation test, it studies the effects of attack intensity on the suc-cessful transmission rate and communication load under the same network deploy-ment and communication topology but at different node densities and average neigh-bourhood degrees. The following conclusions are obtained:
1.The successful transmission rate does not continuously drop with the number of malicious nodes and packet loss probability increasing; the communication load is still less than 3 even with the unsuccessful transmission excluded.
2.The node density has little impact on the successful transmission rate, and the communication cost increases with the number of nodes decreasing.
3.The average neighbourhood degree has little impact on either the successful trans-mission rate or the communication load. The communication load decreases with the average neighbourhood degree increasing.
6
References
[1] Akyildiz, I.F., Su, W., Sankarasubramaniam, Y. Cayirci, E. (2002). Wireless sensor net-works: a survey. Computer Networks, 38(4), 393-422. https://doi.org/10.1016/S1389-1286(01)00302-4
[3] Liu, M., Zheng, Y., Cao, J., Chen, G., Chen, L., Gong, H. (2007). Eadeeg: an energy-aware data gathering protocol for wireless sensor networks. Journal of Software, 18(5), 1092-1109. https://doi.org/10.1360/jos181092
[4] Orito, E., Utani, A., Yamamoto, H. (2009). Pheromone-oriented routing protocol for load balancing of wireless sensor networks with multiple sinks (intelligent sensing and control). Journal of Japan Society for Fuzzy Theory & Intelligent Informatics, 21(1), 56-68.
https://doi.org/10.3156/jsoft.21.56
[5] Rawat, P., Singh, K.D., Chaouchi, H., Bonnin, J.M. (2014). Wireless sensor networks: a survey on recent developments and potential synergies. Journal of Supercomputing, 68(1), 1-48. https://doi.org/10.1007/s11227-013-1021-9
[6] Zhu, Y.H., Wu, W.D., Pan, J., Tang, Y.P. (2010). An energy-efficient data gathering algo-rithm to prolong lifetime of wireless sensor networks. Computer Communications, 33(5), 639-647. https://doi.org/10.1016/j.comcom.2009.11.008
[7] Sheu, J.P., Sahoo, P.K., Su, C.H., Hu, W.K. (2010). Efficient path planning and data gath-ering protocols for the wireless sensor network. Computer Communications, 33(3), 398-408. https://doi.org/10.1016/j.comcom.2009.10.011
[8] Ramanan, K., Baburaj, E. (2010). Data gathering algorithms for wireless sensor networks: a survey. International Journal of Ad Hoc Sensor & Ubiquitous Computing, 1(4), 393–422.
https://doi.org/10.5121/ijasuc.2010.1410
[9] Bo, Y., and Bin,X. (2006) “Detcting selective forwarding attacks in wireless sensor net-works” in Parallel and Distributed Processing Symposium, 2006. IPDPS 2006. 20th Inter-national, 8, 2006.
[10] Xiao B., Yu, B., Gao, C.S. (2007). CHEMAS: Identify suspect nods in selective forward-ing attacks, Journal of Parallel and Distributed Computforward-ing, 67(11), 1218-1230.
https://doi.org/10.1016/j.jpdc.2007.04.014
[11] Kim C. Tao, W., Shin Kim, K. (2010). An empirical study of customers’ perceptions of security and trust in e-payment systems. Electronic Commerce Research and Applications, (9), 84-95. https://doi.org/10.1016/j.elerap.2009.04.014
[12] Kurt G., Hacioglu, G. (2010). Ethics as a customer perceived value driver in the con-text of online retailing. African Journal of Business Management, 4(5), 672-677.
[13] Slovic, P., Finucane, M.L., Peters, E. (2004). Risk as Analysis and Risk as Feelings: Some Thoughts about Affect, Reason, Risk, and Rationality. Risk Analysis, 24(2), 311-322.
https://doi.org/10.1111/j.0272-4332.2004.00433.x
[14] Sathye, M. (1999). Adoption of Internet banking by Australian consumers: an empirical investigation. International Journal of Bank Marketing, 17(8), 324-334.
https://doi.org/10.1108/02652329910305689
[15] Lou, W., Liu, W., Fang Y. (2004). “SPREAD: Enhancing data confidentiality in mobile ad hoc networks, IEEE INFOCOM 2004, HongKong, China, March 2004.
7
Author
Ji Yun received B.Sc. degree and M.Sc. degree from Chongqing University and Chongqing Normal University. Now he is a lecturer in Chongqing College of Elec-tronic Engineering. His main research interest is in elecElec-tronic information engineer-ing.