Optimisation of process parameters for vacuum concentration
and foaming behaviour of Aloe vera (Aloe barbadensis Miller) gel
Suryakanta Mahapatra
1, Prem P. Srivastav
1, Kumaresh Halder
2*(1. Indian Institute of Technology, Kharagpur, West Bengal-721302;
2. National Institute of Food Technology Entrepreneurship and Management, Kundli, Sonepat-131028, HR)
Abstract: This study on Aloe vera gel was conducted to investigate the optimum condition for vacuum concentration in relation to its physicochemical properties and optimum foaming condition of the concentrated products which was used as raw material of foam mat drying in order to maximize the retention of valuable components. Twenty experiments were conducted with different combinations of concentration temperature and time using factorial design for numerical optimisation of the independent variables. Solutions obtained for numerical optimisation of vacuum concentration covering the criteria as temperature 55°C and time 60 min were- ascorbic acid 4.095 mg/100 g, total soluble solids 3.6 °Bx, total solids 3.7%, acidity 0.0698% (as malic acid) and pH 4.97. For optimising the foaming behavior of concentrated Aloe vera gel, 16 experiments were conducted using different selected additives and their proportionate mixtures [viz. pectin, glycerol monosterate and methyl cellulose (1:1), egg albumin and methyl cellulose (1:1), pectin and methyl cellulose (1:1)] in the concentration range of 0.25 to 1% (w/w). The optimum foaming conditions were obtained numerically in relation to foaming density (0.39 g cm-3), drainage volume (0.15 mL) and expansion volume (122.53%) covering the criteria as pectin and methyl cellulose (1:1) with concentration of 1% (w/w). The experimental values during validation of responses were found at par with the numerical solutions (p<0.001) and it showed that the valuable components of fresh Aloe vera gel can be preserved optimally before foam mat drying by concentrating up to 3.8 °Bx under vacuum and converting the same into stable foam which exhibited foaming density of 0.42 g cm-3, drainage volume of 0.00 mL and expansion volume of 123.21%.
Keywords: optimisation, Aloe vera gel, vacuum concentration, temperature, time, foam expansion, foam stability
Citation: Mahapatra, S., P. P. Srivastav, and K. Halder. 2017.Optimisation of process parameters for vacuum conentration and foaming behaviour of Aloe vera (Aloe barbadensis Miller) gel. Agricultural Engineering International: CIGR Journal, 19(2): 149–158.
1 Introduction
Aloe vera (Aloe barbadensis Miller) is widely used
and popular medicinal plant belongs to the Liliacea
family. The fresh aloe vera gel is a transparent
mucilaginous material which is found in thick walled
parenchyma cells of the leaves. It does not possess any
specific colour, odour but it contains several natural
beneficial substances (Ramachandra and Rao, 2008;
Chandegara and Varshney, 2013). Aloe vera is widely
used in food industry as functional component for foods
like health drinks, aloe beverages and tablets (Eshun and
Received date: 2016-02-23 Accepted date: 2017-03-13 * Corresponding author: Kumaresh Halder, National Institute of Food Technology Entrepreneurship and Management, Kundli, Sonepat-131028, HR. Email: [email protected].
He, 2004; Ramachandra and Rao, 2008; Ahlawat and
Khatkar, 2011). Aloe vera has certain applications as
flavouring agent and preservative in few food products
(Christaki and Florou-Paneri, 2010).
Fresh Aloe vera gel is converted into various products
like powder, flakes etc. by heating, concentration, drying
and grinding (Ramachandra and Rao, 2008) to increase
the stability as well as to use the products effectively in
different applications. The freshly extracted gel is highly
perishable and proper technologies with great care during
processing are required to improve its stability and
functionality (Swami Hulle et al., 2014; Chandegara and
Varshney, 2013). Improper processing may cause
permanent changes to the biologically active chemical
constituents and affect their original structures. These
properties of those biologically active compounds (Eshun
and He, 2004; Chang et al., 2006).
For producing powder or flakes from fresh Aloe vera
gel several dehydration methods like-freeze drying
(Waller et al., 1978; Ratti, 2001), spray drying (Krokida
et al., 2011; Garcia-Cruz et al., 2013; Cervantes-Martínez
et al., 2014), osmo-drying (Simal et al., 2000; Vega et al.,
2007; Garcia-Segovia et al., 2009; Pisalkar et al., 2011)
etc. have been reported earlier. Although spray drying
and freeze drying techniques are known for producing
excellent product with good rehydration properties and
colour, but excessive production and installation costs
restrict for use in large scale commercial applications
(Ratti, 2001; Hsu et al., 2003; Asokapandian et al., 2015).
Foam mat drying has been identified as an important
economical alternative to drum, vacuum, spray and
freeze-drying for the production of food powders (Kadam
et al., 2010; Asokapandian et al., 2015). This is one of the
simple and effective method for drying of heat sensitive
liquid foods (Morgan et al., 1961; Karim and Wai, 1999a;
Kudra and Ratti, 2006; Kandasamy et al., 2014).
In foam mat drying liquid juice is concentrated firstly
(if total solid concentration is not suitable for foam
formation) and suitable foaming agents in appropriate
proportions are incorporated into that. The mixture is then
whipped using special type of mechanical device for
stable foam formation. This is dried in the form of a mat
or thin layer (Karim and Wai, 1999a; Ratti and Kudra,
2006). So, good quality foam and appropriate foaming
process is extremely important for producing high quality
dehydrated product by foam mat drying. The rate of
drying also depends on gas-liquid interface created during
foaming (Kudra and Ratti, 2006; Thirupathi et al., 2008).
So, the addition of foaming agent in appropriate quantity
is required to form good quality stable foam which
ultimately helps to produce a good quality product
(Rajkumar et al., 2007). The finished product is superior
than the drum dried and spray dried product because of its
honeycomb structure, better rehydration properties,
controlled density and better retention of volatiles that
would be lost during the drying of non-foamed materials
(Morgan et al., 1961; Kudra and Ratti, 2006; Thirupathi
et al., 2008).
Actually, foaming of fresh Aloe vera gel is difficult
because it is mainly composed of water (98%-99%).
Major portion (more than 60%) of its dry matter is
composed of polysaccharides (McAnalley, 1993;
Femenia et al., 1999, Garcia-Segovia et al., 2009). This
low soluble solid content in the fresh Aloe vera gel
sample has strong influence on the foaming behavior
especially foam stability which can be improved by
adding suitable amounts of foaming agent and stabilizer
(Karim and Wai, 1999b). However, before foaming, the
concentration of the gel is also important step to decrease
the water content in gel. The behavior of foam prepared
from concentrated Aloe vera gel is important for
producing desired quality dried product. Freeze
concentration, though an ideal method for concentrating
fruit juices has major problems of loss of soluble solids of
juice in the separated ice. Bioactive substances including
polysaccharide and barbaloin are sensitive towards heat
treatment and shows maximum stability at around 70℃
which may decease at either higher or lower temperatures
(Chang et al., 2006). Hence, vacuum concentration was
proposed in this study. It has been found in literature that,
systematic study on vacuum concentration and foaming
of fresh Aloe vera gel is nonexistent.
The aim of this study was to optimize the process
variables for vacuum concentration of Aloe vera gel at
different temperature-time combinations and to optimize
foaming behaviour by studying the effect of different
additives on foaming characteristics of Aloe vera gel for
maximum foam expansion (FE) and stability.
2 Materials and methods
2.1 Sample preparation
Mature leaves of Aloe barbadensis Miller variety
were collected from Indian Institute of Technology,
Agriculture farm as required for the experiments. Efforts
were made to maintain uniformity in leaves used in all
experiments. The leaves were washed under running
water. The Aloe barbadensis Miller leaves were
processed by traditional hand filleted technique. In this
method, the lower 1inch of the leaf base, 2-4 inch of the
tapered leaf top along with the short sharp spines which
sharp stainless steel knife. Then the knife was introduced
carefully into the mucilage layer to remove top and
bottom rind (Choudhary et al., 2014). Along with the
bottom rind some amount of attached mucilage was also
discarded. Pulping of washed fillet and collection of
mucilage were done for further processing. The fillet was
then ground to a liquid and the gel was removed.
2.2 Concentration experiment
The extracted Aloe vera gel (0.9 °Bx) was subjected
to concentration at different temperature (viz. 45°C, 50°C,
55°C and 60°C)and time (viz. 0, 15, 30, 45 and 60 min)
combinations using a batch scale laboratory model
(superfit) rotary vacuum evaporator (750 mL batch-1).
The vacuum was created inside by the rotary vacuum
evaporator which was initially at 760 mm Hg abs. and
increased up to 50 mm Hg abs. as time elapsed. The
effect of concentration time and temperature on different
physico-chemical properties of the juice was studied.
2.3 Optimisation for concentration
Since ascorbic acid (AA) is considered to be the most
heat labile component in the products of plant origin
(Labuza and Riboh, 1982; Johnson et al., 1995), its
maximum retention in the concentrate was taken as
criteria for optimisation of the concentration process
variables. It was assumed that the process parameters
retaining maximum AA will also preserve the other
components maximally. Numerical optimisation was
carried out for the two independent variables (viz.
temperature and time) and five dependent variables [viz.
AA fraction, total soluble solids (TSS), total solids (TS),
acidity and pH] by using Design-Expert program 7.0 of
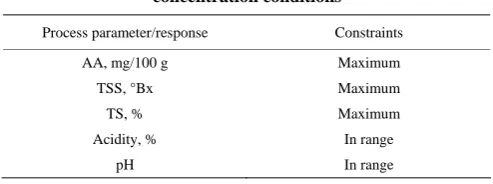
the stat-Ease software. Constraints set for numerical
solution of optimum concentration conditions are shown
in Table 1 below.
Table 1 Constraints set for numerical solution of optimum concentration conditions
Process parameter/response Constraints
AA, mg/100 g Maximum
TSS, °Bx Maximum
TS, % Maximum
Acidity, % In range
pH In range
2.4 Foaming experiment
2.4.1 Continuous foaming device
The laboratory scale continuous foaming device,
consisting of four main parts with mixing jar, motor,
peristaltic pump and a compressor has been developed by
modification of a kitchen grinder (Bag et. al., 2011). The
continuous foaming device was made up with the
principle of volume displacement method. The mixing jar
consists of material inlet, material outlet and three air
inlets. The air inlets were made with 3 copper valve pins.
The material inlet was made with a copper tube having 10
mm outer diameter. The material outlet was made up with
aluminum sheet (thickness 2 mm) and developed in such
a way that the inside width 90 mm and height 17 mm and
the outward length of 50 mm. All the inlets and outlets
were fixed with synthetic adhesive (Araldite). The outlet
was placed at such a position so that the gel must have
sufficient residence time (2 min). A stainless steel
whipping blade was used for agitating the material in the
jar. A pre-calibrated rotameter was installed for
monitoring compressed air flow rate, and a stroboscope
(Strobotac, 1531AB, G R Co., Concord Massachusetts,
USA) was used to measure the rotational speed of the
whipping blade (Bag et. al., 2011).
2.4.2 Foaming trials
Measured quantity (400 mL) of concentrated Aloe
vera gel samples of varied TSS content (°Bx) was taken
into the vessel of the foaming device. A pre-determined
quantity of foaming agent [viz. pectin, glycerol
monostearate (GMS) and methyl cellulose (MC) (1:1),
egg albumin (EA) and methyl cellulose (MC) (1:1),
pectin and methyl cellulose (MC) (1:1)] dispersed in Aloe
vera gel (suspension). Then the material was sucked at a
constant flow rate (100 mL min-1) into the whipping jar
by a peristaltic pump. Compressed air was then allowed
to pass through three sides of the vessel at a constant rate
(10 L min-1) and the whipping blade also rotating at a
constant speed (3400 rpm). The air flow and the rotation
of the whipping blade were stopped simultaneously after
the desired time period. The foamed gel samples were
gradually escaped out of the foaming device after a
particular residence time (2 min) and analyzed. All the
experiments were done at controlled room temperature
which varied between 25℃-29℃. The foaming properties,
by measuring foam density (FD) and drainage volume
(DV) respectively.
2.4.3 Optimisation for foaming
Numerical optimisation was carried out for the
process parameters for foaming of Aloe vera gel
concentrate to obtain the best result. The results of
experimental data were confirmed by deriving numerical
solution. Design-Expert program 7.0 of stat-Ease
software was used to perform numerical operation and
simultaneous optimisation of the multiple responses.
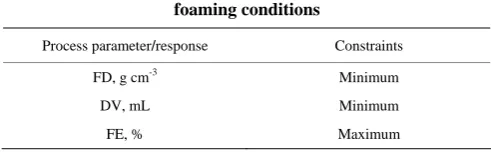
Constraints set for numerical solution of optimum
foaming conditions are shown in Table 2 below.
Table 2 Constraints set for numerical solution of optimum foaming conditions
Process parameter/response Constraints
FD, g cm-3 Minimum
DV, mL Minimum
FE, % Maximum
2.5 Quality parameters for analysis
2.5.1 FD
50 mL of the foam was weighed and filled in a
graduated measuring cylinder (50 mL). Foam was
transferred to cylinder without destroying the foam
structure and avoided trapping of voids (Karim and Wai,
1999a). The experiments were performed in triplicate to
minimize error for each batch of foam preparation and
average values were noted.
2.5.2 DV
The method for foam drainage was earlier described
by Sauter and Montoure (1972) and later on by Raju and
Pal (2009). In the present experiment slight modification
to that method has been done and used to measure foam
DV for testing the foam stability. In this, the foam filled
into a Buchner filter (80 mm) was placed on a 25 mL
graduated cylinder. The liquid juice (mL) which
separated from the foam as a result of drainage was
collected in a measuring cylinder. The amount of juice
collected in the cylinder after an hour time was recorded
as DV (Bag et al., 2011).
2.5.3 FE
The percent FE was calculated from the height/depth
of material in the vessel before and after whipping using
following Equation (1).
PE(%)=
Height of material after foaming Initial height of the material Initial height of the material
−
100
× (1) 2.5.4 Moisture content
Vacuum oven drying method as described by
Ranganna (1995) was used to determine the moisture
content. Samples (3-5 g) in triplicate were dried to an
apparent dryness in a vacuum oven at 70°C at vacuum
level not exceeding 450 mm Hg abs. The loss of weight
was expressed as percent wet basis (wb).
2.5.5 TS and TSS
TS content was calculated by subtracting the moisture
content from 100. Contents of TSS in Aloe vera gel
samples were determined by hand refractometer having
range 0-32 °Bx.
2.5.6 Acidity
Acidity of Aloe vera gel was measured Ranganna
(1995) and expressed in terms of malic acid. Known
weight of the pulp was transferred to 50 mL conical flask
for preparation of sample solution. Then the Aloe vera gel
was filtered to remove the solid materials. 10 mL of this
solution was taken; few drops of phenolphthalein
indicator were added to it and titrated against 0.1 N
NaOH solutions till the colour of end point of pale pink.
Acidity was expressed as per cent malic acid using the
following Equation (2).
Acidity as anhydrous malic acid(%)=
Titre Normality of alkali Equivalent weight of acid 100 Volume of filtrate taken for titration weight of sample 1000
× × ×
× ×
(2)
In this equation, the equivalent weight of malic acid is
67.
2.5.7 AA
AA was determined by the 2, 6-dichlorophenol
indophenols visual titration method (AOAC, 1984). Five
to seven grams of juice was dissolved in 100 mL of 3%
metaphosphoric acid. Known quantity of this solution
was titrated with the standard dye solution and AA as
mg/100 g of sample was calculated as Equation (3):
AA (mg/100 g)=
Titre value dye factor volume made up 100
Aliquot of extract taken for titration weight or volume of sample
× × ×
×
Dye factor is mg of AA per mL of dye. This was
estimated by standardizing the dye before titration with
standard AA solution (AOAC, 1984).
3 Results and discussions
3.1 Vacuum concentration of fresh Aloe vera gel
Fresh Aloe vera gel extracted by hand filleting
technique was taken for vacuum concentration. The
experiments for vacuum concentration were carried out at
different temperature (viz. 45°C, 50°C, 55°C and 60°C)
and time (viz. 0, 15, 30, 45 and 60 min) combinations.
3.1.1 Effect of process variables on physico-chemical
properties during vacuum concentration
3.1.1.1 TSS
The effect of temperature and time on TSS content of
Aloe vera gel juice during concentration has been shown
below in Figure 1. The increase in TSS followed a linear
relationship for greater part of the time except at the end
of the cycle where its rate of increase was very low. At
45°C the gel juice could be concentrated up to 2.5 °Bx
only, whereas it was possible to concentrate up to 4.5 °Bx
at 60°C. The time required for achieving juice
concentration of 2.5 °Bx at 45°C and 4.5 °Bxat 60°C
were one hour each. Beyond this period, the rate of
increase in concentration was very small. Moreover, the
material started sticking to the vessel surface and could
not be agitated easily.
Figure 1 Effect of concentration temperature and time on TSS (°Bx) of Aloe vera gel
3.1.1.2 pH and acidity
The pH of Aloe vera gel juice concentrate ranged
from 5.30 to 5.35. A slight decrease in pH was observed
during the concentration process at all concentration
temperatures. The acidity of the Aloe vera gel juice
(0.0268% as malic acid, TS basis) increased slightly with
concentration process.
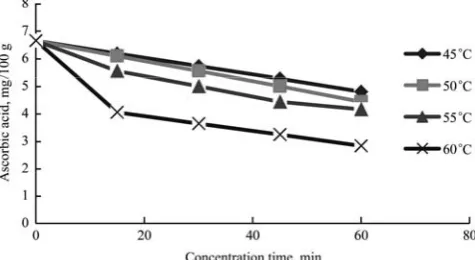
3.1.1.3 AA
The effect of process time and temperature on
retention of AA during concentration of Aloe vera gel
juice is shown in Figure 2. Destruction of AA was
influenced by both temperature and time of processing.
The destruction rate of AA increased with increase in
temperature. At 45°C and 50°C, it followed a linear
relationship for greater part of the concentration cycle,
while at 55°C and 60°C the relationship is nonlinear.
Figure 2 Effect of concentration temperature and time on AA fraction
3.1.2 Optimisation of process variables
Since AA is considered to be the most heat labile
component in the products of plant origin (Labuza and
Riboh, 1982; Johnson et al., 1995), its maximum
retention in the concentrate was taken as criteria for
optimisation of the concentration process variables. It was
assumed that the process parameters retaining maximum
AA will also preserve the other components maximally.
Design-Expert program 7.0 of the stat-Ease software
was utilized and was used to perform numerical operation
and simultaneous optimisation of the multiple responses.
The desired goals for each variable and responses were
chosen (Table 3) to get the different desirability function.
Table 4 shows that software generated five optimum
conditions of independent variables with predicted values
of responses. Solution No.1, having the maximum
desirability value was selected as the optimum conditions
for concentration of Aloe vera gel juice. The solution was
obtained for the optimum concentration condition
covering the criteria as temperature 55°C and 60 min time
of concentration, AA 4.095 mg/100 g, TSS 3.6 °Bx, TS
3.7%, acidity 0.0698% (as malic acid) and pH 4.97. The
Three trails were conducted at optimum conditions to
validate the responses and the experimental values at
temperature 55°C and time 60 min for concentration were
ascorbic acid 4.167 mg/100g , total soluble solids 3.8 °Bx,
total solids 4.0%, acidity 0.0737% (as malic acid) and pH
4.96. The retention of ascorbic acid indicates that
factorial model was appropriate.
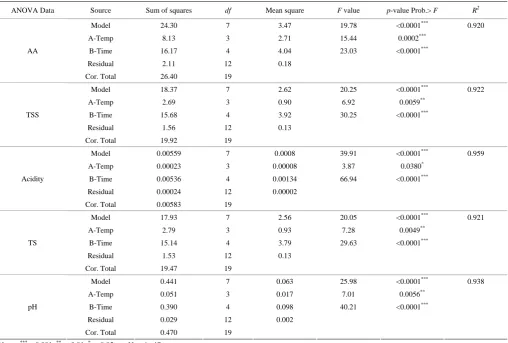
Table 3 ANOVA data for the effect of process variables on all responses during concentration of Aloe vera gel juice
ANOVA Data Source Sum of squares df Mean square F value p-value Prob.> F R2
Model 24.30 7 3.47 19.78 <0.0001*** 0.920 A-Temp 8.13 3 2.71 15.44 0.0002***
B-Time 16.17 4 4.04 23.03 <0.0001*** Residual 2.11 12 0.18
AA
Cor. Total 26.40 19
Model 18.37 7 2.62 20.25 <0.0001*** 0.922
A-Temp 2.69 3 0.90 6.92 0.0059**
B-Time 15.68 4 3.92 30.25 <0.0001*** Residual 1.56 12 0.13
TSS
Cor. Total 19.92 19
Model 0.00559 7 0.0008 39.91 <0.0001*** 0.959 A-Temp 0.00023 3 0.00008 3.87 0.0380*
B-Time 0.00536 4 0.00134 66.94 <0.0001*** Residual 0.00024 12 0.00002
Acidity
Cor. Total 0.00583 19
Model 17.93 7 2.56 20.05 <0.0001*** 0.921
A-Temp 2.79 3 0.93 7.28 0.0049**
B-Time 15.14 4 3.79 29.63 <0.0001*** Residual 1.53 12 0.13
TS
Cor. Total 19.47 19
Model 0.441 7 0.063 25.98 <0.0001*** 0.938 A-Temp 0.051 3 0.017 7.01 0.0056**
B-Time 0.390 4 0.098 40.21 <0.0001*** Residual 0.029 12 0.002
pH
Cor. Total 0.470 19 Notes: ***p<0.001; ** p<0.01; *p<0.05; ns=Not-significant.
Table 4 Numerical solutions for concentration of Aloe vera gel juice
Sl. No. Temp, °C Time, min AA, mg/100 g TSS, °Bx Acidity,% TS,% pH Desirability
1 55 60 4.095 3.6 0.0698 3.7 4.97 0.571
2 50 60 4.484 3.3 0.0733 3.4 4.93 0.571
3 55 45 4.521 3.1 0.0581 3.3 5.06 0.549
4 50 45 4.669 3.0 0.0693 3.1 4.96 0.537
5 45 60 4.910 2.8 0.0616 2.9 5.02 0.526
3.2 Foaming of Aloe vera gel concentrate
Investigations were carried out to check the
performance of Aloe vera gel concentrate for foam
production in the developed continuous foaming device,
determination of optimum operating and machine
parameters for maximum FE and to check the effect of
foaming additives on foaming properties of Aloe vera gel
concentrate.
3.2.1 Effect of additives on foaming properties of Aloe
vera gel concentrate
Samples of Aloe vera gel concentrate were subjected
to whipping. It was observed, during preliminary
experiment, that whipping of Aloe vera gel without any
foaming agent produce very little foam which collapsed
completely within short time at room temperature. When
whipped with foaming agent, an appreciable FE was
obtained, which remained stable over a period of time.
This necessitated the use of a suitable foaming agent and
foaming stabiliser for the formation of stable foam.
3.2.2 Selection of suitable foaming agent
Different chemicals viz. GMS and MC (1:1), EA and
foaming additives for Aloe vera gel concentrate. The
effect of these additives and their concentration on FE
and DV of Aloe vera gel concentrate (3.8 °Bx) are
presented in Figure 3 and Figure 4 respectively. The FE
depended on the type of foaming additives and its
concentration in Aloe vera gel. From Figure 3, it can be
observed that foam expansion increased with the increase
in concentration of GMS and MC (1:1), EA and MC (1:1),
pectin and MC (1:1) from concentration range 0.25%
(w/w) to 1% (w/w).
Figure 3 Effect of type of foaming additives and their concentration on FE or expansion volume of Aloe vera gel
concentrate (3.8 °Bx)
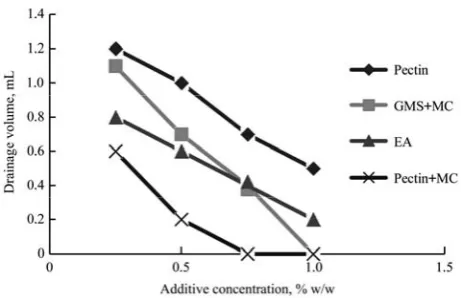
Figure 4 Effect of type of foaming additives and their concentration on DV of Aloe vera gel concentrate (3.8 °Bx)
DV reflects the water holding capacity of foam. It is
one way to check the foam stability and measured by the
volume of liquid juice drains from the foam over a
specific time period (Kampf et al., 2003). The liquid in
foams distributed between thin films and plateau borders.
The difference is known as plateau border suction, leads
to drainage of liquid from thin films to the neighboring
plateau border. Finally, all liquid in the plateau border of
foams are subjected to drain of the liquid from between
the bubbles caused by the action of gravity (Narsimhan,
1991). Drainage is accompanied by a progressive
thinning of lamellae and may, therefore, enhance the
probability of film collapse. The stable foam structure is
desirable for rapid drying and ease of removing the dried
material from the tray. If foams break or drain
excessively, drying time is increased, reducing product
quality (Bag et al., 2011). DV of the foam during the
experiment varied from 0.0 mL to 1.2 mL. DV decreased
with the increase in additive concentration irrespective of
the type of chemical. Maximum DV obtained using
pectin at concentration of 0.25% (w/w). While minimum
DV was found using pectin and MC (1:1) at
concentration of 0.75% (w/w) and 1% (w/w). DV
decreased with the increase in additive concentration
irrespective of the type of chemical (Figure 4).
FD is an important property for determining the
whipping ability of a mixture. This is also related to
amount of air incorporated during whipping process,
because the higher the amount of air incorporated during
whipping, the lower the FD will be and the foam will
have higher whippability (Falade et al., 2003), which is
desirable for good quality foam. FD in this experiment
varied from 0.42to 0.94 g cm-3. Maximum FD obtained
using pectin at concentration of 0.25% (w/w). While
minimum FD was found using pectin and MC (1:1) at
concentration of 0.25% (w/w). This indicates that the
pectin and MC (1:1) helps to reduce the intermolecular
tension on the surface and interfacial tension of the foam
to a level which is sufficient to form the interfacial film
that exceeds the critical thickness (Bag et al., 2011).
Probably at lower concentration of pectin and MC (1:1)
the air bubbles were collapsed because critical thickness
required for interfacial film could not be formed (Karim
and Wai, 1999b). The concentration of pectin and MC
increased till a lowest value of FD is reached at 1%
concentration of pectin and MC. At this concentration the
FD was least. However, increasing the pectin and MC
concentration beyond 1% (w/w), there was increase in FD.
Because beyond that concentration viscosity increases,
probably exceeds the limiting value (maximum air
incorporation is possible at this viscosity) and it has
negative influence in the incorporation of air during
results in reduction of FE or increases FD. Similar
findings have been noted from the study of foam density
of star fruit (Karim and Wai, 1999a; 1999b). For the
additive GMS and MC the FD decreases from 0.76to
0.46 g cm-3. But for pectin and MC, the FD decreases
from 0.56 to 0.42 g cm-3. The reasons can be explained as
described for the mixture of pectin and MC (1:1). In
Figure 5, there is decrease in foam density with increase
in additive concentration.
Figure 5 Effect of type of foaming additives and their concentration on Foam density of Aloe vera gel concentrate
(3.8 °Bx)
3.2.3 Optimisation of foaming process variables
The selected factorial model was used for the
statistical significance of the experimental design and
desirability functions were used for optimum solutions.
The desired goals for each variable and response were
chosen (Table 5) to get the different desirability function.
Table 6 shows that software generated five optimum
conditions of independent variables with predicted values
of responses. The ANOVA data are presented in the
Table 5. In analysis of variance the model F-values
(49.56, 57.04 and 26.38 for FE, FD and DV respectively)
showed that all the models are highly significant (p<
0.001) for all the responses. There exists a 0.01% chance
that a "Model F-Value" this large could occur due to
noise (Asokapandian et al., 2015). The co-efficient of
determination (R2) values for the responses of FE, FD and
DV were 0.971, 0.974 and 0.946 indicating high
proportion of variability was explained by the data and
models of factorial design were adequate. It means that
the values of FE, FD and DV were significant as a
response for varying foaming conditions. From the above
data, it can be interpreted that the selected models can
help us to optimise the conditions for foaming with
significant relationship among the parameters chosen.
The overall desirability value covering the optimum
conditions was 0.998. At this condition, the solution
which had the highest concentration i.e. 1% (w/w) to get
lowest FD, DV, and highest FE values were selected. The
solution for optimum foaming condition covered the
criteria as pectin and MC concentration (1:1) 1% (w/w).
The predicted (theoretical) values were for FD 0.39 g
cm-3, DV 0.15 mL and expansion volume 122.53%
respectively. The observed values (mean of three
measurements) at these optimum conditions for FD, DV
and expansion volume were 0.42 g cm-3, 0.00 mL and
123.21% respectively. This indicates the suitability of the
factorial model for foaming of Aloe vera gel.
Table 5 ANOVA data for effect of process variables on all responses during foaming of Aloe vera gel concentrate
ANOVA Data Source Sum of squares Df Mean square F value p-value Prob > F R2
Model 0.469 6 0.078 57.04 <0.0001*** 0.974 A-Add type 0.394 3 0.131 95.88 <0.0001***
B-Add conc. 0.075 3 0.025 18.19 0.0004*** Residual 0.012 9 0.001
FD
Cor. Total 0.481 15
Model 2.11 6 0.352 26.38 <0.0001*** 0.946 A-Add type 0.85 3 0.283 21.25 0.0002***
B-Add conc. 1.26 3 0.420 31.50 <0.0001***
Residual 0.12 9 0.013 DV
Cor. Total 2.23 15
Model 20387.8 6 3397.9 49.56 <0.0001*** 0.971 A-Add type 15827.7 3 5275.9 76.95 <0.0001***
B-Add conc. 4560.10 3 1520.0 22.17 0.0002***
Residual 617.04 9 68.56 Expansion
volume or FE
Table 6 Numerical solutions for foaming of Aloe vera gel concentrate
Sl. No. Additive type Additive conc., % FD, g cm-³ DV, mL Expansion volume or FE, % Desirability
1 Pectin+MC 1 0.39 0.15 122.53 0.998
2 Pectin+MC 0.75 0.41 0.15 113.52 0.928
3 EA+MC 1 0.45 0.05 106.46 0.919
4 EA+MC 0.75 0.47 0.35 97.44 0.792
5 Pectin+MC 0.5 0.51 0.3 95.15 0.779
4 Conclusions
The study indicated that the extracted Aloe vera gel
(0.9 °Bx) was vacuum concentrated to 3.8 °Bx and
successfully converted into stable foam (123.21%
expansion volume and 0.00 mL DV) using numerically
optimized parameters in relation to several quality
attributes using pectin and MC (1:1) as foaming agent
(1%, w/w). So, the optimized numerical solutions for
vacuum concentration and stable foam formation can be
used to produce good quality Aloe vera gel powder by
foam mat drying.
References
Ahlawat, K. S., and B. S. Khatkar. 2011. Processing, food applications and safety of aloe vera products: a review. Journal of Food Science and Technology, 48(5): 525–533.
AOAC. 1984. Official methods of analysis. 14th ed., Washington, D. C., USA: Association of Official Analytical Chemists. Asokapandian, S., S. Venkatachalam, G. J. Swamy, and K.
Kuppusamy. 2015. Optimization of foaming properties and foam mat drying of muskmelon using soy protein. Journal of Food Process Engineering, 39(6): 3165–3174.
Bag, S. K., P. P. Srivastav, and H. N. Mishra. 2011. Optimisation of process parameters for foaming of beal (Aegle marmelos L.) fruit pulp. Food and Bioprocess Technology, 4(8): 1450–1458. Bikerman, J. J. 1973. Foams. New York, USA: Springer-Verlag. Cervantes-Martínez, C. V., L. Medina-Torres, R. F.
Gonzalez-Laredo, F. Calderas, G. Sánchez-Olivares, E. E. Herrera-Valencia, J. A. Gallegos Infante, N. E. Rocha-Guzman, and J. Rodríguez-Ramírez. 2014. Study of spray drying of the Aloe vera mucilage (Aloe vera barbadensis Miller) as a function of its rheological properties.
LWT-Food Science and Technology, 55(2): 426–435.
Chandegara, V. K., and A. K. Varshney. 2013. Aloe vera L. processing and products: A review. International Journal of Medicinal Aromatic Plants, 3(4): 492–506.
Chang, X. L., C. Wang, Y. Feng, and Z. Liu. 2006. Effects of heat treatments on stabilities of polysaccharides substances and barbaloin in gel juice from Aloe vera Miller. Journal of Food Engineering, 75(2): 245–251.
Choudhary, M., A. Kochhar, and J. Sangha. 2014. Hypoglycemic and hypolipidemic effect of Aloe vera L. in non-insulin dependent diabetics. Journal of Food Science and Technology, 51(1): 90–96.
Christaki, E. V., and P. C. Florou-Paneri. 2010. Aloe vera: a plant for many uses. Journal of Food Agriculture and Environment, 8(2): 245–249.
Eshun, K., and Q. He. 2004. Aloe vera: a valuable ingredient for the food, pharmaceutical and cosmetic industries: a review. Critical Reviews in Food Science and Nutrition, 44(2): 91–
96.
Falade, K. O., K. I. Adeyanju, and P. I. Uzo-Peters. 2003. Foam-mat drying of cowpea (Vigna unguiculata) using glycerol monostearate and egg albumin as foaming agents. European Food Research and Technology, 217(6): 486–491
Femenia, A., E. S. Sanchez, S. Simal, and C. Rossello. 1999. Compositional features of polysaccharides from Aloe vera (Aloe barbadensis Miller) plant tissues. Carbohydrate Polymers, 39(2): 109–117.
García-Cruz, E. E., J. Rodriguez-Ramirez, L. M. Lagunas, and L. Medina-Torres. 2013. Rheological and physical properties of spray-dried mucilage obtained from Hylocereus undatus cladodes. Carbohydrate Polymer, 91(1): 394–402.
Garcia-Segovia, P., C. Mognetti, A. Andres-Bello, and J. Martinez-Monzo. 2009. Osmotic dehydration of Aloe vera (Aloe barbadensis Miller). Journal of Food Engineering, 97(2): 154–160.
Hsu, C. L., W. Chen, Y. M. Weng, and C. Y. Tseng. 2003. Chemical composition, physical properties, and antioxidant activities of yam flours as affected by different drying methods. Food Chemistry, 83(1): 85–92.
Johnson, J. R., R. J. Braddock, and C. S. Chen. 1995. Kinetics of ascorbic acid loss and non-enzymatic browning in orange juice serum: Experimental rate constants. Journal of Food Science, 60(3): 502–505.
Kadam, D. M., R. T. Patil, and P. Kaushik. 2010. Foam mat drying of fruit and vegetable products. In Drying of Foods, Vegetables and Fruits, eds. S. V. Jangam, C. L. Law, and A. S.
Mujumdar, vol. 1, ch. 5: 111–124. Singapore: TPR Group. Kampf, N., M. C. Gonzalez, M. G. Corradini, and M. Peleg. 2003.
259–268.
Kandasamy, P., N. Varadharaju, S. Kalemullah, and D. Maladhi. 2014. Optimization of process parameters for foam-mat drying of papaya pulp. Journal of Food Science and Technology, 51(10): 2526–2534.
Karim, A. A., and C. C. Wai. 1999a. Foam-mat drying of starfruit (Averrhoa carambola L.) puree. Stability and air drying characteristics. Food Chemistry, 64(3): 337–343.
Karim, A. A., and C. C. Wai. 1999b. Characteristics of foam prepared from starfruit (Averrhoa carambola L.) puree by using methyl cellulose. Food Hydrocolloids, 13(3): 203– 210. Krokida, M., A. Pappa, and M. Agalioti. 2011. Effect of drying on
Aloe’s functional components. Procedia Food Science, 1: 1523–1527.
Kudra, T., and C. Ratti. 2006. Foam-mat drying: Energy and cost analyses. Canadian Biosystem Engineering, 48: 327–332. Labuza, T. P., and D. Riboh. 1982. Theory and application of
arrhenius kinetics to the prediction of nutrient losses in foods [degradation, keeping, quality, temperature, quality controls, analysis, models]. Food Technology, 36: 66–74.
McAnalley, B. H. 1993. Process for preparation of aloe products. European Patent WO 89/06539.
Morgan, A. I., L. F. Ginnette, R. P. Graham, and G. S. Willams. 1961. Recent development in foam mat drying. Food Technology, 15(1): 37–39.
Narsimhan, G. 1991. A model for unsteady state drainage of a static foam. Journal of Food Engineering, 14(2): 139–165. Pisalkar, P. S., N. K. Jain, and S. K. Jain. 2011. Osmo air drying of
aloe vera gel cubes. Journal of Food Science and Technology, 48(2): 183–189.
Rajkumar, P., R. Kailappan, R. Viswanathan, and G. S. V. Raghavan. 2007. Drying characteristics of foamed alphonso mango pulp in a continuous type foam mat dryer. Journal of Food Engineering, 79(4): 1452–1459.
Raju, P. N., and D. Pal. 2009. The physico-chemical, sensory and
textural properties of misti dahi prepared from reduced fat buffalo milk. Food and Bioprocess Technology, 2(1): 101–108.
Ramachandra, C. T., and P. S. Rao. 2008. Processing of Aloe vera Leaf Gel: A Review. American Journal of Agrilcultural and Biological Sciences, 3(2): 502–510.
Ranganna, S. 1995. Handbook of Analysis of Quality Control for Fruit and Vegetable Products. New Delhi: Tata McGraw-Hill
Publ. Co.
Ratti, C. 2001. Hot air and freeze-drying of high-value foods: A review. Journal of Food Engineering, 49(4): 311–319. Ratti, C., and T. Kudra. 2006. Drying of foamed biological
materials: opportunities and challenges. Drying Technology, 24(9): 1101–1108.
Sauter, E. A., and J. E. Montoure. 1972. The relationship of lysosyme content of egg white to volume and stability of foams. Journal of Food Science, 37(6): 918–920.
Simal, S., A. Femenia, P. Llull, and C. Rossello. 2000. Dehydration of aloe vera: simulation of drying curves and evaluation of functional properties. Journal of Food Engineering, 43(2): 109–114.
Swami Hulle, N. R., K. Patruni, and P. S. Rao. 2014. Rheological properties of aloe vera (Aloe barbadensis Miller) juice concentrates. Journal of Food Process Engineering, 37(4): 375–386.
Thirupathi, V., S. Sasikala, and P. Rajkumar. 2008. Studies on foam mat drying of whole egg liquid in cabinet dryer. Madras Agricultural Journal, 95(1-6): 141–150.
Vega, A., E. Uribe, R. Lemus, and M. Miranda. 2007. Hot-air drying characteristics of Aloe vera (Aloe barbadensis Miller) and influence of temperature on kinetic parameters. LWT- Food Science and Technology, 40(10): 1698–1707.