Introduction to Microeconomics
The market forces of supply and demand
Introduction to Microeconomics
The market forces of supply and demand
Summary
2
THE MARKET FORCES OF SUPPLY AND DEMAND
Part 1: Market and Competition
Part 1: Market and Competition
Part 2: Demand
Part 2: Demand
Part 3: Supply
Part 3: Supply
Summary
THE MARKET FORCES OF SUPPLY AND DEMAND
Part 1: Market and Competition
Part 1: Market and Competition
Part 2: Demand
Part 2: Demand
Part 3: Supply
Part 3: Supply
Part 4: Demand and Supply together
Markets and competition
4
Market?
MARKETS AND COMPETITION
Definitions
:1. A market is a group of buyers and sellers of a particular good or service.
2. A competitive market is a market in which there are many buyers and many sellers so that each has a negligible impact on the market price.
3. Perfectly competitive markets are defined by two primary characteristics: (1) the goods being offered for sale are all the same, and (2) the buyers and sellers are so numerous that no single buyer or seller can influence the market price.
MARKETS AND COMPETITION
Definitions
:5. A market in which there is only an unique seller, is not perfectly competitive. And such seller is called a monopoly.
6. The market with only few sellers which do not compete very aggressively is called oligopoly .
7. In the case of monopolistic competition, there are many sellers that offer (slightly) different products or services. Hence each seller has its monopoly status in setting retail price.
MICROECONOMIC AGENTS
Firms
– Produce and sell goods and services
– Buy inputs (labor, capital & raw materials)
Consumers
– Buy goods and services
Summary
8
THE MARKET FORCES OF SUPPLY AND DEMAND
Part 1: Market and Competition
Part 1: Market and Competition
Part 2: Demand
Part 2: Demand
Part 3: Supply
Part 3: Supply
Part 4: Demand and Supply together
What determines the quantity and individual
demands?
10
Subsitute s
Completments Price
Income
Prices of related goods
Tastes
WHAT DETERMINES THE QUANTITY AN INDIVIDUAL DEMANDS?
• The quantity demanded of any good is the amount of the good that buyers are willing and able to purchase.
• In economics, five main factors determine demands including:
1. Price
The law of demand states that : Other things equal, when the price of a good rises, the quantity demanded of the good falls
2. Income
Normal goods: the demand for a good falls when income falls
Inferior goods: the demand for a good falls when income rises (bus)
3. Price of related goods
Substitutes: When a fall in the price of one good reduces the demand for another good
Complements: When a fall in the price of one good increases the demand for another good
4. Tastes
THE DEMAND SCHEDULE AND THE DEMAND CURVE
12 Demand curve
Demand schedule
Question: Do you think of any case that the demand curve has upward slope? In such a case, the goods are called as the Giffen goods
Demand
Ice Cream price (10000đ) Quantity (cây) 0,0 12 0,5 10 1,0 8 1,5 6 2,0 4 2,5 2 3,0 0 Quantity (cây) Price (10000đ) 3,0 2
•
•
•
•
•
•
•
4 6 8 10 12
Giá kem (10000đ/cây) Mr.Thà nh (cây) Mr. Phát (cây) Tổng (cây)
0,0 12 7 19 0,5 10 6 16 1,0 8 5 13 1,5 6 4 10 2,0 4 3 7 2,5 2 2 4 3,0 0 1 1
14 + = Lượng kem(cây) Price (10000đ/cây) 3,0 2
•
4 6 8 10 12
2,5 2,0 1,5 1,0 0,5 0 Mr.Thành Price kem (10000đ/cây) Quantity(cây) 3,0 2
•
4 6 8 10 12
2,5 2,0 1,5 1,0 0,5 0 Mr. Phát 7 3 5 Quantity (cây) Giá kem (10000đ/cây)
3,0
2
•
MARKET DEMAND VERSUS INDIVIDUAL DEMAND
• Market demand is the sum of all the individual demands for a
particular good or service.
Shifts in the demand curve
16
Quantity(cây) Price (10000đ)
0
Increase in demand
Decrease in demand D1
D2
Price (1000đ/bao)
a. A shifts in the demand cure
b. A movement along the demand curve Quantity /day Price (1000đ/bao)
•
10 20 30 0•
A policy to discourage smoking
shifts the demand curve D1 D2 A B 12
•
50 300 20 Quantity/day
•
C
A
A tax that raises the price of cigarettes
results in a
movement along the demand curve
SHIFTS IN THE DEMAND CURVE
• We know that demands depend on various factors. Particularly, a change in demand due to any factors rather than price can shift the demand curve to the right or the left.
• For example:
•Any change that raises the quantity that buyers wish to purchase at a given price shifts the demand curve to the right.
•Any change that
TWO WAYS TO REDUCE THE QUANTITY
OF SMOKING DEMANDED
20
Summary
THE MARKET FORCES OF SUPPLY AND DEMAND
Part 1: Market and Competition
Part 1: Market and Competition
Part 2: Demand
Part 2: Demand
Part 3: Supply
Part 3: Supply
Part 4: Demand and Supply together
SUPPLY
22
What determines the quantity and
individual supplies?
Price
Input price
Technology
Supply
Price (10000đ/cây) Mr.Bình (cây) Mr. Minh (cây) Quantit y (cây)
0,0 0 0 0
0,5 0 0 0
1,0 1 0 1
1,5 2 2 4
2,0 3 4 7
2,5 4 6 10 3,0 5 8 13
+ = Quantity (cây) Price (10000đ) 3,0 2
•
4 5 3 1 2,5 2,0 1,5 1,0 0,50 Quantity (cây)
Price (10000đ) 3,0 2
•
4 5 3 1 2,5 2,0 1,5 1,0 0,5 0 Supply of Mr.Bình Supply of Mr.Minh Quantity (cây) Price (10000đ) 3,0 2•
4 5 3 1 2,5 2,0 1,5 1,0 0,528
Quantity (cây) Price (10000đ)
0
SHIFTS IN THE SUPPLY CURVE
Supply curve S1 Supply curve S3
Supply curve S2
Increase in supply
SHIFTS IN THE SUPPLY CURVE
• Analogously to the analysis of demand curve, shifts in the supply curves can be due to a change in any factor rather than the price
affecting the supply curve.
•Any change that raises the quantity that sellers wish to produce at a given price shifts the supply curve to the right.
30
Summary
THE MARKET FORCES OF SUPPLY AND DEMAND
Part 1: Market and Competition
Part 1: Market and Competition
Part 2: Demand
Part 2: Demand
Part 3: Supply
Part 3: Supply
Price (10000đ/cây)
Demand and Supply
Quantity
3,0
2
•
4 6 8 10 12
2,5 2,0 1,5 1,0 0,5 0 7 Surplus
•
•
Quantity ofdemand Quantity of supply
Quantity
3,0
2
•
4 6 8 10 12
2,5 2,0 1,5 1,0 0,5 0 7 Shortage
•
•
Price (10000đ/cây) Demand > Supply
Demand < Supply
Quantity of
Supply Quantity of Demand
Price equilibrium
EQUILIBRIUM
• Around the equilibrium, there is a surplus :
– A surplus a situation in which quantity supplied is greater than quantity demanded;
– in other words, Suppliers are unable to sell all they want at the going price and hence have to cut price towards the equilibrium.
EQUILIBRIUM
• Or a shortage:
– a situation in which quantity demanded is greater than quantity supplied. – Demanders are unable to buy all they want at the going price; hence,
Quantity (cây)
3,0
2
•
4 6 10 12
2,5 2,0 1,5 1,0 0,5 0 7
•
Price (10000đ/cây) New Equilibrium Initial equilibrium D2 D1 Hot weatherEQUILIBRIUM
• The characteristics of the equilibrium:
– At the equilibrium price, the quantity of the good that buyers are willing and able to buy exactly balances the quantity that sellers are willing and able to sell.
– The equilibrium price is sometimes called the market-clearing price because, at this price, everyone in the market has been satisfied: Buyers have bought all they want to buy, and sellers have sold all they want to sell.
EQUILIBRIUM
• The
law of demand and supply
:
– the claim that the price of any good adjusts to bring the supply and demand for that good into balance:
the activities of the many buyers and sellers automatically push the market price toward the equilibrium price.
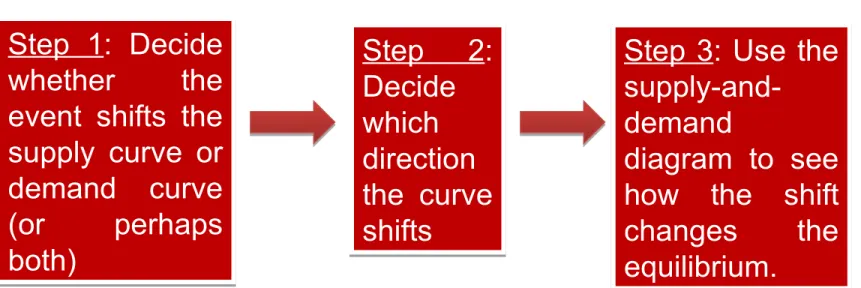
THREE STEPS TO ANALYZING CHANGES IN EQUILIBRIUM
• Concept:
– Comparative static is an analysis and comparison of two static
situations—an old and a new equilibrium
• Three analytical steps
40
Step 1: Decide whether the event shifts the supply curve or demand curve (or perhaps both)
Step 1: Decide
whether the
event shifts the supply curve or demand curve
(or perhaps
both)
Step 3: Use the
supply-and-demand
diagram to see how the shift changes the equilibrium.
Step 3: Use the
supply-and-demand
diagram to see how the shift
changes the
equilibrium.
Step 2: Decide which direction the curve shifts
Step 2:
A shift in demand curve
Shifts in Curves occur when any factor rather than price results in a change in supply and demand.
Shifts in Curves occur when any factor rather than price results in a change in supply and demand.
Movements along Curves show a
change in
quantity supplied
and demanded
due to a change in prices
Movements along Curves show a
change in
quantity supplied
and demanded
due to a change in prices
Other things equal…
A shift in supply curve
42
Any other factor might cause the similar effect on the supply curve ?
A shift in both supply and demand
48
45 thousands found in the first eight months
50