RESEARCH ARTICLE
Correlations Between Tree Thinking
and Acceptance of Evolution in Introductory
Biology Students
J Phil Gibson
1,2*and Mariëlle H Hoefnagels
1,2Abstract
Background: Tree thinking refers to an approach to evolution education that emphasizes reading and interpreting phylogenetic trees. We studied the relationship between introductory biology students’ tree-thinking ability and their acceptance of evolutionary theory.
Results: Comparisons between a semester in which interpretation of phylogenetic trees and related concepts were taught as stand-alone topics versus one in which tree thinking was used as an organizing framework for the course curriculum found significant increases in students’ ability to read and interpret trees in both semesters, but only in the tree thinking semester was there a significant increase in students’ scores on the Measure of the Acceptance of the Theory of Evolution (MATE) instrument. Over four additional semesters, the Tree Thinking Concept Inventory (TTCI) was used to assess students’ tree-thinking abilities before and after the course. We found that MATE posttest scores correlated with gains in tree-thinking ability. These increases in MATE posttest scores were predominantly due to students’ reporting greater acceptance of the scientific evidence supporting evolutionary theory.
Conclusions: Increased acceptance of evolution in a tree-thinking versus non-tree-thinking semester and significant positive correlations between TTCI and MATE scores indicate there is a relationship between tree-thinking ability and acceptance of evolution. This result suggests that, as a framework to connect different forms of data and investigate a variety of biological phenomena, tree thinking can promote greater acceptance of the evidence and scientific validity of evolutionary theory in introductory biology students.
Keywords: Evolution, Macroevolution, Phylogeny, Tree thinking, Undergraduate
© 2015 Gibson and Hoefnagels. This article is distributed under the terms of the Creative Commons Attribution 4.0 International License (http://creativecommons.org/licenses/by/4.0/), which permits unrestricted use, distribution, and reproduction in any medium, provided you give appropriate credit to the original author(s) and the source, provide a link to the Creative Commons license, and indicate if changes were made.
Background
Surveys consistently report low levels of understanding and acceptance of evolution in the United States (Miller et al. 2006). Far from being a feature of the general public alone, many undergraduates enter introductory biology courses with minimal understanding of and numerous misconceptions about evolution and its relationship to other biological principles (Johnson and Peeples 1987; Sundberg 1997; Dagher and BouJaoude 1997; Bishop and Anderson 1990; Meir et al. 2007; Nehm and Reilly 2007). This lack of understanding has been shown to often
continue throughout undergraduate education and even into graduate school (Alters and Nelson 2002; Nehm and Reilly 2007; Gregory and Ellis 2009 Losos et al. 2013).
Insufficient instruction by high school biology teach-ers who may accept evolution but hold misconceptions about it or limit coverage to avoid conflicts; teachers who do not accept the scientific validity of evolution, question the existence of evidence supporting evolution, or doubt its acceptance by scientists; and teachers who continue to present non-scientific explanations as equivalent if not superior “alternatives” to biological evolution have been identified as causes of low understanding and acceptance of evolution in high school graduates (National Acad-emy of Sciences 1999, 2008; Rutledge and Mitchell 2002: Miller 2005; Moore and Kraemer 2005; Verhey 2005;
Open Access
*Correspondence: [email protected]
2 Department of Microbiology and Plant Biology, University of Oklahoma,
Norman, OK 73019, USA
Berkman et al. 2008; Cavallo and McCall 2008; Moore 2008; Moore and Cotner 2009a, b; Smith 2010; Berkman and Plutzer 2011; Moore et al. 2011; Lloyd-Strovas and Bernal 2012). In a recent study, Yates and Marek (2014) found that students in some high school biology classes started the course with a more accurate understanding of evolution than their teachers, but left those courses with less understanding of and more misconceptions about evolution than they had when they entered.
Unfortunately, challenges in evolution education do not end once students enter college and university intro-ductory biology courses. Because evolution is built upon a synthesis of data from scientific fields ranging from molecular genetics to paleontology, presenting the sheer breadth of this information in only a few introductory biology lectures can potentially overwhelm students and cause them to consider evolution as just one of the many separate topics covered during the semester rather than a unifying principle of biology (National Research Coun-cil 2012). Furthermore, it has been suggested that over-emphasis on microevolution in introductory courses and insufficient coverage of other essential facets of evolu-tionary theory such as speciation, ancestor–descend-ant relationships, biogeography, and extinction (Catley 2006; Catley and Novick 2009; Smith 2010), as well as inconsistent and potentially confusing presentation of evolution in textbooks (Linhart 1997) can also pre-vent introductory students from developing a complete understanding of evolutionary theory (Lloyd-Strovas and Bernal 2012; Hobbs et al. 2013).
When investigating the effect of any curricular activ-ity in science education in general and evolution edu-cation in particular, it is important to be mindful of the relationships and distinctions among knowledge, belief, and acceptance. Knowledge and belief are separate con-structs that influence teaching and learning about evo-lution (Smith and Siegel 2004; Alters 2005). Beliefs are highly subjective, based on personal experience, and resistant to contrary evidence, so they are typically resist-ant to change (Sinatra et al. 2008). Likewise, beliefs are not subject to the same empirical criteria as scientific evidence (Southerland et al. 2001). Consequently, chang-ing students’ beliefs may not be an appropriate objective in evolution education. Indeed, changing beliefs about evolution is difficult (Demastes-Southerland et al. 1995; Nadelson and Southerland 2010). Therefore, rather than attempting to change beliefs a more appropriate objective is increasing students’ acceptance of evolutionary theory (Smith and Siegel 2004). Acceptance indicates an under-standing of the scientific evidence, critical evaluation of empirical evidence and the methods used to gather and analyze it, and a scientifically logical interpretation of how that evidence fits into the larger framework of
scientific theory (Rutledge and Mitchell 2002; Nadelson and Southerland 2010).
One curricular change that has been suggested to improve evolution education and promote greater acceptance of evolution, particularly at the introduc-tory level, is to increase emphasis on phylogenetic tree thinking. The concept of tree thinking encompasses the skills and knowledge necessary to correctly interpret and understand the information about evolutionary relation-ships, patterns, and processes contained in phylogenetic trees (Baum et al. 2005; Baum and Offner 2008; Baum and Smith 2013). Ever since Darwin first used a branch-ing tree diagram to represent his initial conceptions of nested, evolutionary diversification of lineages from a common ancestor in his Notebook B and later as the only figure in The Origin of Species (Darwin 1859), phyloge-netic trees have become the primary diagrammatic rep-resentation of broad-scale evolution that guides research and thought throughout biology (Baum and Smith 2013). It has been suggested that greater inclusion of tree thinking in biology courses will not only increase stu-dents’ skills in phylogenetics, a topic that has historically received less attention at the introductory level than oth-ers, but it can also serve as a platform to improve their broader understanding and acceptance of evolution-ary theory (O’Hara 1997; Baum et al. 2005; Catley 2006; Gregory 2008; Catley and Novick 2009; Kalinowski et al. 2010; Smith 2010).
Correctly applying tree thinking to interpret phyloge-netic trees requires technical knowledge of the diagrams and an understanding of fundamental biological and evolutionary principles they represent (Donovan 2005; Baum and Offner 2008). Consequently, mistakes reading phylogenetic trees can give insights into student miscon-ceptions about different aspects of evolution and evolu-tionary theory (Baum et al. 2005; Crisp and Cook 2005; Meir et al. 2007; Meisel 2010). For example, determining relationships by using branch tip proximity (i.e., “read-ing across the tips”) or the number of nodes between lineages (i.e., “node counting”) not only signify deficient skills in how to read a tree, but also a fundamental mis-understanding of the concept of common ancestry that is the core of evolutionary theory. In addition to provid-ing a diagnostic tool to identify students’ misconceptions about evolution, tree thinking can also serve as an organ-izing concept that connects different forms of data that serve as evidence of evolution. Thus, there are reasons to suspect that improved tree thinking might foster greater acceptance of evolution in undergraduates (Alters and Nelson 2002; Nehm et al. 2009; Halverson 2011).
Smith and Cheruvelil 2009; Halverson 2010; Gibson and Cooper 2014). Prior studies have failed to show con-vincingly that completing a single tree-thinking activity increases students’ acceptance of evolution and have not yielded uniform conclusions (Southerland and Sinatra 2005; Lloyd-Strovas and Bernal 2012). Larger curricu-lar modifications that infuse tree thinking throughout a course may be necessary to significantly change accept-ance of evolutionary theory. Indeed, significant increases in acceptance of evolution were found when tree thinking was emphasized throughout upper level biology courses (Nadelson and Southerland 2010: Dodick and Orion 2002; Catley and Novick 2009). While this is encourag-ing, the effect of including tree thinking on introduc-tory-level students’ acceptance of evolution has not been thoroughly explored.
In this study, we investigated the relationship between introductory biology students’ tree-thinking skills and their acceptance of evolution to determine whether using tree thinking as an organizing framework throughout an introductory-level course can improve students’ accept-ance of evolution as a valid, scientific theory that uni-fies a diverse array of empirical evidence and provides a foundation for all areas of biology. Thus, the tree thinking framework we are investigating can be summarized as embodying the classic statement by Dobzhansky (1973) that, “Nothing in biology makes sense except in the light of evolution,” and its two more recent logical extensions that “Nothing in evolution makes sense except in the light of phylogeny” (Society of Systematic Biologists 2001) and “Nothing in evolution makes sense except in the light of DNA” (Kalinowski et al. 2010).
Methods
Course and Study Participants
The study focused on BIOL 1134 Evolution, Ecology, and Diversity. It is one of two introductory-level courses required for biology, plant biology, and microbiology majors and serves as a general education science course for non-majors. The course objective is to introduce stu-dents to biological diversity, the evolutionary processes that produce biological diversity, and the basic features of structure and function in biological systems at the organ-ismal and ecological levels. The course includes a single lecture (taught by JPG) and weekly laboratory sessions (taught by graduate teaching assistants). Participants were recruited on the first day of class each semester and provided a participant consent form to opt-in for partici-pation in the study in accordance with IRB approved and mandated procedures. Background information about major, year in college, and whether they had previously completed college or university introductory biology
courses that covered evolution was also collected from each student.
Because only one section of BIOL 1134 is offered each semester, it was not possible to compare non-tree-think-ing and tree-thinknon-tree-think-ing curricula in concurrent sections. Thus, in our initial study, we compared a section of BIOL 1134 offered in Fall 2009 (designated F09) that covered phylogenetics but did not emphasize tree thinking with a section offered in Spring 2010 (designated S10) that used a tree-thinking framework throughout the course. The same general topics were covered in both semesters, and both used case studies, guided inquiry, and active learn-ing activities. However, the S10 tree thinklearn-ing section included additional activities that involved phylogenetic analysis or interpretation. Most of the content that was cut from lecture to allow greater coverage of tree think-ing was accommodated in laboratory sessions. Due to human subjects research guidelines, only the tree-think-ing curriculum was used in the final four semesters of the study from spring semester 2011 through fall semester 2012 (designated S11, F11, S12, and F12, respectively). However, by using multiple linear regression analysis to look for correlations between the extent to which indi-vidual students improved their tree thinking and their acceptance level, we were able to more accurately assess whether improved teaching tree thinking also raises acceptance of evolution.
Tree‑Thinking Curriculum Structure
Active learning exercises were employed in lecture throughout the course in all semesters. Case studies and problem sets explored the following topics: inheritance, pedigree analysis, and population genetics (Aronova-Tiuntseva and Herreid 2003; Leander and Huskey 2008; Rice 2010); natural selection (Evarts et al. 2006; Gibson 2008; Horvath 2009a); phylogeny construction and inter-pretation (Horvath 2009b); and trait evolution (Herreid 2005; Flammer 2007). Laboratory sessions paralleled lec-ture topics. In lab, students used guided inquiry activi-ties to learn and apply tree thinking in several different modules. Basic principles and process of phylogenetic analyses were studied using the Great Clade Race (Gold-smith 2003) and a modification of the Dendrogram-maceae phylogenetic construction activity (Duncan et al. 1980). Students applied their knowledge of phylogenetic data collection and analysis through activities that inves-tigated plant and animal diversity (Smith and Cheruvelil 2009; Gibson and Cooper 2014). These involved stu-dents collecting morphological data from representative specimens of different taxa and then using their data to construct trees with the phylogenetic analysis program Mesquite (Mesquite Project Team 2009). Next, students constructed phylogenies using genetic data (e.g., rbcL or mitochondrial gene sequences) for comparison to their structural tree. These activities not only gave students opportunities to develop phylogenetic analysis skills, but also provided multiple opportunities to apply tree think-ing usthink-ing different forms of data so they could engage in the scientific processes biologists use to investigate evo-lution questions. Resources for specific activities and sample syllabi are available at http://www.ou.edu/gibson-lab/Tree_Thinking/Tree_Thinking.html.
Assessment
All students in the course were given the opportunity to complete the assessment instruments for a small number of points, but only data from students who self-selected to participate and completed all pretest and posttest assessments were included in the analysis.
In initial study comparing students between the non-tree thinking (F09) and non-tree thinking (S10) semesters, students’ overall ability to read and interpret phyloge-netic trees was evaluated using a subset of questions from the Understanding Evolutionary Trees Worksheet (UET, Additional file 1), a general tree thinking assess-ment instruassess-ment developed by Meir et al. (2007) that includes multiple choice questions about phylogenetic trees and questions asking students to construct a simple phylogeny from provided data.
Although data from the UET assessment are informa-tive, aspects of the wording in distractors and limited topic coverage were found to present confounding factors
that limited detailed analysis of results. Consequently, we replaced the UET instrument with a subset of 14 multi-ple-choice questions from Naegle’s (2009) Tree Thinking Concept Inventory (TTCI, Additional file 2) in the S11, F11, S12, and F12 semesters. The TTCI instrument sup-ports more detailed exploration of specific aspects of students’ ability to describe basic features of trees, read phylogenetic trees to determine relationships, and inter-pret the evolutionary information contained in them. Distractors in the TTCI included common misconcep-tions about time, common ancestry, trait evolution, and evolutionary processes. The TTCI also asks students to report whether they have previously seen or learned to read phylogenetic tree diagrams. The TTCI was adminis-tered as a pretest (TTCIPRE) and posttest (TTCIPOST).
Acceptance of evolution was assessed in all six semes-ters using the Measure of Acceptance of the Theory of Evolution (MATE) instrument (Rutledge and Warden, 1997; Rutledge and Sadler 2007), administered as both a pretest (MATEPRE) and a posttest (MATEPOST). The MATE is a 20-question, five-point Likert-scale instru-ment that asks respondents the extent to which they agree or disagree with statements about the process, the evidence for, and the scientific validity of evolutionary theory. Statements are paired for each topic with a posi-tive and negaposi-tive phrasing. For example statement M16, (Evolutionary theory is supported by factual, historical, and laboratory data.) and statement M4 (The theory of evolution is based on speculation and not valid scientific observation and testing.) address the same topic (Basis of evolutionary theory in scientific data) with a positive and negative phrasing, respectively.
Data Analysis
To evaluate tree-thinking ability, the frequencies of differ-ent misconception and deficidiffer-ent skills were summarized and compared between pretest and posttest responses from the UET assessment administered in F09 and S10. Mean score between the UET pretest and posttest were compared through Paired Samples t tests. For the TTCI data, mean and standard deviation (SD) were calculated for the TTCIPRE and TTCIPOST scores within the S11, F11, S12, and F12 semesters and for data pooled across semesters. Mean TTCIPRE and TTCIPOST scores were then compared within pretests and posttests via ANOVA or Paired Samples t tests. The TTCIPRE and TTCIPOST scores were compared by Paired Samples t tests. All data were analyzed using PASW Statistics (version 18.0).
median values of MATEPRE and MATEPOST were com-pared via Kruskal–Wallis tests and Mann–Whitney U tests. MATE pretest and posttest scores for individual semesters and pooled data across semesters were com-pared through a non-parametric Related-Samples Wil-coxon Signed Ranks Test (Sokal and Rohlf 2012).
Normalized change, c, was calculated as
to compare the difference between the pre and post-test scores relative to the maximum possible gain in post-test score(Marx and Cummings 2007). This statistic was calculated for UET scores (cU) in F09 and S10, TTCI scores (cT) in S11 through F12, and MATE scores (cM) in all semesters to quantify individual student learning gains. Patterns of correct and incorrect answers to each question in the TTCI were further evaluated through Item Analysis to calculate the Discrimination Index (D) that quantifies the difference in percentage of correct responses between the upper 27 % (U27 %) and lower 27 % (L27 %) of TTCI scores (Hopkins and Stanley 1981). Responses were also compared between the U27 % and L27 % of MATE scores, but because there are no correct or incorrect responses, D was not calculated.
Students enrolled in a particular semester do not rep-resent a random sampling of potential participants. Because it is not possible to randomly assign students to control and treatment groups, evaluating of the effect of a tree-thinking versus non-tree-thinking curriculum is best achieved through comparisons of MATEPRE and MATEPOST scores within semesters. To do this, a stu-dent-level, multiple linear regression model was used to investigate the relationship between tree thinking and acceptance of evolution in semesters S11, F11, S12, and F12 (Theobald and Freeman 2014). Instead of compar-ing “control’ and “treatment” semesters, multiple linear regression analysis accounts for various non-random fac-tors such as previous introductory biology coursework or preexisting differences in ability to read phylogenetic trees that can affect acceptance of evolution,. In particu-lar, the pretest MATE and TTCI values serve as controls in linear regression analysis of posttest scores making it possible to evaluate the effect of gains in tree thinking and on acceptance of evolution at the end of the course.
Data from the S11 through F12 MATE and TTCI instruments were pooled across the four semesters for linear regression analysis. Spearman’s rho (ρ) was calcu-lated using nonparametric correlation (Sokal and Rohlf 2012; Theobald and Freeman 2014) to evaluate the indi-vidual relationships among students’ background data, their tree thinking ability, and their acceptance of evo-lution. Multiple linear regression analysis of MATEPRE scores used background data (e.g., year, previous biology,
c=(Posttest score−Pretest score)/(100−Pretest score)
etc.), whether students had previously seen or learned to read phylogenetic trees, and the TTCIPRE score as pre-dictors. Multiple linear regression analysis of MATEPOST scores included background data, MATEPRE, TTCIPRE, and TTCIPOST scores in the model. Analysis of MATE-POST scores was also conducted with TTCI scores replaced by cT values to measure correlations between acceptance of evolution and change in TTCI pretest and posttest scores.
Results
A total of 332 students participated in the study across all six semesters (Table 1). Study participants reflected the typical composition of students in BIOL 1134, with most being sophomores (40.5 %) majoring in the life sciences (95.9 %). Overall, 53.6 % had previously completed at least one semester of introductory biology at the univer-sity level. Because participation in the study was volun-tary, it is possible that self-selection bias could potentially influence the results. However, we did not notice any differences in student characteristics, assessment instru-ment scores, or responses to assessinstru-ment instruinstru-ment questions between participants and other course enroll-ees that would suggest participants were dissimilar from course enrollees overall. Furthermore, study participants’ UET and TTCI scores showed a range of tree-thinking abilities, and scores on MATE pretests and posttests ranged from very high acceptance to very low acceptance of evolution. Therefore, we are confident that was no bias towards students with high tree-thinking skills or initial acceptance of evolution. Unfortunately, the procedures to collect the necessary data and methods to statistically detect, identify, and correct for the myriad of potential factors that can contribute to self-selection bias (Cudde-back et al. 2004) are beyond the scope of this study.
Tree Thinking and Acceptance of Evolution in F09 and S10 Semesters
However, the frequency of node counting decreased by over 70 % in posttests for both semesters. Surprisingly, the use of reading across the tips to determine related-ness increased slightly in posttests for both semesters. Students had difficulty reading how traits of different lin-eages are represented in trees in pretests. They also con-sidered taxa on branches at the left of the phylogeny to be older or “less evolved” than taxa on branches on the right side of the phylogeny. Although many students had difficulty constructing a phylogenetic tree when given a small data set for five hypothetical taxa in pretests, they showed marked improvement in their ability to construct a simple phylogentic tree in the posttest.
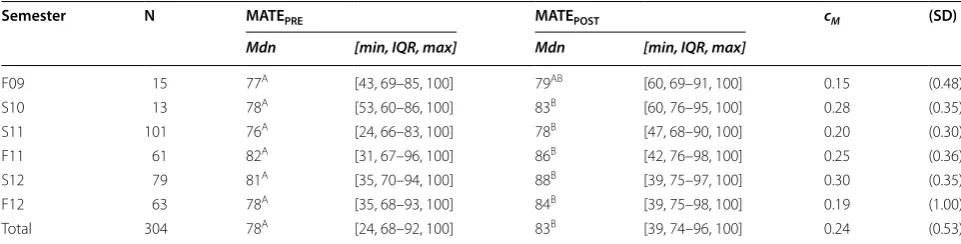
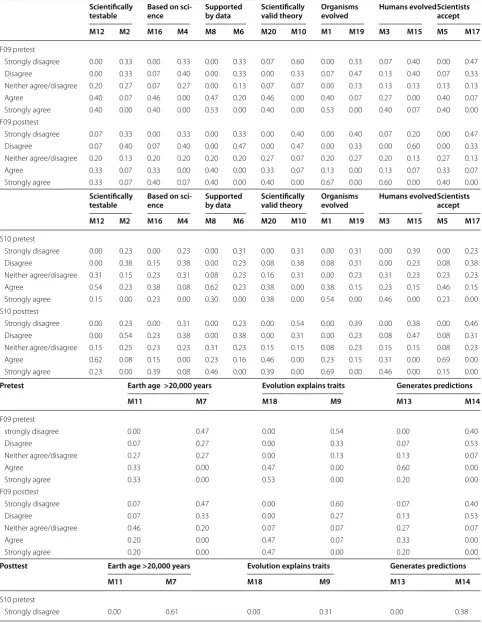
Median MATEPRE scores in both F09 and S10 (Table 3, top portion) were in the High Acceptance of Evolu-tion category (MATE scores 77–88). MATEPOST scores increased in both semesters but were significantly greater than MATEPRE in the S10 semester only. The interquar-tile range showed a greater increase in S10 than F09. In the S10 MATEPOST responses (Table 4), shifts towards increased acceptance of evolution were particularly clear in questions probing students’ attitudes on the occur-rence of evolution (M1, M3, M15, M19), the evidence supporting evolutionary theory (M6, M7, M8, M11), the scientific validity of evolutionary theory (M2, M4, M10, M12, M16, M20), the scientific applicability of evolution-ary theory (M9, M13, M14, M18,), and the acceptance of evolutionary theory in the scientific community (M5, M17). Normalized change for MATE in S10, the semester in which tree thinking was integrated into the curricu-lum, was almost twice as large the normalized change for MATE in F09 (Table 3).
Tree Thinking and Acceptance of Evolution in S11 Through F12 Semesters
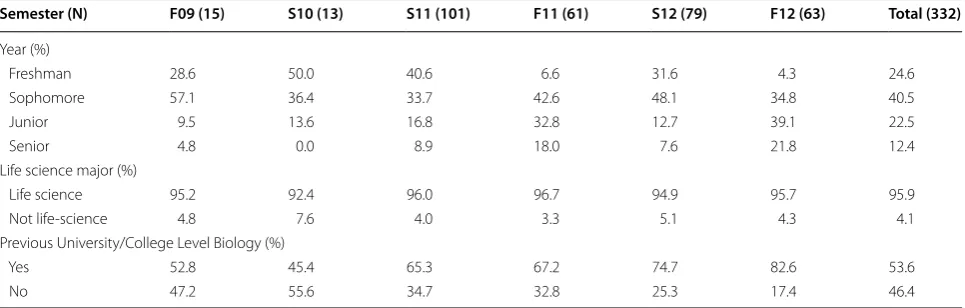
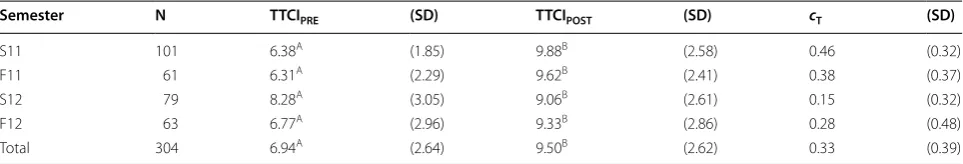
Mean TTCIPOST scores were significantly higher than mean TTCIPRE scores for all individual semesters and in the pooled data (Table 5, Additional file 3). Students who reported having previously taken introductory biology or previously seen or learned to read phylogenetic trees had significantly better tree reading than those who had not (Table 6). Within pretests and posttests, there were no differences in TTCI scores among students in different years of school or between majors and non-majors. Nor-malized change scores, cT, showed an average increase of 33 % across all questions in pooled data, with a low of 15 % in S12 and a high of 46 % in S11 (Table 5). Reliability analysis of the TTCI had a Cronbach’s α of 0.60 and 0.68 in the pretest and posttest, respectively, indicating that Table 1 Participant background information
Participant year in school, major, and previous university biology experience for each semester and pooled total responses across all study semesters.
Semester (N) F09 (15) S10 (13) S11 (101) F11 (61) S12 (79) F12 (63) Total (332)
Year (%)
Freshman 28.6 50.0 40.6 6.6 31.6 4.3 24.6
Sophomore 57.1 36.4 33.7 42.6 48.1 34.8 40.5
Junior 9.5 13.6 16.8 32.8 12.7 39.1 22.5
Senior 4.8 0.0 8.9 18.0 7.6 21.8 12.4
Life science major (%)
Life science 95.2 92.4 96.0 96.7 94.9 95.7 95.9
Not life-science 4.8 7.6 4.0 3.3 5.1 4.3 4.1
Previous University/College Level Biology (%)
Yes 52.8 45.4 65.3 67.2 74.7 82.6 53.6
No 47.2 55.6 34.7 32.8 25.3 17.4 46.4
Table 2 Participant tree reading misconceptions, deficient skills, and mean score on the understanding evolutionary trees (UET) assessment
Percentage of students displaying a misconceptions about phylogentic trees or deficiency in skills necessary to read phylogenetic trees in pretest and posttests administered during the F09 (N = 15) and S10 (N = 13) semesters. A perfect score on the UET is 7.
F09 F09 S10 S10
Pretest Posttest Pretest Posttest
Misconception
Representation of time in trees 60 % 0 % 85 % 0 %
Node counting 73 % 0 % 82 % 15 %
Reading across tips 33 % 47 % 31 % 54 %
How character change shown
in trees 40 % 0 % 77 % 8 %
Deficient skill
Read traits from a tree 67 % 20 % 54 % 23 %
Deduce ancestral traits 40 % 7 % 54 % 8 %
Identify identical trees with
dif-ferent node rotations 53 % 27 % 62 % 31 %
Construct a tree 66 % 19 % 69 % 8 %
the assessment instrument questions are measuring the same conceptual construct.
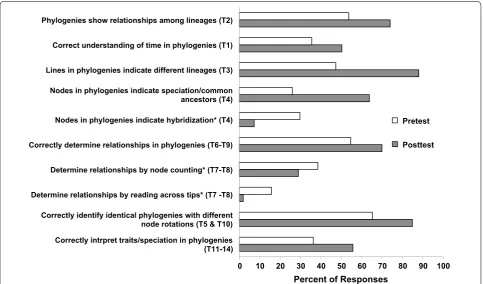
Pretest TTCI assessment showed that in approximately half of the responses, students correctly answered that phylogenies show relationships among lineages indi-cated by lines in the diagram (Fig. 1, Table 7). Slightly over one-third of responses correctly identified how time is represented in a phylogeny. Only one fourth correctly responded that nodes indicate where lineages diverge, but approximately one third held the misconception that nodes indicated where lineages came together or hybrid-ized. Students correctly described relationships shown in phylogenies in half of their TTCIPRE responses. As in F09 and S10, node counting was used to determine rela-tionships in phylogenies to a greater extent than reading across the tips. Students could generally identify identi-cal trees showed the same branching pattern of relation-ships despite node rotations. However, there was a low percentage of correct answers in questions asking stu-dents to interpret how trait evolution and speciation is shown in trees. Posttest responses showed improvement in all areas (Fig. 1; Table 7). In posttests, a greater per-centage of responses correctly described the components of a phylogenetic tree, and students improved in their ability to determine relationships and interpret traits in trees. Although the frequency of node counting to deter-mine relationships decreased in the TTCI posttest, it still tended to used with greater frequency than reading across the tips. Responses in the TTCI posttest showed increases in correct responses of 15 % or less in Ques-tions T1, T5, T6, T7, and T11. Other quesQues-tions showed larger increases of 20–40 % in the percentage of correct answers.
Looking across questions, TTCI pretest discrimination index values had an average of D = 0.45 ± 0.130 (indi-cating that the percentage of correct answers to pretest
questions was 45 % higher in the U27 % group than the L27 % group) (Table 7). Questions such as T4 had low D values due to low percentages of correct answers in the
U27 %and L27 % groups, while questions such as T5 and T6 had high percentages of correct answers in all groups. Most informative were the questions with the higher
D-values (i.e., T1, T9, T12, and T13) which showed that the tree thinking skills that seemed to be most difficult for the low scoring students involved determining rela-tionships and interpreting information about speciation and character evolution.
Median MATEPRE scores were in the High Accept-ance of Evolution category (MATE scores 77–88), in combined data and for F11, S12, and F12 (Table 3, lower portion) and in the Moderate Acceptance of Evolu-tion category (MATE scores 65–76) for S11. Median MATEPOST scores were in the High Acceptance category overall and for individual semesters. The median MATE-POST (Mdn = 82.50) was significantly higher (Z = 7.97,
p < 0.001) than MATEPRE (Mdn = 79.00) in pooled data and within semesters (S11: Z = 2.60, p = 0.009; F11: Z = 3.23, p = 0.001; S12: Z = 4.47, p < 0.001; F12:
Z = 4.90, p < 0.001). Reliability analysis of the MATE showed excellent internal consistency, with Cronbach’s α
values of 0.95 in pretests and 0.925 in posttests.
The only significant differences in MATE pretest or posttest scores detected among different student categories were for year in school in which seniors had significantly higher MATEPRE and MATEPOST scores than students in other years of school (Table 6). Median MATE posttest scores were significantly higher than pretest scores in all categories except for students who were not life science majors and stu-dents who had not previously completed introductory biology. Mean normalized change across semesters for MATE scores were significantly greater than zero Table 3 Measure of the acceptance of the theory of evolution (MATE) scores
Median (Mdn), minimum (min) inter quartile range (IQR), and maximum (max), values for MATEPRE and MATEPOST scores, and the mean and standard deviation of normalized change (cM, SD) for individual semesters and for total data pooled across S11, F11, S12, and F12. Within semesters and for the total data pooled across S11,
F11, S12, and F12, median MATEPRE and MATEPOST values followed by different letters are significantly different (p < 0.05) in Wilcoxon Ranked Sum tests. N = sample size. MATE scores can range from 20 to 100.
Semester N MATEPRE MATEPOST cM (SD)
Mdn [min, IQR, max] Mdn [min, IQR, max]
F09 15 77A [43, 69–85, 100] 79AB [60, 69–91, 100] 0.15 (0.48)
S10 13 78A [53, 60–86, 100] 83B [60, 76–95, 100] 0.28 (0.35)
S11 101 76A [24, 66–83, 100] 78B [47, 68–90, 100] 0.20 (0.30)
F11 61 82A [31, 67–96, 100] 86B [42, 76–98, 100] 0.25 (0.36)
S12 79 81A [35, 70–94, 100] 88B [39, 75–97, 100] 0.30 (0.35)
F12 63 78A [35, 68–93, 100] 84B [39, 75–98, 100] 0.19 (1.00)
Table 4 Responses to MATE pretest and posttest responses F09 and S10 Scientifically
testable Based on sci‑ence Supported by data Scientifically valid theory Organisms evolved Humans evolvedScientists accept
M12 M2 M16 M4 M8 M6 M20 M10 M1 M19 M3 M15 M5 M17
F09 pretest
Strongly disagree 0.00 0.33 0.00 0.33 0.00 0.33 0.07 0.60 0.00 0.33 0.07 0.40 0.00 0.47
Disagree 0.00 0.33 0.07 0.40 0.00 0.33 0.00 0.33 0.07 0.47 0.13 0.40 0.07 0.33
Neither agree/disagree 0.20 0.27 0.07 0.27 0.00 0.13 0.07 0.07 0.00 0.13 0.13 0.13 0.13 0.13
Agree 0.40 0.07 0.46 0.00 0.47 0.20 0.46 0.00 0.40 0.07 0.27 0.00 0.40 0.07
Strongly agree 0.40 0.00 0.40 0.00 0.53 0.00 0.40 0.00 0.53 0.00 0.40 0.07 0.40 0.00
F09 posttest
Strongly disagree 0.07 0.33 0.00 0.33 0.00 0.33 0.00 0.40 0.00 0.40 0.07 0.20 0.00 0.47
Disagree 0.07 0.40 0.07 0.40 0.00 0.47 0.00 0.47 0.00 0.33 0.00 0.60 0.00 0.33
Neither agree/disagree 0.20 0.13 0.20 0.20 0.20 0.20 0.27 0.07 0.20 0.27 0.20 0.13 0.27 0.13
Agree 0.33 0.07 0.33 0.00 0.40 0.00 0.33 0.07 0.13 0.00 0.13 0.07 0.33 0.07
Strongly agree 0.33 0.07 0.40 0.07 0.40 0.00 0.40 0.00 0.67 0.00 0.60 0.00 0.40 0.00
Scientifically
testable Based on sci‑ence Supported by data Scientifically valid theory Organisms evolved Humans evolvedScientists accept
M12 M2 M16 M4 M8 M6 M20 M10 M1 M19 M3 M15 M5 M17
S10 pretest
Strongly disagree 0.00 0.23 0.00 0.23 0.00 0.31 0.00 0.31 0.00 0.31 0.00 0.39 0.00 0.23
Disagree 0.00 0.38 0.15 0.38 0.00 0.23 0.08 0.38 0.08 0.31 0.00 0.23 0.08 0.38
Neither agree/disagree 0.31 0.15 0.23 0.31 0.08 0.23 0.16 0.31 0.00 0.23 0.31 0.23 0.23 0.23
Agree 0.54 0.23 0.38 0.08 0.62 0.23 0.38 0.00 0.38 0.15 0.23 0.15 0.46 0.15
Strongly agree 0.15 0.00 0.23 0.00 0.30 0.00 0.38 0.00 0.54 0.00 0.46 0.00 0.23 0.00
S10 posttest
Strongly disagree 0.00 0.23 0.00 0.31 0.00 0.23 0.00 0.54 0.00 0.39 0.00 0.38 0.00 0.46
Disagree 0.00 0.54 0.23 0.38 0.00 0.38 0.00 0.31 0.00 0.23 0.08 0.47 0.08 0.31
Neither agree/disagree 0.15 0.25 0.23 0.23 0.31 0.23 0.15 0.15 0.08 0.23 0.15 0.15 0.08 0.23
Agree 0.62 0.08 0.15 0.00 0.23 0.16 0.46 0.00 0.23 0.15 0.31 0.00 0.69 0.00
Strongly agree 0.23 0.00 0.39 0.08 0.46 0.00 0.39 0.00 0.69 0.00 0.46 0.00 0.15 0.00
Pretest Earth age >20,000 years Evolution explains traits Generates predictions
M11 M7 M18 M9 M13 M14
F09 pretest
strongly disagree 0.00 0.47 0.00 0.54 0.00 0.40
Disagree 0.07 0.27 0.00 0.33 0.07 0.53
Neither agree/disagree 0.27 0.27 0.00 0.13 0.13 0.07
Agree 0.33 0.00 0.47 0.00 0.60 0.00
Strongly agree 0.33 0.00 0.53 0.00 0.20 0.00
F09 posttest
Strongly disagree 0.07 0.47 0.00 0.60 0.07 0.40
Disagree 0.07 0.33 0.00 0.27 0.13 0.53
Neither agree/disagree 0.46 0.20 0.07 0.07 0.27 0.07
Agree 0.20 0.00 0.47 0.07 0.33 0.00
Strongly agree 0.20 0.00 0.47 0.00 0.20 0.00
Posttest Earth age >20,000 years Evolution explains traits Generates predictions
M11 M7 M18 M9 M13 M14
S10 pretest
(t = 7.648, df = 295, p < 0.001) and showed an average
increase of 23 % (cM = 0.23 ± 0.53 N = 296). A large majority of the pretest and posttest responses from students in the U27 % group were in Likert catego-ries indicating high acceptance of evolution, whereas pretest and posttest responses in the L27 % group spanned a greater range of Likert categories (Table 8). Despite covering the scientific evidence of evolution during the semester, posttest responses showed that low acceptance of evolution persisted in some stu-dents. However, there were shifts in the MATE post-test responses of the L27 % group in statements that address the basis of evolutionary theory on data and scientific research (Table 8).
Correlation and Linear Regression Analyses of TTCI and MATE
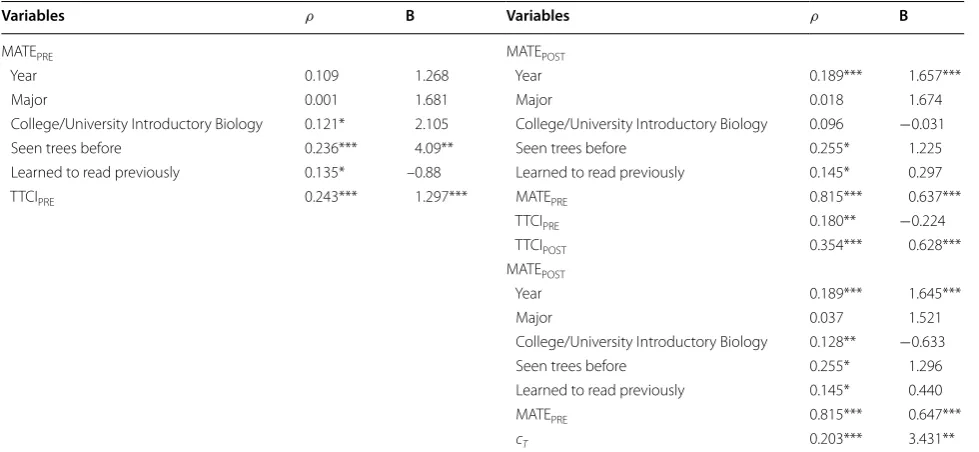
Pooling across the S11 through S12 semesters, MATEPRE scores had a significant, positive correlation with all vari-ables except year in school and major (Table 9). The cor-relation coefficient calculated in regression analysis of MATEPRE was low (R = 0.309, F(6, 297) = 5.21, p < 0.001), and the only significant predictors of MATEPRE in the model were the TTCIPRE score and whether a student had previously seen phylogenetic trees. The R value for MATEPOST over twice as large as in MATEPRE lin-ear regression analyses (R = 0.823, F(8, 295) = 77.58,
p < 0.001). MATEPOST scores had a significant, positive correlation with all variables except major and previous Percentage of Likert scale response for 20 statements about evolution (designated M1–M20) from the MATE pretest and posttest in the non-tree-thinking (F09) and tree-thinking (S10) semesters. Pairs of positively and negatively worded statements are organized under statement topics. Columns with negatively worded statement responses are shaded.
a Statements: M1. Organisms existing today are the result of evolutionary processes that have occurred over millions of years. M2. The theory of evolution is incapable of being scientifically tested. M3. Modem humans are the product of evolutionary processes that have occurred over millions of years. M4. The theory of evolution is based on speculation and not valid scientific observation and testing. M5. Most scientists accept evolutionary theory to be a scientifically valid theory. M6. The available data are ambiguous as to whether evolution actually occurs. M7. The age of the earth is less than 20,000 years. M8. There is a significant body of data which supports evolutionary theory. M9. Organisms exist today in essentially the same form in which they always have. M10. Evolution is not a scientifically valid theory. M11. The age of the earth is at least 4 billion years. M12. Current evolutionary theory is the result of sound scientific research and methodology. M13. Evolutionary theory generates testable predictions with respect to the characteristics of life. M14. The theory of evolution cannot be correct since it disagrees with the account of creation in different religious texts. M15. Humans exist today in essentially the same form in which they always have. M16. Evolutionary theory is supported by factual, historical, and laboratory data. M17. Much of the scientific community doubts if evolution occurs. M18. The theory of evolution brings meaning to the diverse characteristics and behaviors observed in living forms. M19. With few exceptions, organisms on earth came into existence at about the same time. M20. Evolution is a scientifically valid theory.
Table 4 continued
Posttest Earth age >20,000 years Evolution explains traits Generates predictions
M11 M7 M18 M9 M13 M14
Disagree 0.00 0.23 0.00 0.23 0.08 0.23
Neither agree/disagree 0.15 0.08 0.23 0.31 0.00 0.31
Agree 0.46 0.08 0.54 0.15 0.84 0.08
Strongly agree 0.39 0.00 0.23 0.00 0.08 0.00
S10 posttest
Strongly disagree 0.00 0.62 0.00 0.23 0.00 0.46
Disagree 0.08 0.15 0.00 0.69 0.00 0.15
Neither agree/disagree 0.08 0.23 0.15 0.08 0.15 0.31
Agree 0.38 0.00 0.62 0.00 0.62 0.08
Strongly agree 0.46 0.00 0.23 0.00 0.23 0.00
Table 5 Tree-Thinking Concept Inventory scores
Mean and standard deviation (SD) for TTCIPRE, TTCIPOST, and cT for individual S11, F11, S12, and F12 semesters and total data pooled across semesters. Within semesters,
mean TTCIPRE and TTCIPOST values followed by different letters are significantly different (p < 0.01) in Paired-Samples t tests (TTCI). N = sample size. A perfect score on the TTCI is 14.
Semester N TTCIPRE (SD) TTCIPOST (SD) cT (SD)
S11 101 6.38A (1.85) 9.88B (2.58) 0.46 (0.32)
F11 61 6.31A (2.29) 9.62B (2.41) 0.38 (0.37)
S12 79 8.28A (3.05) 9.06B (2.61) 0.15 (0.32)
F12 63 6.77A (2.96) 9.33B (2.86) 0.28 (0.48)
introductory biology experience, but only year in school, MATEPRE, and TTCIPOST were significant predictors of a students’ acceptance of evolution as measured by MATE-POST at the end of the semester in linear regression model (Table 9). MATEPOST also had a high correlation coef-ficient when TTCI scores were replaced with cT in the model (R = 0.822 F(7, 296) = 87.87, p < 0.001), indicating that final acceptance of evolution in the MATE posttest was not only significantly correlated with a student’s ini-tial acceptance of evolution, but also their gains in tree reading ability. The relationship between is improvement in tree thinking and acceptance of evolution is further supported by a significant, positive correlation between
cT and cM with ρ = 0.127 (p < 0.05).
Discussion
The present study identified a significant relationship between students’ tree thinking and their acceptance of evolution. We found that after completing a semester of introductory biology in which a number of tree-thinking activities emphasizing macroevolution and phylogenetic perspectives were used as an organizing theme through-out the semester, students improved in their ability to read and interpret phylogenetic trees as indicated by significantly higher TTCIPOST than TTCIPRE scores, and showed significantly greater acceptance of evolution as
indicated by MATE posttest scores. Many tions about phylogenetic trees, as well as misconcep-tions and conflicting opinions about evolution were corrected for most students. The assessment instrument responses indicated that the tree-thinking curricular structure, therefore, not only promoted development of the fundamental skills for tree thinking, it also improved acceptance and understanding of the scientific evidence supporting evolution.
In terms of learning tree thinking as a skill, we found that university students at the introductory biology level are capable of learning and applying complex phy-logenetic concepts and techniques. Errors detected in pretests, such as not knowing that a phylogeny shows relationships among taxa or that there is a time axis inherent in a phylogeny, indicate that some students have a fundamental misunderstanding of phylogenetic trees and the information they contain. Other errors, such as reading across the tips and node counting, indicate how students who have not been instructed how to correctly read trees use superficial features to interpret phylogenies (Halverson 2011). After completing the different activi-ties and modules, however, students’ ability to read and interpret phylogenetic trees was significantly improved (Tables 2, 5). Common misconceptions detected in UET and TTCI pretests (Tables 2, 7; Fig. 1) were not different Table 6 MATE and TTCI response for different student background categories
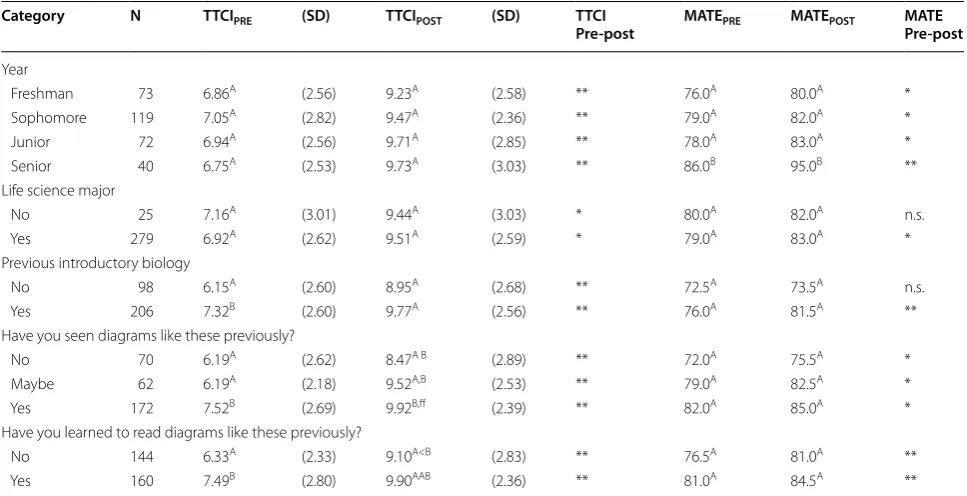
Mean scores (SD) for TTCIPRE and TTCIPOST, and median scores for MATEPRE, and MATEPOST for total data pooled across the S11 through F12 semesters for year in school, major, previous introductory biology experience, and whether seen or learned to read phylogenetic trees previously. TTCIPRE, TTCIPOST, MATEPRE. and MATEPOST values for a given instrument followed by different letters are significantly different (p < 0.05). N = Sample size. Significance of difference between pretest and posttest scores for a given student category indicated by the following: n.s. = no significant difference, * p < 0.01, ** p < 0.001.
Category N TTCIPRE (SD) TTCIPOST (SD) TTCI
Pre‑post MATEPRE MATEPOST MATEPre‑post
Year
Freshman 73 6.86A (2.56) 9.23A (2.58) ** 76.0A 80.0A *
Sophomore 119 7.05A (2.82) 9.47A (2.36) ** 79.0A 82.0A *
Junior 72 6.94A (2.56) 9.71A (2.85) ** 78.0A 83.0A *
Senior 40 6.75A (2.53) 9.73A (3.03) ** 86.0B 95.0B **
Life science major
No 25 7.16A (3.01) 9.44A (3.03) * 80.0A 82.0A n.s.
Yes 279 6.92A (2.62) 9.51A (2.59) * 79.0A 83.0A *
Previous introductory biology
No 98 6.15A (2.60) 8.95A (2.68) ** 72.5A 73.5A n.s.
Yes 206 7.32B (2.60) 9.77A (2.56) ** 76.0A 81.5A **
Have you seen diagrams like these previously?
No 70 6.19A (2.62) 8.47A B (2.89) ** 72.0A 75.5A *
Maybe 62 6.19A (2.18) 9.52A,B (2.53) ** 79.0A 82.5A *
Yes 172 7.52B (2.69) 9.92B,ff (2.39) ** 82.0A 85.0A *
Have you learned to read diagrams like these previously?
No 144 6.33A (2.33) 9.10A<B (2.83) ** 76.5A 81.0A **
from those that have been identified in other studies, par-ticularly the high occurrence of node counting. (Baum et al. 2005; Meir et al. 2007; Meisel 2010). Detailed item analysis of TTCI responses demonstrated that many of the mistakes students made when interpreting trees in TTCI pretest questions related to misunderstand-ings of nodes in phylogenetic trees and the evolutionary events they signify (Fig. 1, Additional file 3). For exam-ple, approximately one-fourth of students in the TTCI pretest correctly responded that nodes indicate isolation of lineages, while the majority responded that they indi-cate other events. Interestingly, 30 % thought that nodes indicated hybridization, which suggests these students may be confusing phylogenies with pedigrees. Although pedigrees and phylogenies are superficially similar, their interpretation is drastically different, particularly at the nodes. Applying principles for pedigree interpretation to a phylogeny could account for students’ use of methods such as node counting, which is informative to calculate degree of relatedness in a pedigree but not in a phylogeny.
Our results also showed that after completing a semester of introductory biology that used a tree-think-ing curriculum, students demonstrated significantly higher acceptance of evolution (Table 3). At the start of
the semester, tree-thinking ability, as indicated by the TTCIPRE score, was a predictor of the MATEPRE score (Table 9). However, by the end of the course in S11 through F12, students not only had significantly higher TTCI and MATE scores, but there were no longer dif-ferences in TTCI and MATE scores between students with different prior experience. In posttest assessment of MATEPOST, the TTCIPOST and MATEPRE scores were the only significant predictors of the MATEPOST score. While the results do not allow a direct conclusion of causality, they strongly indicate that a tree-thinking curriculum that engages students in collecting data, testing hypoth-eses, interpreting results, and learning phylogenetic tech-niques can increase students’ acceptance of evolution.
Although we have detected a significant relationship between tree thinking and acceptance of evolution, the results of the study also demonstrate that ability to read phylogenetic trees does not in itself translate into signifi-cantly greater acceptance of evolution. Although students in the F09 semester had significant improvements in tree thinking, they did not show the corresponding increases in acceptance of evolution. Tree thinking does require understanding fundamental concepts and principles of evolutionary theory. However, promoting increased 0 10 20 30 40 50 60 70 80 90 100
Correctly intrpret traits/speciation in phylogenies (T11-14) Correctly identify identical phylogenies with different node rotations (T5 & T10) Determine relationships by reading across tips* (T7 -T8) Determine relationships by node counting* (T7-T8) Correctly determine relationships in phylogenies (T6-T9) Nodes in phylogenies indicate hybridization* (T4) Nodes in phylogenies indicate speciation/common ancestors (T4) Lines in phylogenies indicate different lineages (T3) Correct understanding of time in phylogenies (T1) Phylogenies show relationships among lineages (T2)
Percent of Responses
Pretest
Posttest
Fig. 1 Summary of concepts and skills from S11–F12 TTCI. Percentage of TTCI responses for different tree-thinking concepts and skills. Miscon-ceptions and incorrect methods of determining relationships are indicated by an asterisk. TTCI questions addressing a concept or skill are given in
acceptance of evolution requires that students also put tree thinking into a larger context and understand how phylogenies serve as a conceptual starting point for researchers investigating evolution. We think that this is the key benefit of our tree-thinking curriculum. It promotes increased acceptance of evolution by helping students improve their understanding of the nature of science and how evolution is studied scientifically (John-son and Peeples 1987; Southerland et al. 2001). For exam-ple, MATE pretest responses in all semesters of the study (Tables 4, 8) indicated that although students understood evolution to be a scientific theory, many did not under-stand how evolution research is conducted or how the available scientific data are evidence of evolutionary processes. Students in the L27 % groups of the MATEPRE assessment in particular responded that although sci-entists accept evolution, they thought that evolutionary theory is neither based on valid scientific experimenta-tion and data nor is it a valid scientific theory (Table 8). These conflicting views strongly suggest that basic unfamiliarity with the nature of science in evolutionary biology research is likely an important factor shaping stu-dents’ acceptance of evolutionary theory.
Doubts about the existence and validity of evidence supporting evolution not uncommon (Alters 2005; Miller et al. 2006; Moore 2008; Smith 2010; Yates and Marek
2014), particularly given the complexities of some data (e.g., molecular sequences) and unfamiliar methods of analysis (e.g., cladistics). Significant increases in accept-ance of evolution for S10 students overall and in the L27 % group were primarily due to responses reporting greater acceptance of the data and research supporting evolu-tionary theory (e.g., statements M2, M4, M6, M8, M12, and M16) in the MATE posttest after the tree-thinking semester, whereas the responses to these questions in the F09 non-tree-thinking semester remained largely the same (Tables 3, 4). Similar changes were also detected in MATEPOST responses for the other four semesters of this study (Tables 3, 8). These results indicate that an increased emphasis on macroevolutionary research and repeated exposure to and experience working with dif-ferent forms of phylogenetic data not only improved students’ understanding of these topics, but also clari-fied how evolution research is conducted, and thereby resulted in a significant increase in students’ acceptance of evolution under the tree-thinking curriculum.
Increased proficiency in a technique or method of anal-ysis such as phylogenetic analanal-ysis does not automatically relate to increased acceptance of evolutionary theory (Sinatra et al. 2008). Instead, we would suggest that the tree-thinking curriculum fosters a deeper understanding of how evolution is scientifically studied and validated, Table 7 Percentage of student responses for each option in 14 TTCI questionsa (labeled T1-T14) in total data pooled across semsters (N = 304) and the percentage of correct responses for each question in the U27 and L27 % groups (N = 82)
Discrimination Index (D) values are given for each TTCI question in the pretest and post-test. Italic indicates percentage of correct answers.
a Question topic areas. Questions 1–4: representation of time and parts of a phylogeny. Questions 5 and 10: comparing node rotations and branching patterns among phylogenies. Questions 6–9, 13: determining relationships among taxa. Question 11: evaluating trait evolution. Questions 12 and 14: comprehensive interpretation of information in phylogeny. Complete TTCI assessment with questions is available in Additional file 1.
T1 T2 T3 T4 T5 T6 T7 T8 T9 T10 T11 T12 T13 T14 Mean (SD)
Pre-test
a 4.1 1.3 7.8 29.7 5.7 63.8 74.0 1.4 11.7 13.5 1.4 36.8 9.8 2.4
b 24.8 53.6 47.3 7.3 78.3 7.6 13.7 45.2 6.8 14.5 14.1 25.4 15.9 19.9
c 10.5 30.9 31.5 26.6 3.0 4.5 5.0 32.8 4.9 13.7 7.2 13.7 23.5 41.5
d 35.5 7.3 6.8 19.5 8.3 13.1 4.8 17.9 28.8 6.0 62.8 12.3 23.9 17.5
e 25.1 6.8 6.5 16.9 4.8 11.0 2.5 2.8 47.7 52.3 14.5 11.7 26.9 18.7
U27% 59.8 72.0 64.6 34.2 91.5 76.8 95.1 51.2 81.7 73.2 75.6 69.5 54.9 42.7 67.3 (17.5)
L27% 17.1 30.5 37.8 11.0 56.1 47.6 51.2 18.3 8.5 29.3 41.5 11.0 9.8 6.1 26.8 (17.5)
D 0.43 0.41 0.27 0.23 0.35 0.29 0.44 0.33 0.73 0.44 0.34 0.59 0.45 0.37 0.45 (0.13)
Post-test
a 3.9 2.9 1.4 7.3 6.3 69.0 81.9 0.3 7.5 11.8 2.2 65.1 13.3 2.5
b 13.1 74.0 88.0 17.2 88.8 3.5 2.2 37.9 1.7 4.8 29.6 17.8 11.1 25.3
c 3.9 10.9 8.7 63.8 0.7 0.0 8.6 58.2 3.1 1.9 2.2 2.3 18.0 26.3
d 50.3 6.3 0.7 3.6 0.7 8.2 3.5 1.6 17.0 0.6 63.8 7.4 7.3 2.5
e 28.8 5.9 1.2 8.1 3.5 19.3 3.8 1.9 70.7 80.9 2.2 7.4 50.3 43.4
U27% 65.9 90.2 98.8 89.0 95.1 81.7 96.3 89.0 97.6 97.6 80.5 89.0 91.5 74.4 88.3 (9.64)
L27% 30.5 54.9 76.8 39.0 80.5 46.3 64.6 26.8 40.2 51.2 52.4 25.6 15.9 13.4 44.2 (20.9)
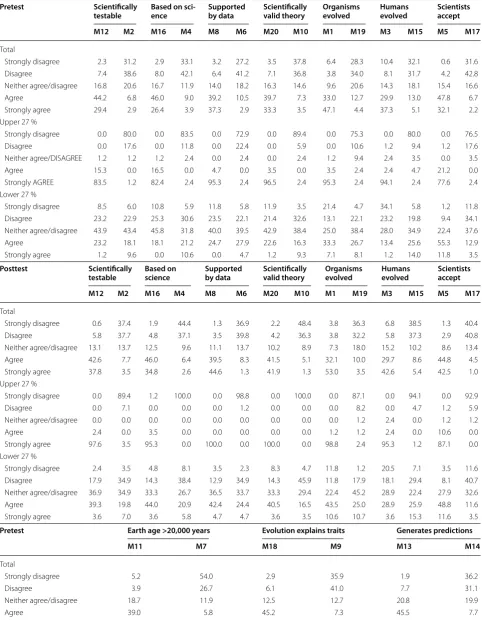
Table 8 Pooled MATE statement responses S11–F12 Pretest Scientifically
testable Based on sci‑ence Supported by data Scientifically valid theory Organisms evolved Humans evolved Scientists accept
M12 M2 M16 M4 M8 M6 M20 M10 M1 M19 M3 M15 M5 M17
Total
Strongly disagree 2.3 31.2 2.9 33.1 3.2 27.2 3.5 37.8 6.4 28.3 10.4 32.1 0.6 31.6
Disagree 7.4 38.6 8.0 42.1 6.4 41.2 7.1 36.8 3.8 34.0 8.1 31.7 4.2 42.8
Neither agree/disagree 16.8 20.6 16.7 11.9 14.0 18.2 16.3 14.6 9.6 20.6 14.3 18.1 15.4 16.6
Agree 44.2 6.8 46.0 9.0 39.2 10.5 39.7 7.3 33.0 12.7 29.9 13.0 47.8 6.7
Strongly agree 29.4 2.9 26.4 3.9 37.3 2.9 33.3 3.5 47.1 4.4 37.3 5.1 32.1 2.2
Upper 27 %
Strongly disagree 0.0 80.0 0.0 83.5 0.0 72.9 0.0 89.4 0.0 75.3 0.0 80.0 0.0 76.5
Disagree 0.0 17.6 0.0 11.8 0.0 22.4 0.0 5.9 0.0 10.6 1.2 9.4 1.2 17.6
Neither agree/DISAGREE 1.2 1.2 1.2 2.4 0.0 2.4 0.0 2.4 1.2 9.4 2.4 3.5 0.0 3.5
Agree 15.3 0.0 16.5 0.0 4.7 0.0 3.5 0.0 3.5 2.4 2.4 4.7 21.2 0.0
Strongly AGREE 83.5 1.2 82.4 2.4 95.3 2.4 96.5 2.4 95.3 2.4 94.1 2.4 77.6 2.4
Lower 27 %
Strongly disagree 8.5 6.0 10.8 5.9 11.8 5.8 11.9 3.5 21.4 4.7 34.1 5.8 1.2 11.8
Disagree 23.2 22.9 25.3 30.6 23.5 22.1 21.4 32.6 13.1 22.1 23.2 19.8 9.4 34.1
Neither agree/disagree 43.9 43.4 45.8 31.8 40.0 39.5 42.9 38.4 25.0 38.4 28.0 34.9 22.4 37.6
Agree 23.2 18.1 18.1 21.2 24.7 27.9 22.6 16.3 33.3 26.7 13.4 25.6 55.3 12.9
Strongly agree 1.2 9.6 0.0 10.6 0.0 4.7 1.2 9.3 7.1 8.1 1.2 14.0 11.8 3.5
Posttest Scientifically
testable Based on science Supported by data Scientifically valid theory Organisms evolved Humans evolved Scientists accept
M12 M2 M16 M4 M8 M6 M20 M10 M1 M19 M3 M15 M5 M17
Total
Strongly disagree 0.6 37.4 1.9 44.4 1.3 36.9 2.2 48.4 3.8 36.3 6.8 38.5 1.3 40.4
Disagree 5.8 37.7 4.8 37.1 3.5 39.8 4.2 36.3 3.8 32.2 5.8 37.3 2.9 40.8
Neither agree/disagree 13.1 13.7 12.5 9.6 11.1 13.7 10.2 8.9 7.3 18.0 15.2 10.2 8.6 13.4
Agree 42.6 7.7 46.0 6.4 39.5 8.3 41.5 5.1 32.1 10.0 29.7 8.6 44.8 4.5
Strongly agree 37.8 3.5 34.8 2.6 44.6 1.3 41.9 1.3 53.0 3.5 42.6 5.4 42.5 1.0
Upper 27 %
Strongly disagree 0.0 89.4 1.2 100.0 0.0 98.8 0.0 100.0 0.0 87.1 0.0 94.1 0.0 92.9
Disagree 0.0 7.1 0.0 0.0 0.0 1.2 0.0 0.0 0.0 8.2 0.0 4.7 1.2 5.9
Neither agree/disagree 0.0 0.0 0.0 0.0 0.0 0.0 0.0 0.0 0.0 1.2 2.4 0.0 1.2 1.2
Agree 2.4 0.0 3.5 0.0 0.0 0.0 0.0 0.0 1.2 1.2 2.4 0.0 10.6 0.0
Strongly agree 97.6 3.5 95.3 0.0 100.0 0.0 100.0 0.0 98.8 2.4 95.3 1.2 87.1 0.0
Lower 27 %
Strongly disagree 2.4 3.5 4.8 8.1 3.5 2.3 8.3 4.7 11.8 1.2 20.5 7.1 3.5 11.6
Disagree 17.9 34.9 14.3 38.4 12.9 34.9 14.3 45.9 11.8 17.9 18.1 29.4 8.1 40.7
Neither agree/disagree 36.9 34.9 33.3 26.7 36.5 33.7 33.3 29.4 22.4 45.2 28.9 22.4 27.9 32.6
Agree 39.3 19.8 44.0 20.9 42.4 24.4 40.5 16.5 43.5 25.0 28.9 25.9 48.8 11.6
Strongly agree 3.6 7.0 3.6 5.8 4.7 4.7 3.6 3.5 10.6 10.7 3.6 15.3 11.6 3.5
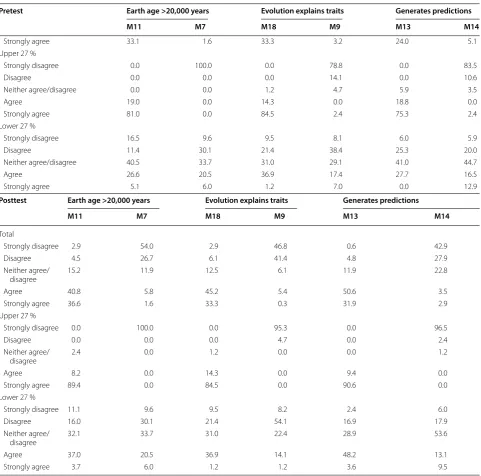
Pretest Earth age >20,000 years Evolution explains traits Generates predictions
M11 M7 M18 M9 M13 M14
Total
Strongly disagree 5.2 54.0 2.9 35.9 1.9 36.2
Disagree 3.9 26.7 6.1 41.0 7.7 31.1
Neither agree/disagree 18.7 11.9 12.5 12.7 20.8 19.9
which is likely critical to improving acceptance of evolu-tionary theory. Regardless of what students believe, and MATE responses indicate that some students continue to hold beliefs that are not completely consistent with evolution, students showed an improved understanding of the methods and evidence supporting evolutionary theory, which was responsible for the increased MATE scores. The tree-thinking focus in the introductory
curriculum provides a larger, unifying conceptual frame-work throughout the course that presents, for what is likely the first time for many students, how biologists study evolution.
Evolution is a complex theory that requires synthesis of many different forms of data. By presenting students with tree thinking activities that draw upon examples using ecological, genetic, developmental, behavioral, and other Table 8 continued
Pretest Earth age >20,000 years Evolution explains traits Generates predictions
M11 M7 M18 M9 M13 M14
Strongly agree 33.1 1.6 33.3 3.2 24.0 5.1
Upper 27 %
Strongly disagree 0.0 100.0 0.0 78.8 0.0 83.5
Disagree 0.0 0.0 0.0 14.1 0.0 10.6
Neither agree/disagree 0.0 0.0 1.2 4.7 5.9 3.5
Agree 19.0 0.0 14.3 0.0 18.8 0.0
Strongly agree 81.0 0.0 84.5 2.4 75.3 2.4
Lower 27 %
Strongly disagree 16.5 9.6 9.5 8.1 6.0 5.9
Disagree 11.4 30.1 21.4 38.4 25.3 20.0
Neither agree/disagree 40.5 33.7 31.0 29.1 41.0 44.7
Agree 26.6 20.5 36.9 17.4 27.7 16.5
Strongly agree 5.1 6.0 1.2 7.0 0.0 12.9
Posttest Earth age >20,000 years Evolution explains traits Generates predictions
M11 M7 M18 M9 M13 M14
Total
Strongly disagree 2.9 54.0 2.9 46.8 0.6 42.9
Disagree 4.5 26.7 6.1 41.4 4.8 27.9
Neither agree/
disagree 15.2 11.9 12.5 6.1 11.9 22.8
Agree 40.8 5.8 45.2 5.4 50.6 3.5
Strongly agree 36.6 1.6 33.3 0.3 31.9 2.9
Upper 27 %
Strongly disagree 0.0 100.0 0.0 95.3 0.0 96.5
Disagree 0.0 0.0 0.0 4.7 0.0 2.4
Neither agree/
disagree 2.4 0.0 1.2 0.0 0.0 1.2
Agree 8.2 0.0 14.3 0.0 9.4 0.0
Strongly agree 89.4 0.0 84.5 0.0 90.6 0.0
Lower 27 %
Strongly disagree 11.1 9.6 9.5 8.2 2.4 6.0
Disagree 16.0 30.1 21.4 54.1 16.9 17.9
Neither agree/
disagree 32.1 33.7 31.0 22.4 28.9 53.6
Agree 37.0 20.5 36.9 14.1 48.2 13.1
Strongly agree 3.7 6.0 1.2 1.2 3.6 9.5
forms of data, the tree-thinking curriculum provides a framework to synthesize data across different fields and show how they converge in support of evolutionary the-ory. Additionally, the curriculum focuses on macroevolu-tion, which is an important, fundamental component of evolutionary theory that often receives scant emphasis in evolution education. The increased emphasis on macro-evolution provides additional perspectives on macro-evolution and the nature of science, both of which are necessary to develop a broader understanding, appreciation, and acceptance of evolutionary theory (Johnson and Peeples 1987; Southerland et al. 2001; Southerland and Sinatra 2005; Hawley et al. 2011).
Correctly applying tree thinking requires a fundamen-tal understanding that lineages of different taxa descend and diverge from one another through a series of nested ancestor-descendent relationships. We expected that by establishing how evolution is based on tangible and uncontroversial processes of inheritance, students should develop a better understanding of how genetic data provide a record of successful reproduction and trans-mission of information across generations. The tree-thinking curriculum focused on demonstrating how DNA and other forms of data based on genetics (e.g., structural and developmental homology) can provide highly informative, empirical evidence about the histori-cal relationships within and among lineages that can be
used in evolutionary studies. By teaching phylogenetic approaches and tree thinking, we predicted that students would learn about and gain experience using the phylo-genetic framework biologists use to develop hypotheses and explore questions about how organisms and their features evolve.
Tree thinking involves not only the technical aspect of reading phylogenies, but also using an overarching understanding of evolution as an emergent biological phenomenon and how these diagrams graphically rep-resent the nested hierarchy and descent from a common ancestor that are the core of evolution research. Thus, the ability to read and interpret trees correctly reflects not only proficiency in using specific skills, but also an understanding of the evolutionary basis of these dia-grams. The results of our study support the use of tree thinking as a curricular theme in introductory biology education and demonstrate how a curriculum focused on tree thinking helps students learn not only an important skill, but can also promote greater acceptance of evolu-tion. In particular, efforts to improve evolution education should continue to explore the relationship between stu-dents’ understanding of the nature of science in evolu-tion research and their acceptance of the theory (Johnson and Peeples 1987). Further studies should also strive to identify whether there are certain activities we used or specific aspects of tree-thinking curriculum that have Table 9 Correlation and linear regression analysis of TTCI and MATE scores
Model variables, Spearman’s rho (ρ) correlation coefficients for each variable, and estimated B–values in linear regression analysis of TTCI and MATE pretest and posttest scores for the S11 through F12 semesters. * p < 0.05, ** p < 0.01, *** p < 0.001.
Response coding. Year: Freshman = 1, Sophomore = 2, Junior = 3, Senior = 4, Other = 5. Major: Non-Major = 0, Life Science Major = 1, High School Biology: No = 0, yes = 1. Previous College/University Biology With Evolution: No = 0, Yes = 1. Seen phylogenetic trees previously: No = 0, Not Sure = 1, Yes = 2. Learned to read phylogenetic trees previously: No = 0, Yes = 1.
Variables ρ B Variables ρ B
MATEPRE MATEPOST
Year 0.109 1.268 Year 0.189*** 1.657***
Major 0.001 1.681 Major 0.018 1.674
College/University Introductory Biology 0.121* 2.105 College/University Introductory Biology 0.096 −0.031
Seen trees before 0.236*** 4.09** Seen trees before 0.255* 1.225
Learned to read previously 0.135* –0.88 Learned to read previously 0.145* 0.297
TTCIPRE 0.243*** 1.297*** MATEPRE 0.815*** 0.637***
TTCIPRE 0.180** −0.224
TTCIPOST 0.354*** 0.628***
MATEPOST
Year 0.189*** 1.645***
Major 0.037 1.521
College/University Introductory Biology 0.128** −0.633
Seen trees before 0.255* 1.296
Learned to read previously 0.145* 0.440
MATEPRE 0.815*** 0.647***