The Eects of Competition in Consumer Credit Markets*
Stefan Gissler, Rodney Ramcharan, and Edison Yu**
September 19, 2018
Abstract
Using changes in nancial regulation that create exogenous entry in some consumer credit markets, we nd that increased competition induces banks to become more spe-cialized and ecient, while deposit rates increase and borrowing costs for riskier collat-eral decline. However, shadow banks change their credit policy when faced with more competition, and aggressively expand credit to riskier borrowers at the extensive margin, resulting in higher default rates. These results show how the form of intermediation can shape economic uctuations. They also suggest that increased competition can lead to large changes in credit policy at institutions outside the traditional supervisory umbrella, possibly creating a less stable nancial system.
I. Introduction
The consequences of nancial sector competition are ambiguous. Greater competition in credit markets can generate more ecient intermediation, reduce borrowing costs and relax credit
con-straints for marginalized borrowers.1 But more competition can also erode the protability of
incumbent nancial institutions, leading to riskier lending and more unstable banking.2 In the
most extreme case, increased competition can foster an ex-post misallocation of credit to riskier borrowers, producing asset price booms and busts, as well as profound and long lasting shifts in nancial regulation (Mian and Su (2009), Favara and Imbs (2015), and Rajan and Ramcharan (2015)). In the decades after the Great Depression for example, regulatory policy, like Glass-Steagall, explicitly sought to restrain banking competition and create local monoplies across the US in order to contain risk-taking (Shull and Hanweck (2001)).
Understanding the eects of nancial sector competition is clearly important then for evalu-ating theories that link intermediation to economic uctuations and for designing nancial regu-lation (Brunnermeier and Sannikov (2014), He and Krishnamurthy (2015), Gertler and Kiyotaki (2010)). But because unobserved factors that determine entry into markets also shape ex-post outcomes|endogenous entry|identifying the eects of nancial sector competition is dicult. To understand better the consequences of nancial sector competition, this paper uses recent changes in federal regulations that allowed some credit unions (CUs) to compete directly with banks and shadow banks{examples of the latter include captive auto lenders and pools of private capital that originate and securitize consumer loans.
CUs are a major source of consumer nance in the US. Individuals with a common bond|such as employees of a university or residents of a town|can establish a credit union (CU) to access
1Recent academic surveys include Allen and Gale (2004), Beck (2008), Claessens (2009); Vives (2016) provides a
book length treatment of many of the underlying theoretical ideas. Bernanke (2009) and Vickers (2010) discuss some of the policy issues surrounding nancial competition within the US and international contexts respectively. Earlier work on the distributional eects of credit access includeAghion and Bolton (1997), Banerjee and Newman (1991), and Galor and Zeira (1993). Also see
2Bhattacharya (1982), Keeley (1990), Murdock et al. (2000), and Besanko and Thakor (2004) are seminal references
nancial services. The industry serves about 105 million people; has about $1.4 trillion in assets; originates roughly 28 percent of all new car loans and accounts for over 25 percent of all consumer
unsecured lending in the US.3 The analysis is thus not only of broad economic signicance, but the
regulatory change that we use is a new and plausibly exogenous source of variation in entry across local credit markets.
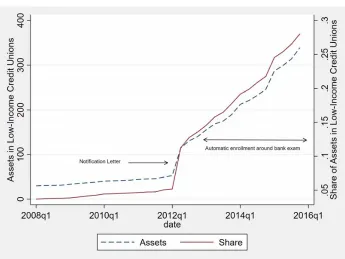
CUs are traditionally restricted from intermediation outside of the common bond. But under the \low income" rule, some CUs that serve lower income areas have long been exempted from this competition restriction, and can freely lend or accept deposits outside their common bond. Beginning in 2008, the industry's federal regulator changed both the legal eligibility standard for the \low income rule" and eventually the process by which a CU could become eligible. Competition increased sharply thereafter. By 2016, the total assets of \low income" CUs, those now able to compete directly with incumbent institutions, rose to nearly $400 billion|an almost 8 fold increase compared to 2008.
The research design exploits the fact that to reduce the regulatory burden of demonstrating eligibility under the revised legal standard, the federal regulator eventually determined each CU's eligibility for the low income exemption at the time of the supervisory exam. Examination sched-ules are on a preset cycle. Their timing is not driven by local economic conditions, expectations about future lending opportunities within the local market, beliefs about local demand, or the behavior of local incumbent intermediaries. This link between the timing of \entry"|the lifting of the common bond competition restriction|and the supervisory exam schedule is a potentially exogenous increase in local competition. Notably, in each of the four quarters before a CU becomes designated as a low income credit union (LICU), there is no change in lending or any other balance sheet observable. But once designated, there is an immediate surge in marketing expenses followed by a signicant balance sheet expansion. We study the impact of this increased competition on both incumbent banks, as well as on shadow or non-banks.
Among banks, there is a mirror decline in lending and deposit growth when the number of nearby LICUs increases|those within a ve-mile radius of the bank's headquarters. Because many banks set their loan and deposit pricing at the branch level, we also study the eects of competition
3See Experian's 2007 report on
using bank branch-level data on pricing. The evidence shows that deposit interest rates increase and lending rates decline sharply, especially for riskier collateral (Goldstein and Pauzner (2005)). For example, the rate on used car loans declines by about 10 basis points one year after a standard deviation increase in the number of low-income CUs within a 5-mile radius of the bank's branch.
In keeping with the narrative and statistical evidence pointing to exogenous \entry", these results are robust to including very ne spatially dis-aggregated parametric controls, such as zip-code level house prices changes and non-parametric controls such as census tract xed eects as well as county by year-quarter xed eects. To be sure, this was also a period of large-scale changes in banking regulation, and these results remain robust when restricting the sample to smaller banks{those banks that were exempted from most of the regulatory overhaul and were also subject to the same regulatory shocks as CUs. Also, various banking regulations were announced and implemented in dierent years during the sample period, and the results are robust to excluding sequentially these various years.
There is also evidence that increased competition drives selective survivorship and improves eciency. LICU entry is associated with more bank failures, especially among the smaller, less well capitalized banks. Banks also respond to increased LICU competition by becoming more
specialized.4 CUs traditionally lend to consumers and we nd that banks tend to accommodate
LICU entry by shifting their loan portfolio towards commercial and industrial loans. After a one standard deviation increase in LICU competition, the growth in commercial and industrial loans increases by about 0.14 percentage points. This shift in the loan product mix and the reduced substitutability between the two types of institutions is also associated with improved protability at surviving banks when LICU competition increases.
Shadow banks are likely to respond very dierently to increased competition. These insti-tutions, like captive auto-nance lenders and private funding pools, are thinly capitalized, highly specialized, unregulated institutions that mainly use short-term credit markets to fund arms-length consumer loans, which are then securitized (Benmelech et al. (2017)). Also, non-banks usually have little alternative to lending in their primary market and make riskier loans, since they face fewer regulatory constraints and can in principle diversify risks through securitization (Gennaioli and
4This result is related to a rich and large literature on competition and specialization more generally{see for
Shleifer (2010)). To understand the eects of increased competition at the extensive margin across dierent types of lenders, we use individual-level data that identify the Equifax Risk Score, zip-code and importantly whether the lender in each car loan is a bank, CU or a non-bank.
The data show that competition aects an expansion in automobile lending at the extensive margin as well as a dramatic reallocation of credit towards subprime borrowers|a \race to the bottom". Much of this shift in credit policy appears to be driven by non-bank lenders. At the extensive margin, the estimates show that a one standard deviation increase in the number of LICUs is associated with a 0.7 percent increase in the number of newly originated car loans inside a zip code over the next twelve months. Of which, the number of newly originated loans increase by about 0.5 and 1.2 percent, respectively for CUs and non-banks. In keeping with the balance sheet evidence indicating that banks tended to accommodate entry by shifting towards business lending, the impact of increased competition on car loan origination is insignicant among banks.
Information on borrower Equifax Risk Scores help us measure the extent of the credit policy shift. We nd that both CUs and non-banks expand credit at the extensive margin sharply towards borrowers in the bottom quartile of the credit risk distribution. For this riskiest sample of borrowers, a one standard deviation increase in competition is associated with a 1.2 percent increase in newly originated car loans by CUs and a nearly 2.2 percent increase by non-bank lenders. The eects are economically and statistically insignicant for safer borrowers. Notwithstanding the exogeneity in the timing of LICU designations, a concern is that aggregate regulatory and funding shocks might have allowed non-banks to expand credit into riskier areas during this period, helping to explain the simultaneous LICU and non-bank credit expansion. We show however that these results are robust to most parametric and non-parametric controls, including zip-code specic time trends. We also nd evidence that this reallocation in automotive credit to riskier borrowers on account of increased competition is also associated with a signicant increase in non-performing loans.
regu-lated|shadow banks. That competition is also associated with rising delinquencies and leverage suggests that some of the credit expansion might be socially inecient.
We cannot measure the net present value of the loans at the time of origination, but increased competition from the regulated nancial system that induces the shadow banking system to orig-inate and distribute a greater volume of riskier loans can lead to greater fragility, especially if \neglected risks" materialize (Gennaioli et al. (2015)). This evidence on a competition induced increase in risk-taking by the unregulated non-bank sector also weighs against the common pol-icy view that enhanced supervision of the traditional banking sector allows economies to reap the
benets of increased competition while mitigating socially harmful risk-taking.5
This is the rst paper to use the relaxation in lending and deposit-taking restrictions at CUs to study the eects of competition on both banks and shadow banks. But we build on important literatures that have used various deregulation waves across US states beginning in the 1970s, or the variation in cross-state regulatory environments in the period before the Great Depression to tackle the identication problem inherent when studying the eects of entry (Jayaratne and Strahan
(1998) and Carlson and Mitchener (2006)).6 The most common interpretation of this literature is
that increased competition in the nancial sector leads to greater eciency and faster economic growth.
But evidence drawn largely from only two sources of variation and built upon mostly aggre-gate data|state or county level data|leaves considerable uncertainty about its interpretation and generalizability to dierent environments. Also, this evidence cannot identify easily the dierent mechanisms posited by theory. For example, the waves of post-1970s deregulation occurred against a backdrop of relatively rapid and stable economic growth, making it hard for these studies to detect any eects of competition on nancial fragility. And the absence of data on credit standards and risk pricing leave unclear exactly how competition might have improved credit access at the extensive margin. Also, the modern nancial system diers considerably from those empirical set-tings, as both highly regulated depository institutions and the shadow banking system now compete
5see the discussion in the Economist
https://www.economist.com/nance-and-economics/2009/06/25/deliver-us-from-competition
6There is also a sizable literature that uses cross-country variation in nancial regulation to understand the eects
directly in many credit markets. Yet little is known about how the unregulated \system" might
respond to increased competition from the regulated \system".7
II. Research Design
To understand the eects of competition in credit markets, we use changes in federal regulations that relaxed restrictions on some credit unions' ability to compete directly with banks and non-bank nancial institutions for loans and deposits in local markets. This subsection oers narrative and statistical evidence on why this regulatory change is a conditionally exogenous source of variation in entry into local credit markets across the US that can help identify the eects of competition on both banks and non-banks.
A. The Narrative Evidence
Credit unions (CU) are not-for-prot tax-exempt nancial institutions that operate in the model of traditional relationship-based nancial intermediation. Employees of a specic corporation|fraternal bonds|or residents that live within a particular radius of a town|geographic bond|might for example form a CU in order to use relationship-based nancial services. They fund themselves pri-marily through membership deposits and do not usually raise outside equity or use subordinated debt. CUs also make loans to geographically proximate consumers and small business within the same narrow eld of membership or bond. The National Credit Union Administration (NCUA) is the industry's federal regulator.
In exchange for CU's tax-exempt status, federal regulations and the courts have traditionally restricted CU's ability to compete with banks. To be sure, the boundaries of competition between banks and CUs remain highly contested and continue to be shaped by ongoing legal and political
pressure.8 But generally, on the liability side of the balance sheet, CUs are not allowed to compete
7The United States has had signicant experience with competition between dual banking systems. In the decades
prior to the Great Depression, there was an explosion of banks, as both state and national bank regulators competed by issuing new bank charters and making credit more easily available. Observers at the time noted that this compe-tition led to rampant over-banking and greater instability: \One of the major causes of lax-chartering policies was competition between the national and state banking systems. Unfortunately, this competition was not always in the eld of the banking virtues{not always intent on winning the distinction of having the best banks and the most able bankers{but rather it appeared at times controlled by the ambition to have the most banks in the greatest number of places"{page 12, the Economic Policy Commission, 1935.
8Competitive pressures between banks and CUs have long led to legal and legislative battles. Beginning in the mid
with banks for deposits and can only accept deposits from members within their chartered eld of membership. Lending is also similarly restricted to members within the same eld of membership. These regulations further restrain the scope for competition in commercial lending, capping a credit union's member business lending|commercial and industrial loans|to either 1.75 times the net
worth of a well-capitalized credit union or 12.25 percent of total assets.9
However, the Federal Credit Union Act of 1972 authorizes the NCUA to designate a credit union as \low income", allowing the designated CU to operate outside of its eld of membership and compete directly with banks and non-banks for deposits and lending opportunities. In 1993, the NCUA specied that a federal credit union qualied for \low-income" designation if more than 50 percent of its membership was low income. Under the 1993 rule, to be \low income", a member's household income needed to be less than or equal to 80 percent of the national median household income. These regulations also provided an adjustment for higher cost areas derived from data from the Employment and Training Administration of the Department of Labor.
In 2006, an NCUA task force found the \low-income" regulation outdated and impractical. The task force noted that the use of the \household income" standard in the 1993 rule was inconsistent with the subsequent adoption of the family income standard by other federal agencies when dening
economically undeserved areas.10 The task force also noted that the Department of Labor based
adjustment for high cost areas was outdated and geographically incomplete. In response to these ndings, in 2008 the NCUA revised the 1993 low-income rule and adopted the family income
standard for 2009. Figure 1 summarizes the key institutional changes in this rule.11
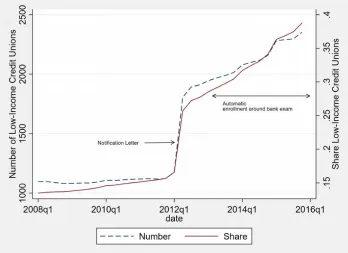
The 2009 rule change had little impact on the number of LICUs (Figures 2 and 3). Many
Congress eventually sided with the CU industry. In the 1990s, the ABA sued to stop the formation of CUs based on multiple common bonds. The Supreme Court sided with the ABA, but Congress quickly allowed multiple common bonds, in exchange for restrictions on CU business lending. More recently, community bankers sued the NCUA in 2016 to stop CUs from purchasing commercial loans and loan participation originated by other institutions without counting these loans against their restrictions on business lending|the courts sided with the NCUA. The ABA also led suit against the NCUA in 2016 because of a loosening of eld of membership restrictions for community-chartered CUs that allowed these institutions to serve large geographic areas; this case remains in litigation. See the surveys in https://www.americanbanker.com/news/credit-unions-vs-banks-how-we-got-here
9See the Credit Union Membership Access Act (CUMAA) (P.L.105-219) passed in 1998
10Notably, the US Treasury provides support for nancial institutions|the Community Development Banking and
Financial Institutions Act of 1994|that operate in the undeserved areas|these areas are in part legally identied using the 80 percent family income standard for the census tract.
11See for example page 9 of
https://www.ncua.gov/services/Pages/small-credit-union-initiatives/Documents/Maximizing-Low-Income-Designation.pdf. Also see the following links for more information: https://www.ncua.gov/Legal/Documents/LowIncomeDesignationFactSheet.pdf
credit unions were unaware of the rule change, or were uninterested in the benets low-income
designation due to the often dicult application process.12 The industry was also confused by
the new family income standard. Many CUs had little current data from their membership on either members' individual or especially family income. And for those with individual membership income data, it was unclear whether these data could be legally benchmarked against the family income standard. The NCUA thus issued a revised low-income rule in 2010 that claried the income standard: Individual income data would be benchmarked against median individual income data from the 2010 US Census; while family income data would be benchmarked against median family income in the Census.
Central to our identication strategy, the 2010 revision also linked low-income designation to the timing of the supervisory bank exam:
\NCUA will make the determination of whether a majority of a FCU's members are low-income based on data it obtains during the examination process. This will involve linking member address information to publicly available information from the U.S. Census Bureau to estimate member earnings. Using automated, geo-coding software, NCUA will use member street addresses collected during FCU examinations to deter-mine the geographic area and metropolitan area for each member account. NCUA will then use income information for the geographic area from the Census Bureau and assign
estimated earnings to each member."13
Under this 2010 revision then, CUs earliest on the examination schedule would be notied sooner of their LI eligibility; those eligible for designation quickly selected into low-income status. The key facts are that the timing of these supervisory examination schedules are pre-specied and are not driven by local economic conditions, expectations about future lending opportunities within the local market, beliefs about local demand, or the behavior of local banks|banks are regulated and examined independently by the Federal Reserve and state banking authorities. Thus, this linking of entry into LI status with the timing of the supervisory exam represents a potentially exogenous
12Consider the following quote from Joseph Thomas Jr., the CEO of Fairfax County Federal Credit Union, on
his CU's LI eligibility: \We were very surprised to nd that we were eligible". This CU has about 14,500 mem-bers, mostly active or retired Fairfax county government employees, and is located just 25 miles from the NCUA. https://www.bizjournals.com/washington/blog/2014/08/credit-unions-designated-to-serve-low-income.html
redenition of the extent of the market for designated low-income credit unions (LICUs), allowing them to compete directly with local nancial institutions on both sides of the balance sheet.
A notication letter sent in the second quarter of 2012 to 1,003 eligible CUs accompanied the implementation of this revised eligibility process. Within two months of notication, 67 percent
of these institutions selected into low-income status.14 Because the letter was sent to eligible
institutions, of which a sizable majority quickly selected into the program, there is again little concern that beliefs about local demand likely played a signicant role in driving the timing of selection into low income status. Figures 2 and 3 show the eects of this letter and the subsequent automation of eligibility linked to supervisory exams. The fraction of CUs designated as LICU rose from its steady-state level of around 12 percent in 2009 to 36 percent by the end of 2015.
Stepping back from the details, even the overall timing of the LI rule overhaul appears exogenous with respect to broader economic conditions. Recall that the motivation for the revision to the original 1993 rule was begun in 2006, at the peak of the business cycle and did not anticipate the imminent economic collapse and subsequent concerns about local credit supply or demand. Also, the subsequent timing of the rule's nalization and implementation over the sample period was signicantly shaped by the interplay between data constraints and the need to clarify the regulatory standard.
B. The Statistical Evidence
There are possible reasons to be skeptical of the argument that the linking of selection into the LI program to the supervisory exam date provides a conditionally exogenous source of variation in local credit market competition. Weaker nancial institutions are examined over an abbreviated exam cycle{6 months versus the standard 18 month cycle{and it is possible that weaker institutions could enter into low-income status earlier than eligible but stronger credit unions that are examined less frequently. It is also possible that eligible credit unions that face declining local lending opportunities or worsening protability might select earlier into low-income status conditional on eligibility|the standard Ashenfelter dip. At the same time, incumbent banks operating in these local markets might also face a similar decline in lending and protability. These forces can then lead to a spurious association between more low-income CUs|greater competition in an area|and
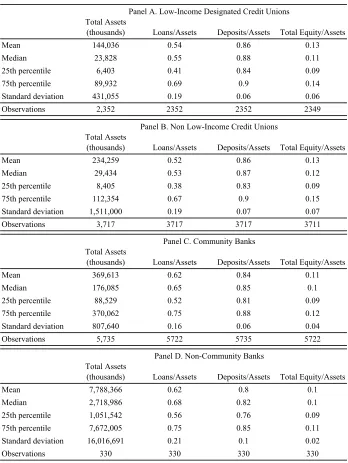
worse outcomes at incumbent nancial institutions. Of course, as Table 1 shows, the median LICU and non-LI CU are very similar on observables, suggesting that they are unlikely to be subject to dissimilar shocks.
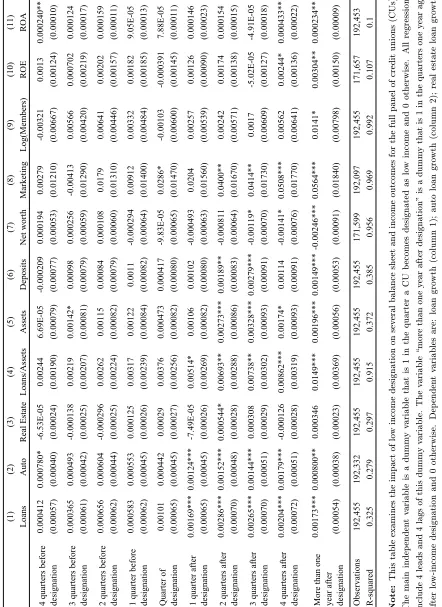
Nevertheless, this narrative evidence is convincing up to a point, and we next turn to statistical evidence on the behavior of credit unions in the period around designation in order to investigate whether balance sheet trends at the CU-level might systematically precede selection into low income CU status. These tests also measure the impact of low income status on subsequent balance sheet and income outcomes, helping to reveal the potential competitive impact of these regulatory changes.
The basic specication uses an indicator variable that equals 1 in the quarter a credit union selects into low-income status and 0 otherwise. To detect pre-existing balance sheet or protabil-ity trends in the quarters before selection into low-income status, the baseline specication also includes four leads of this variable. We also include four lags of this indicator variable, as well as a post-low-income indicator variable that equals one in the years following low income status. To absorb non-parametrically pre-existing factors, like the relative income of a credit union eld of membership that might determine eligibility, all specications include credit union xed eects; we also include the county of headquarters-by-year-quarter xed eects to absorb local economic conditions; standard errors are clustered at the credit union level.
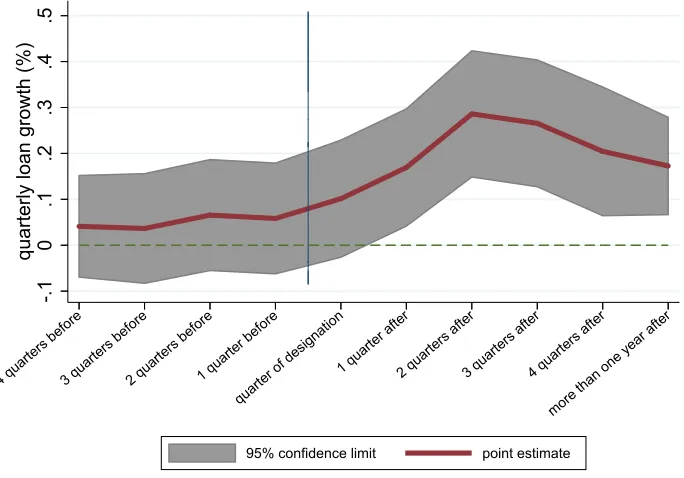
We report the results from these specications in Table 2, which uses the full sample of available credit unions. There is no evidence that the timing of selection into low income status is driven by pre-existing trends in balance sheet outcomes or protability. Instead, entry into low income status leads to a sizable increase in local credit market competition, as LICUs (low income credit union) signicantly expand their marketing and advertising to reach new customers after LI designation. There is a concomitant increase in lending growth, especially in the case of car loans, as well as deposit growth after low income designation.
of designation on lending growth peaks about 2 quarters afterwards, and lending growth is about 0.27 percentage points or 0.11 standard deviation higher than otherwise in that quarter. The long-run eect is also signicant: average lending growth one year and beyond after designation is about 0.1 percentage point higher than otherwise. Figure 4 depicts the ndings in column 1 of Table 2, plotting the coecients in the four quarters before and after designation; and one year after designation.
During the sample period, the NCUA increasingly allowed CUs to broaden the boundaries of competition with other nancial institutions using multiple common bonds. A credit union could for example apply to both serve the teachers of Boston|its traditional eld of membership|and also residents of Massachusetts. This is of course distinct from the LI rule with its exogenous timing, but it could also aect inference. As a robustness check, Table IA.1 in the internet appendix shows that the impact of LI designation on lending growth among CUs with a single bond as well among those that serve multiple bonds is similar.
The CU call report disaggregates lending into broad consumer categories, and columns 2 and 3 of Table 2 suggest that automobile loans accounted for much of the increase in loan growth after low income designation. From column 2, the point estimate in the quarter of designation becomes statistically signicant and is about 100 times larger than the previous quarter. At its peak, about two quarters after low-income designation, the growth in car loans is about 0.16 percentage point or 0.1 standard deviation higher than otherwise.
In contrast, there is no signicant evidence of any change in real estate lending around the low-income designation period. Column 4, using the loan to assets ratio, suggests that low-income CU's rebalanced their assets towards loans after designation, as the ratio of loans to assets increases by about 1.3 percentage points in the years after designation. However, there is also evidence of an expansion at the extensive margin, as asset growth itself is signicantly higher after designation (column 5).
added to net worth, are increasingly lent out, with net worth, the ratio of total equity, which includes retained earnings, to assets, declining by 0.4 percentage points.
A large and immediate increase in marketing and promotional expenses after LI designation appears to help facilitate this balance sheet expansion. The dependent variable in column 8 is the log of \educational and promotional expenses", which captures expenditures on advertising and marketing. In the quarter of designation, these expenses jump by about 3 percent, gradually rising thereafter. One year and beyond after designation, marketing expenses are about 6 percent higher than otherwise. The impact of designation on the log number of members is less rapid, since new customers need not become members immediately, but one year out, membership is about 1.4 percent higher than otherwise (column 9).
Finally, despite the increase in marketing costs to attract new customers, the average return on equity is signicantly higher one year after low-income designation (column 10), and there is no evidence of any trend in earnings in the quarters before low-income designation. Across these specications there is virtually no signicant evidence of any trend in lending, deposit-taking, net-worth protability or even advertising expenses in the quarters before entry into low-income status. Indeed only one out of the 40 coecients in the pre-low-income quarters is signicant (at the 10 percent level)|car loans growth (column 2).
That said, the internet appendix considers a variety of robustness checks to help gauge the sensitivity of these results to the choice of control group. In particular, eligibility for low-income designation is restricted to CUs in lower income areas, but Table 2, which uses the full sample of about 6,000 CUs, includes credit unions in the control group that are ineligible for designation on account of their membership's relative income. It also includes LICUs designated under the previous regulatory regime. In both instances, these institutions could in turn dier in important ways from eligible CUs, resulting in misleading inference.
Table IA.2 excludes the previously designated LICUs; the results remain unchanged. Table IA.3 restricts the sample only to those CUs headquartered in counties that had at least one low income CU designation over the 2009-2016 sample period. This sample of geographically proximate CUs are likely subject to similar shocks, and the undesignated CU-quarter observations are arguably a more realistic control group. The main results are little changed.
CU lending. Table IA.4 re-runs the estimation in Table 2 but restricts the sample to CUs located in census tracts with median income below the national median. These CUs collectively serve econom-ically similar members, and are signicantly more likely to be eligible for low-income designation. The main results remain unchanged.
Finally, Tables IA.5 and IA.6 focus on the cross-section and use propensity score matching based on the pre-existing balance sheet and census tract income of a CU's headquarters to identify the \nearest neighbor" to a LICU (Table IA.6). These \nearest neighbor" CUs are the set of non-LICUs that are most similar to the set of non-LICUs, as determined by their pre-2009 balance sheet and the potential income of their membership. Even within this relatively homogeneous cross-section, there is evidence that lending growth is signicantly higher during the quarters a CU becomes LI relative to its nearest \untreated" or undesignated neighbor.
The statistical evidence in this subsection indicates that lifting regulatory restrictions on lend-ing and deposit-taklend-ing|low income status|led to a signicant increase in intermediation, allowlend-ing designated low-income credit unions to compete directly with local banks and other nancial insti-tutions on both sides of the balance sheet. Equally important, the evidence strongly suggests that the timing of designations across CUs is not driven by pre-existing balance sheet factors or trends in intermediation.
III. The Eects of Credit Market Competition: Banks
A. Basic Results
This subsection examines the impact of LICU competition on banks. Credit unions and local community banks are close substitutes, and the baseline empirical specication restricts the sample to banks that meet the FDIC's denition of community banks{see Table 1 for a comparison between CUs, community banks and large multi-market banks. The FDIC's denition is based in part on a
bank's size, its liabilities and asset composition, and the geographic range of the bank's operations.15
We build on this fact that geography helps dene the extent of the market for most community banks and credit unions and the baseline specication creates a circle of radius 5 miles around the headquarters of each community bank in the sample. We measure competition based on the log number of low-income CUs within this 5-mile radius. The sample period itself extends from 2008 Q1 through 2015 Q4.
Credit unions expanded deposits and lending with some lag after low-income status, and banks are also likely to respond gradually to increased competition. To model these lags, the baseline
specication uses a distributed lag model. Let licjt denote the log number of low-income CUs
located within a 5 mile radius of bank j's headquarters in the current quarter t. And let yjitmeasure
outcomes, such as lending growth, at bank j located in market i|county or census tract|in period t. The estimating equation is thus:
yjit=
k=4X
k=0
t klicjt k+ bj+ ct+ vi+ ejit (1)
The parameters bj, ct and vi are bank, year-by-quarter and local market|county or census
tract|xed eects. In some specications, we also consider local market by year-quarter xed eects to non-parametrically absorb time varying local economic conditions that might jointly determine bank outcomes and the pattern of entry into low-income CU status.
Conversion to low-income status is generally permanent. Even if a CU becomes ineligible for LI status at a subsequent supervisory exam, it can still retain its LI status for 5 more years; thus far, no CU has exited LI status in our sample period. We are therefore interested in the eect of
a permanent increase in competition on bank outcomes over the estimation horizons. The main
tables report the sum of the coecients ft kgk=4k=0 at each horizon along with its corresponding
p-value. For example, the impact of a permanent 10 percent increase in the number of low-income CUs within 5 miles of bank j's headquarters on bank's lending growth over the next 4 quarters
equals: (t+ t 1+ t 2+ t 3+ t 4) 10%. The underlying coecients and their standard
errors are in the appendix.
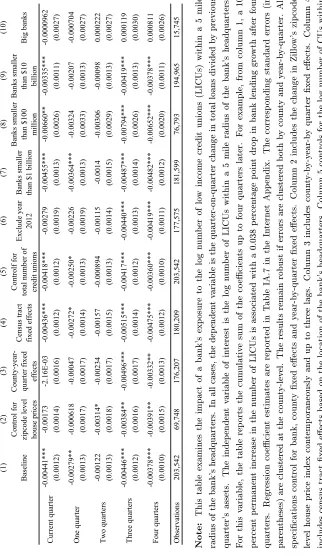
The dependent variable in Table 3 is the quarter on quarter change in loans divided by total
assets in the previous quarter: ((loansjt loansjt 1)/assetsjt 1). Column 1 uses the sample of all
community banks, as designated by the FDIC. The point estimates suggest that after a one standard deviation permanent increase in the number of low-income CUs within a bank's neighborhood|the 5 mile radius of the bank's headquarters|the incumbent bank's lending growth declines by about 0.20 percentage points in the current quarter. This immediate response mirrors the results in column 1 of Table 2 which show that low-income designation among CUs is associated with an almost immediate expansion in lending growth and increased marketing expenses. Over the one-year estimation horizon, the cumulative or \long-run" impact of a one standard deviation permanent increase in the number of low-income CUs is a -0.2 percentage point decline in lending growth (p-value=0.00); this decline is about 28 percent relative to the mean lending growth in the sample period.
The community banking business is local, and unobserved local shocks remain a potential source of bias. Notably, CUs eligible for low-income designation are more likely to be located in poorer neighborhoods. And the demand for nancial services could have been more depressed in these areas, helping to explain the negative association between an increase in low-income designation and bank lending growth. The evidence in the previous section, which shows that CU lending actually increased after low-income designation, clearly contradicts this weak demand interpretation: These results more likely reect the eects of competition, as new CU entrants attract business away from local banks.
current and four lags of changes in Zillow's zip code level single family house price index. The zip code is matched to the headquarters of the bank. The sample drops sharply since this index is not available for all zip codes, but the main results remain unchanged.
Community banks sometimes operate branches beyond the zip code of their headquarters, and column 3 uses county-by-year-quarter xed eects to non-parametrically absorb all time-varying economic shocks in the local market. We lose some observations in this specication, but the negative impact of increased competition on bank lending after about a year remains unchanged. Latent relevant economic shocks might be present at a ner level of geography than the county. To address this concern, column 4 uses census tract xed eects to absorb dierences in relative income and local socioeconomic factors that might determine LI eligibility and the subsequent evolution of low-income CUs, along with latent credit demand.
The long-run eect of competition is if anything about 33 percent larger when controlling for census tract xed eects. Also, we have used the log number of low-income CUs within a 5 mile radius to measure competition, but this variable might well be proxying for the overall number of CUs in the area. Column 5 excludes this possibility by directly controlling for the log number of CUs within the same 5 mile radius. The result is identical to the baseline specication.
Also, while the timing of each CU's supervisory exam is orthogonal to economic conditions, the timing of the regulatory letter in 2012 that led to the jump in LICUs in the middle of that year could have been driven by broader economic factors. These factors could in turn shape entry into the LI program and also subsequent bank lending decisions. Column 6 therefore drops 2012 from the sample. The results remain unchanged. All this suggests that local economic conditions do not explain these results.
This was a period of large scale changes in banking regulation, mainly aimed at the larger banks. And since smaller banks rely on these bigger institutions for liquidity and other services, the sample period's spate of regulatory changes aimed at the large banks could still aect our
results.16 Dodd-Frank and Basel increased capital and liquidity standards, mainly for banks with
assets in excess of $50 billion. Also, the Durbin Amendment, imposed a cap on interchange fees, though banks below $10 billion in assets were exempted. Many of these regulations were announced and phased in at dierent times during the sample period. Liquidity regulations were for example
rst nalized in early 2013 (the liquidity coverage ratio) and in 2014 ( the net stable funding ratio){though implementation was gradual thereafter{while the Durbin Amendment was included
in the 2010 Dodd Frank bill, but only fully implemented in 2014 after legal challenges.17.
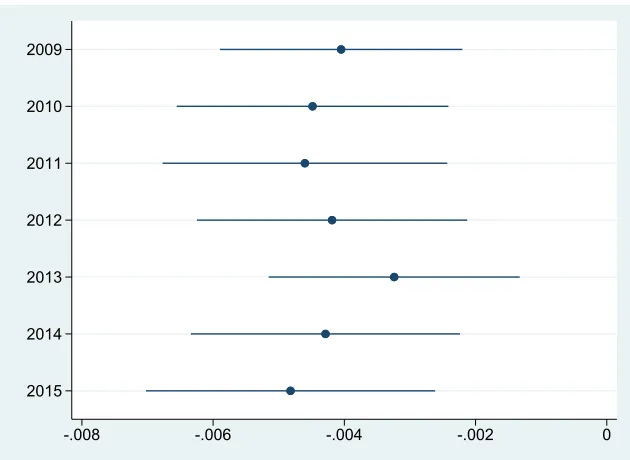
To gauge the impact of these regulatory shocks then, we re-estimate the baseline specication (column 1 of Table 3) but sequentially drop each year from the sample period, beginning with 2009. For concision, Figure 5 reports the cumulative sum of the coecients on the log number of LICUs after four quarters for each of the seven regressions. Despite the signicant variation in regulatory shocks over the sample period, the eects of a permanent increase in LICU entry on bank lending growth is unchanged regardless of which year is dropped from the sample. This stability suggests that these results cannot be easily explained by the announcement or implementation of these various regulatory changes.
The variation in bank size provides another means of gauging the eects of regulation on these results. Specically, if these results conate the possible adverse eects of bank regulatory changes on bank lending with the variation in LI status across the CU industry, our ndings should be weaker for the very small banks; these smaller banks were mostly exempted from much of the regulatory reform. To be sure, the \qualied mortgage rule" could disproportionately aect smaller banks, but as we have already seen, CUs themselves were not major players in this market and were also equally aected by this rule.
In contrast, because most credit unions and smaller banks operate in the same geographic markets and compete for similar customers{the two industries are close substitutes, the competition hypothesis would predict that LICUs will likely have bigger impacts on geographically proximate smaller banks. The remaining columns of Table 3 investigate this hypothesis. Column 7 restricts the sample to those banks below $1 billion in assets|these are considered \level 1" banks and are regulated more similarly to CUs, with less frequent examination cycles and lower capital and other regulatory requirements.
Consistent with the idea that the eects of competition depend on the substitutability between banks and CUs, for the sub sample of banks with assets below $1 billion, the impact of low-income CU competition on lending growth is larger. A one standard deviation permanent increase in the log number of low income credit unions is associated with a cumulative 0.23 percentage point decline
in lending growth over the subsequent year. Column 8 uses the $100 million dollar threshold|the banks with asset size around that of the median CU. For this sub sample, a one standard deviation permanent increase in low-income competition is associated with a 0.28 percentage point drop in lending over the long-run|an impact over 50 percent larger than the full sample. The Federal Reserve denes community banks as those banks owned by banking organizations with assets below
$10 billion in the previous calendar year.18 And rather than the FDIC's denition, column 9 uses
the $10 billion threshold. The results are identical to that obtained in column 1.
Finally, under the competition hypothesis, the impact of an increase in LICUs is unlikely to aect balance sheet aggregates at the larger banks{the non-community banks. These institutions have a substantial lending presence outside of the consumer segment and operate across a much larger geography than community banks. These factors suggest that local entry by LICUs will likely have little impact on loan quantities at the bank-level{the call report data does not disaggregate lending at the branch level. Also, because large banks tend to securitize much of their consumer lending, such as automobile and home loans, regulatory balance sheet data on loans cannot easily measure any changes in lending at the extensive margin in response to competition. From column 10, among the sample of non-community banks, the eect of LICU competition is insignicant.
These results suggests that bank size in conjunction with geography help dene the extent of the market for low-income CU competition. Table 4 makes this point more clearly. Rather than dening a radius of 5 miles around each bank, this table uses the baseline specication but gradually expands the radius, using radii of 10, 20, 30, 40, and 50 miles. For reference, the benchmark 5 mile specication is also included. The cumulative impact of an increase in low-income CU competition at the one-year horizon is largest within the 5 mile window. The point estimate declines as the radii increase, becoming statistically insignicant at the 50 mile window and beyond.
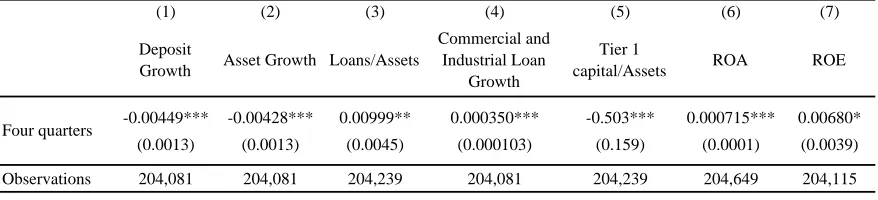
Using the baseline specication, Table 5 focuses on other dimensions of the balance sheet. Low-income CUs compete on the liabilities side of the balance sheet as well, and the dependent variable in column 1 is the growth in deposits, dened similarly to lending growth. There is signicant evidence that deposit growth among incumbent banks declines when competition increases. After 4 quarters, a one standard deviation permanent increase in competition is associated with a 0.2
18See https://www.federalreserve.gov/supervisionreg/topics/community banking.htm. For more on the
percentage point decrease in deposit growth|an impact that is about 18 percent relative to the mean deposit growth rate in the sample. The decline in asset growth (column 2) is also a similar order of magnitude.
We next study how banks adjust their asset composition in response to increased competition. Column 3 uses the loans to asset ratio as the dependent variable. After a one standard deviation increase in competition, this ratio increases by about 0.5 percentage points, suggesting that banks shift their asset composition away from cash and securities towards possibly higher yielding and less liquid loans. Models of competition also predict that incumbents might alter their product mix to reduce substitutability when faced with increased competition. CUs mainly lend to consumers and column 4 shows that in response to increased competition in the consumer market, banks increase their commercial and industrial (C&I) lending. A one standard deviation increase in competition is associated with a 0.01 percentage point increase in C&I loan growth.
Some models of banking also predict that competition can aect a bank's capital structure, and column 5 hints at a moderate decline in the ratio of tier 1 to risk weighted assets when LICUs increase. Columns 6 and 7 report a concomitant increase in protability in response to competition, as both the return to equity and the return to assets increase (columns 6 and 7). From column 6 for example, a one standard deviation increase in competition is associated with a 0.2 percentage point|or a 5 percent standard deviation|increase in the return to equity.
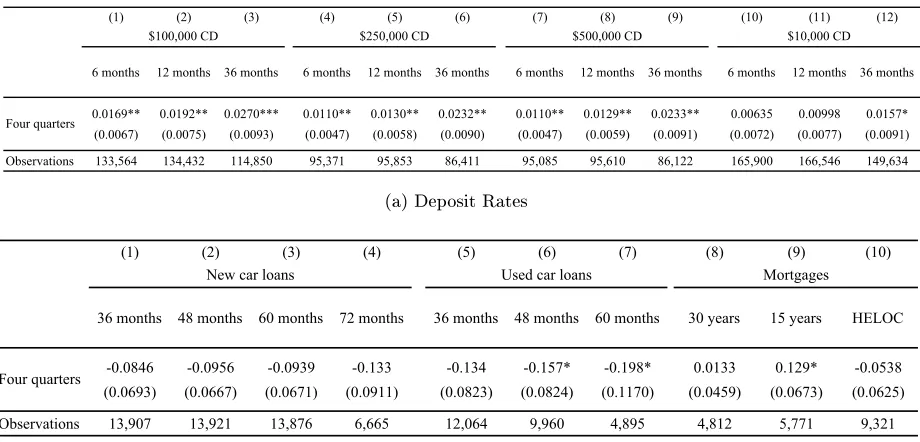
Table 6 uses RateWatch data on deposit and lending rates observed at the bank branch-level to study the eects of competition on pricing. Rate Watch provides weekly information on deposit rates at various maturities for certicates of deposits, and annual data on the oered interest rate at the branch for loans on new and used automobile loans, as well as on various mortgage products. For those banks with rate-setting branches, we use the latitude and longitude of the branch to compute the number of low-income credit unions within a ve-mile radius of the rate-setting branch. Alternatively, if the bank sets interest rates at the headquarters, then we compute the number of low-income credit unions within a ve-mile radius of the bank's headquarters. The results using the branch-level interest rate data are strikingly consistent with those obtained using balance sheet aggregates: Deposit rates increase and loan rates decline when banks face more competition.
It shows that the largest impact is concentrated among longer term CDs with bigger minimums, suggesting that greater competition may have increased the demand for longer duration sources of nancing among nancial institutions. From column 1 of panel (a), a one standard deviation permanent increase in competition from low-income CUs is associated with a cumulative 0.4 per-centage point increase in the 6-month CD rate for $100,000 or higher deposits. This eect increases as the maturity of CDs lengthen, and is about 60 percent larger at the 36 month term relative to the 6 month outcome (column 3). A similar pattern emerges when using CDs with a minimum maturity of $250,000 and $500,000. But at the $10,000 minimum, increased competition is not associated with any signicant impact on deposit rates. The economic eects of these estimates are also sizable. For a $100,000 deposit compounded monthly, this impact suggests an additional $2,400 over a 3 year term.
Panel (b) of Table 6 examines the impact of competition on a variety of automobile and other loan products. Columns 1-4 focus on new car loans at various terms; while columns 5-7 use data on the pricing of used car loans. The remaining columns examine mortgage pricing using rates oered on 30 year, and 15 year xed rate mortgages and home equity lines of credit (HELOCs). We have already seen balance sheet-level evidence that CUs signicantly expanded automobile lending after LI designation and the lifting of the common bond competition restrictions, and the branch-level pricing data corroborates this balance sheet-level evidence.
B. Selection Pressure and Failures
B.1. Failures
Having established the basic eects of competition on balance sheet quantities as well as on loan and deposit pricing, this subsection examines the impact of competition on bank failures. Eco-nomic theory observes that an increase in competition from low-income CUs and the narrowing of interest rate margins|the gap between lending and deposit rates|could help drive out inecient or less protable banks from the sample through failures or mergers. This can make the eects of competition on bank outcomes heterogeneous. While failing or weak banks might experience a sharp drop in lending in the face of low-income CU competition or a loss of deposits, this se-lection mechanism could in turn leave behind survivors that lend more aggressively or shift into loan markets that face less competition from LICUs in order to boost protability and eciency. Given that the number of banks declined by about 1,400 over the sample period; of which, some 475 failed outright, selection pressures could feature in the data, inducing very dierent responses to competition among incumbent survivors.
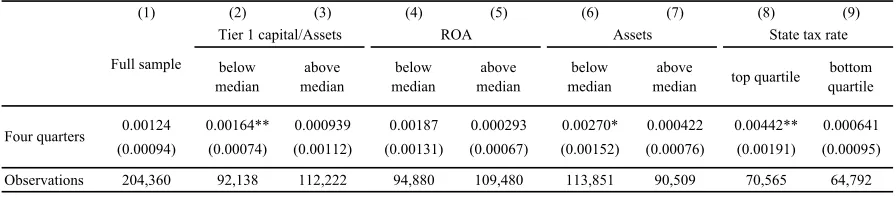
To understand then the eects of competition on failures, Table 7 uses an indicator variable that equals 1 in the quarter that a bank fails and exits the panel, and 0 otherwise. The failures data
are obtained from the FDIC's list of failed banks.19 The specication is the same as the baseline
case (column 1 of Table 3) and the independent variable of interest remains the log number of low-income CUs within 5 miles of the bank's headquarters, along with four lags. Note that the mean probability of observing a failure in the panel is 0.2 percent.
From column 1, which uses the full sample of banks, a one standard deviation increase in the log number of low-income CUs within 5 miles of a bank's headquarters is associated with a cumulative 0.06 percent increase in the probability of failure over the next four quarters. This impact is about a third of the mean failure rate in the sample. But this result likely masks signicant heterogeneity across banks, as a bank's propensity to fail in response to increased competition might depend on its pre-existing regulatory capital and eciency, as well as its size, which can proxy for the bank's diversity of lending opportunities.
The remaining columns of Table 7 examines the impact of increased CU competition on the
probability of failure using the cross-sectional variation in these variables, observed between 2006 and 2007. Columns 2 and 3 restrict the sample to those banks with below median (column 2) and above median (column 3) ratios of tier 1 capital to risk weighted assets, averaged over the pre-sample period, 2006-2007. There is evidence that more thinly capitalized banks are more likely to fail in the face of increased competition. From column 2, a one standard deviation increase in the log number of low-income CUs is associated with a 0.07 percentage point increase in the probability of failure among this below median tier 1 ratio (p-value=0.02). The implied eect in column 3 is smaller and not statistically signicant (p-value=0.39).
Columns 4 and 5 repeat this exercise for banks with below median return on assets (column 4) and above median return on assets (column 5); columns 6 and 7 consider dierences in size, with column 6 restricting the sample to below median assets, and column 7 focusing on above median assets. In all cases, these variables are averaged over 2006-2007. Consistent with theory, there is some evidence that less ecient and smaller banks are more likely to fail and exit the panel in response to increased competition.
Finally, CUs are exempt from federal and state taxes. And under the competition hypothesis, when CUs are able to compete directly with banks, a CU's relative cost advantage will be larger in states where banks face higher corporate taxes. This cost dierential should then amplify the eects of competition in driving out weaker banks. Columns 8 and 9 re-estimate the base model for those banks in the top quartile tax states (column 8) and for banks in states with tax rates in the bottom quartile of the national distribution (column 9). The eects of competition on failures are concentrated in the top quartile states. From column 8, the point estimate is signicant and about 8 times larger than in column 9, where the cumulative eects of competition is not itself not signicant.
IV. Credit Policy, Non-Banks and the Extensive Margin
can increase risk-taking. Also, non-bank nancial institutions, such as captives and other nance companies are major suppliers of consumer credit, and go unmeasured in most regulatory data. At best then, the results thus far provide an incomplete understanding of the eects of competition.
Therefore, this subsection provides more direct tests of the eects of competition using detailed micro-data on automobile lending|one of the key areas of lending expansion after low-income CU designation. In particular, we use the Federal Reserve Bank of New York /Equifax Consumer Credit Panel (CCP) to compute the sum of car purchases that are nanced through auto loans in each zipcode from the rst half of 2009 through the second half of 2017{the data are observed at the 6 month frequency. While the CCP does not identify the lender, in this new version of the
dataset20, it does identify whether the lender was a bank, a CU, or a non-bank lender such as a car
manufacturer's nancing arm or a private pool of capital. The CCP data also contains information on a borrower's Equifax Risk Score, a major credit score created by Equifax and used by lenders to evaluate potential default risk of borrowers.
We can thus measure whether increased competition is associated with a reallocation of con-sumer credit to riskier borrowers|such as those with lower Equifax Risk Scores. We can also measure the response of non-banks and other lenders. And since the CCP is representative of the credit using population, it can also help us to determine whether increased competition leads to an aggregate expansion in automotive credit at the extensive margin or results in substitution away from incumbents towards the new low-income CU entrants. To construct these tests, we compute the log number of newly nanced cars at the zip code level in half-year intervals. We use county by time xed eects to absorb all demand shocks to the county within each half-year interval. The independent variable of interest is the log number of LICUs in the zip code; this variable enters contemporaneously and up to two lags. The baseline also includes the log number of CUs itself in each zip code.
Column 1 of Panel A in Table 8 shows that increased competition is associated with an expansion in automobile lending at the extensive margin. A one standard deviation increase in the number of LICUs is associated with a 0.7 percent increase in the number of originated cars inside the zip code over the next twelve months. The remaining columns disaggregate originated loans by CUs, banks and non-banks. In keeping with the previous balance sheet evidence, an increase in the number
of LICUs is clearly associated with an increase in car loan origination by CUs; in this case, a one standard deviation increase in the number of LICUs suggests a 0.5 percent increase in the number of newly originated car loans by CUs.
We also saw previously that when faced with increased LICU competition, banks accommodated entry by contracting lending in the consumer segment, shifting instead towards commercial and industrial loans. Consistent with this pattern in the balance sheet data, column 3 shows that among banks the impact of increased competition on car origination is insignicant. Instead, non-banks, with little alternative lending markets, appear to respond to increased LICU competition by aggressively ghting for market share. From column 4, a one standard deviation increase in LICUs is associated with a 1.2 percent increase in newly originated car loans over the next 12 months. A concern here is that aggregate shocks, such as regulatory changes, funding shocks or low interest rates and a search for yield might explain the penetration in non-bank automotive credit across zipcodes. In results available request, we allow for zipcode specic time trends; the results remain unchanged.
Panels B-E of Table 8 use the information on borrower Equifax Risk Scores to understand how increased competition might have aected credit policy at the extensive margin. The CCP data contains information on a borrower's Equifax Risk Score, where a lower score indicates higher default risk. To this end, Panel A restricts the sample to borrowers in the bottom Equifax Risk Score quartile, while Panel B uses those in the 25th to 50th Equifax Risk Score percentile; Panel C uses the 50th to 75th percentile; and Panel D restricts the sample to the top quartile or safest borrowers. There is unequivocal evidence that increased competition from LICUs engendered a sizable shift in credit policy: Both CUs and non-banks expanded credit at the extensive margin towards riskier borrowers. In fact, the eects of competition on lending is mostly concentrated among the bottom Equifax Risk Score quartile.
borrowers|the eect of competition drops by half. Indeed, among the safest borrowers (Panel D), competition has no signicant eect on new lending.
Table 9 illustrates more clearly how competition induces credit-risk reallocation. For each type of lender, we compute the ratio of newly made auto loans extended to borrowers with below median Equifax Risk Scores to the total number of newly made auto loans by the same type of lender in each zipcode-6 month cell. Column 1 uses loans made by all kinds of lenders, while the remaining columns disaggregate by CUs, banks and non-banks. The results show that an increase in competition{the number of LICUs in the zipcode{is associated with a signicant increase in the fraction of loans made to lower credit quality borrowers at the extensive margin over twelve months. As before, much of this decline in credit quality emanates from CUs and non-banks. Among CUs, a one standard deviation increase in the number of LICUs is associated with a 0.4 percentage point increase in the ratio of below median loans; in the case of non-banks, a similar increase in competition is associated with a 0.2 percentage point increase in this ratio.
Table 10 show that this reallocation in automotive credit to riskier borrowers on account of increased competition is also associated with a signicant increase in non-performing loans. We use 2017 Q2 as the end point and compute the log of the total number of non-performing auto-loans from the CCP data within the zip code. Note that a non-performing auto loan is dened as one with more than 30 days overdue. Other county-level controls, such as demographics and economic indicators are included in the regressions. From column 1, a one standard deviation increase in the change in number of LICUs over this period is associated with a 11 percent rise in the number of delinquent car loans, regardless of origination source. Not surprisingly, columns 2 and 3 show that the eects are largest among loans made CUs and non-banks. The impact on banks is signicant but economically smaller|about half that of non-banks. Table 10 (columns 5 { 8) also measures non-performing loans in terms of the share of total loans{the results are similar.
percent increase in the number of LICUs over the same period is associated with only a 4-5 percent higher number of delinquent car loans by all institutions in 2017 for the two middle quartiles of the Equifax Risk Scores. The coecient estimates are not statistically signicant for the safest borrowers, and as before, the impacts are largest among the non-bank lenders.
V. Conclusion
This paper has studied the eects of nancial sector competition using regulatory changes that allowed some credit unions to directly compete with banks. The evidence shows that in response to increased competition, nearby banks became more ecient, protable and more leveraged. The cost of borrowing, mainly riskier automotive credit, fell, while deposit rates rose sharply when com-petition increased. We provide evidence that these results stem from increased selection pressures, as competition increased the failure rate of less ecient, smaller and less well-capitalized banks.
References
Aghion, Philippe, and Patrick Bolton, 1997, A Theory of Trickle-Down Growth and Development, Review of Economic Studies 64, 151{172.
Aghion, Philippe, and Peter Howitt, 1992, A Model of Growth through Creative Destruction, Econometrica 60, 323{51.
Allen, Franklin, and Douglas Gale, 2004, Competition and Financial Stability, Journal of Money, Credit and Banking 36, 453{480.
Banerjee, Abhijit V., and Andrew F. Newman, 1991, Risk-Bearing and the Theory of Income Distribution, Review of Economic Studies 58, 211{235.
Barth, James R., Chen Lin, Yue Ma, Jesus Seade, and Frank M. Song, 2013, Do bank regulation, supervision and monitoring enhance or impede bank eciency?, Journal of Banking & Finance 37, 2879{2892.
Beck, Thorsten, 2008, Bank competition and nancial stability : friends or foes ?, Policy Research Working Paper Series 4656, The World Bank.
Benmelech, Efraim, Ralf R. Meisenzahl, and Rodney Ramcharan, 2017, The Real Eects of Liquid-ity During the Financial Crisis: Evidence from Automobiles, The Quarterly Journal of Economics 132, 317{365.
Berger, Allen, Leora Klapper, and Rima Turk-Ariss, 2009, Bank competition and nancial stability, Journal of Financial Services Research 35, 99{118.
Bernanke, Ben, 2009, Lessons of the Financial Crisis for Banking Supervision: a Speech at the Federal Reserve Bank of Chicago Conference on Bank Structure and Competition, Chicago, Illinois, May 7, 2009, Speech 457, Board of Governors of the Federal Reserve System (U.S.).
Besanko, David, and Anjan V. Thakor, 2004, Relationship Banking, Deposit Insurance and Bank Portfolio Choice, Finance 0411046, University Library of Munich, Germany.
Boyd, John H., and Gianni De Nicol~a, 2005, The Theory of Bank Risk Taking and Competition Revisited, Journal of Finance 60, 1329{1343.
Braggion, Fabio, Narly Dwarkasing, and Lyndon Moore, 2017, Nothing special about banks: Com-petition and bank lending in britain, 18851925, The Review of Financial Studies 30, 3502{3537.
Brunnermeier, Markus K., and Yuliy Sannikov, 2014, A Macroeconomic Model with a Financial Sector, American Economic Review 104, 379{421.
Carlson, Mark, Sergio Correia, and Stephan Luck, 2018, The Eects of Banking Competition on Growth and Financial Stability: Evidence from the National Banking Era, Technical report, SSRN Working Paper.
Carlson, Mark, and Kris James Mitchener, 2006, Branch Banking, Bank Competition, and Financial Stability, Journal of Money, Credit and Banking 38, 1293{1328.
Claessens, Stijn, 2009, Competition in the Financial Sector : Overview of Competition Policies, IMF Working Papers 09/45, International Monetary Fund.
Dell'Ariccia, Giovanni, and Robert Marquez, 2006, Lending Booms and Lending Standards, Journal of Finance 61, 2511{2546.
Demirguc-Kunt, Asli, Luc Laeven, and Ross Levine, 2004, Regulations, Market Structure, Insti-tutions, and the Cost of Financial Intermediation, Journal of Money, Credit and Banking 36, 593{622.
Disalvo, James, and Ryan Johnston, 2017, Credit Unions' Expanding Footprint, Banking trend, Federal Reserve Bank of Philadelphia.
Favara, Giovanni, and Jean Imbs, 2015, Credit Supply and the Price of Housing, American Eco-nomic Review 105, 958{992.
Galor, Oded, and Joseph Zeira, 1993, Income Distribution and Macroeconomics, Review of Eco-nomic Studies 60, 35{52.
Gennaioli, Nicola, Andrei Shleifer, and Robert Vishny, 2015, Money Doctors, Journal of Finance 70, 91{114.
Gertler, Mark, and Nobuhiro Kiyotaki, 2010, Financial Intermediation and Credit Policy in Business Cycle Analysis, in Benjamin M. Friedman, and Michael Woodford, eds., Handbook of Monetary Economics, volume 3 of Handbook of Monetary Economics, chapter 11, 547{599 (Elsevier).
Goldstein, Itay, and Ady Pauzner, 2005, Demand-Deposit Contracts and the Probability of Bank Runs, Journal of Finance 60, 1293{1327.
He, Zhiguo, and Arvind Krishnamurthy, 2015, A Macroeconomic Framework for Quantifying Sys-temic Risk, Research Papers 3277, Stanford University, Graduate School of Business.
Jayaratne, Jith, and Philip E Strahan, 1998, Entry Restrictions, Industry Evolution, and Dynamic Eciency: Evidence from Commercial Banking, Journal of Law and Economics 41, 239{73.
Keeley, Michael C, 1990, Deposit Insurance, Risk, and Market Power in Banking, American Eco-nomic Review 80, 1183{1200.
Martinez-Miera, David, and Rafael Repullo, 2010, Does Competition Reduce the Risk of Bank Failure?, Review of Financial Studies 23, 3638{3664.
Melitz, Marc J., 2003, The Impact of Trade on Intra-Industry Reallocations and Aggregate Industry Productivity, Econometrica 71, 1695{1725.
Mian, Atif, and Amir Su, 2009, The Consequences of Mortgage Credit Expansion: Evidence from the U.S. Mortgage Default Crisis, The Quarterly Journal of Economics 124, 1449{1496.
Murdock, Kevin C., Thomas F. Hellmann, and Joseph E. Stiglitz, 2000, Liberalization, Moral Hazard in Banking, and Prudential Regulation: Are Capital Requirements Enough?, American Economic Review 90, 147{165.
Rajan, Raghuram, and Rodney Ramcharan, 2015, The Anatomy of a Credit Crisis: The Boom and Bust in Farm Land Prices in the United States in the 1920s, American Economic Review 105, 1439{1477.
Rajan, Raghuram G., 1994, Why Bank Credit Policies Fluctuate: A Theory and Some Evidence, The Quarterly Journal of Economics 109, 399{441.
Shull, Bernard, and Gerald A. Hanweck, 2001, Bank Mergers in a Deregulated Environment: Promise and Peril (Pareger).
Vickers, John, 2010, Central banks and competition authorities: institutional comparisons and new concerns, BIS Working Papers 331, Bank for International Settlements.
Figures and Tables
Figure 1: Regulation Changes
1993 LI rule based on
household income standard 2006 Task Force recommends changes
2008 Q2 LI rule based on new family income standard
2010 Q2 revision with link to the timing of the supervisory exam
2012 Q2 announcement letter
2016 Q4 end of sample period
Note: This gure shows the timeline of the regulatory changes surrounding the low income credit union rule.
Figure 2: Low-Income Designated Credit Unions, by Number VII. Figures and Tables
VII.A Figures
Figure 1. Low-Income Designated Credit Unions, by Number
This figure plots the number of credit unions designated as low-income credit unions between 2006 and 2016 as well as the ratio of income credit unions over the total number of credit unions. The letter notifying credit unions of their low-income eligibility was sent in the second quarter of 2012. Using geocoding software to determine eligibility, credit unions were thereafter enrolled into the program at the time of the bank exam.
Note: This gure plots the number of credit unions designated as low-income credit unions between 2006 and 2016 as well as the ratio of low-income credit unions to the total number of credit unions. The letter notifying credit unions of their low-income eligibility was sent in the second quarter of 2012. Using geocoding software to determine eligibility, credit unions were thereafter enrolled into the program at the time of the bank exam.
Figure 3: Low Income Designated Credit Unions, by Assets
32 Figure 2. Low Income Designated Credit Unions, by Assets
This figure plots total assets of credit unions designated as low-income credit unions between 2006 and 2016 as well as the ratio of income credit unions over the total number of credit unions. The letter notifying credit unions of their low-income eligibility was sent in the second quarter of 2012. Using geocoding software to determine eligibility, credit unions were thereafter enrolled into the program at the time of the bank exam.
Figure 4: Impact of Low Income Designations on Credit Unions Loan Growth
-.1
0
.1
.2
.3
.4
.5
quarterly loan growth (%)
4 quarters before3 quarters before2 quarters before1 quarter before quarter of designation
1 quarter after2 quarters after3 quarters after4 quarters after more than one year after 95% confidence limit point estimate
Figure 5: The Impact of LICU Competition on Bank Lending Growth, Over Time
2009
2010
2011
2012
2013
2014
2015
-.008 -.006 -.004 -.002 0
Table 1: Summary Statistics
Total Assets
(thousands) Loans/Assets Deposits/Assets Total Equity/Assets
Mean 144,036 0.54 0.86 0.13
Median 23,828 0.55 0.88 0.11
25th percentile 6,403 0.41 0.84 0.09
75th percentile 89,932 0.69 0.9 0.14
Standard deviation 431,055 0.19 0.06 0.06
Observations 2,352 2352 2352 2349
Total Assets
(thousands) Loans/Assets Deposits/Assets Total Equity/Assets
Mean 234,259 0.52 0.86 0.13
Median 29,434 0.53 0.87 0.12
25th percentile 8,405 0.38 0.83 0.09
75th percentile 112,354 0.67 0.9 0.15
Standard deviation 1,511,000 0.19 0.07 0.07
Observations 3,717 3717 3717 3711
Total Assets
(thousands) Loans/Assets Deposits/Assets Total Equity/Assets
Mean 369,613 0.62 0.84 0.11
Median 176,085 0.65 0.85 0.1
25th percentile 88,529 0.52 0.81 0.09
75th percentile 370,062 0.75 0.88 0.12
Standard deviation 807,640 0.16 0.06 0.04
Observations 5,735 5722 5735 5722
Total Assets
(thousands) Loans/Assets Deposits/Assets Total Equity/Assets
Mean 7,788,366 0.62 0.8 0.1
Median 2,718,986 0.68 0.82 0.1
25th percentile 1,051,542 0.56 0.76 0.09
75th percentile 7,672,005 0.75 0.85 0.11
Standard deviation 16,016,691 0.21 0.1 0.02
Observations 330 330 330 330
Panel A. Low-Income Designated Credit Unions
Panel B. Non Low-Income Credit Unions
Panel C. Community Banks
Panel D. Non-Community Banks