Modeling and optimization of drying process of paddy in infrared
and warm air fluidized bed dryer
Roghayeh Pourbagher
1, Abbas Rohani
1*, Mohammad Hashem Rahmati
2,
Mohammad Hossein Abbaspour-Fard
1(1. Department of Biosystems Engineering, Faculty of Agriculture, Ferdowsi University of Mashhad, Mashhad, Iran,9177948974;
2. Department of Biosystems Engineering, College of Agriculture, University of Agricultural Sciences and Natural Resources,
Gorgan, Iran, 4918943464)
Abstract: This paper investigated the effect of the components of fluidized bed dryer with two thermal sources of heater and
infrared such as air temperature at three levels (40°C, 50°C and 60°C) equivalent to radiation intensity of 0.031, 0.042 and 0.053 W cm-3 in infrared dryer, final moisture content of dried Tarom and Shirudi varieties at three levels (8%-9%, 9%-10% and 10%-11% (d.b.)) and air velocity of 4.5 m s-1 on the milling characteristic and drying time. To this end, stepwise regression was used for selecting the best models for each dependent variable in terms of the independent variables and genetic algorithm was used for optimizing the parameters of dryer with simultaneous consideration of cracked and fractured grains, milling recovery, degree of milling and drying time. The results indicated that quadratic model was best fitted with the experimental data. The results of design of experiments exhibited the infrared fluidized bed dryer was the better option as compared to the warm air fluidized bed dryer. The optimized condition by genetic algorithm was included air temperature for Tarom and Shirudi varieties 55.25°C and 58°C, respectively. Also, Tarom and Shirudi should be dried to moisture content of as low as 10.5% and 9.8%, respectively in order to have the optimized condition.
Keywords: modeling, optimization, infrared, milling characteristic, paddy
Citation: Pourbagher, R., A. Rohani, M. H. Rahmati, and M. H. Abbaspour-Fard. 2018. Modeling and optimization of drying process
of paddy in infrared and warm air fluidized bed dryer. Agricultural Engineering International: CIGR Journal, 20(3): 162–171.
1 Introduction
Rice (Oryza sativa L.), as the second main cereal crop, feeds more than half of the world people (Jittanit et al., 2010). Due to the importance of this plant, its drying process and milling recovery should be properly done. In general, drying consists of the reduction of the moisture content of the crop, the reduction of the enzyme activity and then the extension of the storage time. Therefore, drying reduces the weight and volume of the crop and facilitates its storage and transportation (Öztekin and Martinov, 2007). Traditional methods such as natural drying in the shade or sun and drying with warm air are
Received date: 2017-09-28 Accepted date: 2018-10-02 * Corresponding author: Abbas Rohani, Department of Biosystems Engineering, Faculty of Agriculture, Ferdowsi University of Mashhad, Mashhad, Iran. Email: [email protected].
indicated that infrared radiation was an environmentally- friendly method with a high rate of drying and high conversion quality, sterilizer of freshly harvested paddy, and improvement of storage quality (Chakraborty et al., 2016; Manikantan et al., 2014). Dondee et al. (2011) demonstrated the combined IR and fluidized-bed drying could reduce cracked and fractured soybean grains. Another study was carried out on drying of paddy with 25% moisture content on dry basis with a fixed bed dryer through the irradiance of warm air-infrared radiation. This study used the temperatures of 30°C, 40°C and 50°C, radiation intensities of 0, 0.2, 0.4 and 0.6 W cm-2, and air velocities of 0.1, 0.15 and 0.2 m s-1 to obtain bending resistant of brown rice, the percentage of cracked grains, and drying time. Results indicated that maximum bending resistant and minimum cracked percent was observed in paddy seeds dried with combined method of warm air and IR (Zare et al., 2012).
Longan drying was studied with three methods including heat pump, hot air, and combined far-infrared radiation with hot air and heat pump dryers. The results displayed that the combination of IR with hot air and heat pump increased the drying rate and thus reduced the drying time (Nathakaranakule et al., 2010). The investigation showed that the highest moisture diffusivity of dried paddy in the IR dryer was obtained in the shortest possible time. Also, the paddy moisture diffusivity had a positive relationship with paddy temperature. Of course, it is necessary to temper after IR drying in order to achieve a high rice moisture diffusivity coefficient and improve moisture removal during cooling (Khir et al., 2011). High moisture diffusivity of rice required a shorter time with infrared heating. The rice temperature and drying bed thickness significantly influence rice moisture diffusivity. Also, moisture diffusion coefficient is directly related to the rice temperature (Khir et al., 2011). Other reports pertaining to the use of infrared dryer for other agricultural crops included on lemon (Karimi et al., 2013), on apple (Nowak and Lewicki, 2004), and on onion (Jain and Pathare, 2004).
The reduction of energy consumption, drying time and waste during milling process of paddy to white rice
requires determining and controlling optimal conditions in the fluidized bed dryer. Genetic algorithm (GA) is a valuable tool to solve complex problems and food processing systems. GA is an efficient and systematic method that has been used in the fuzzy model for optimization (Madaeni and Kurdian, 2011). Some researches are done on the optimization of the drying process and some other on product quality.
Yang et al. (2013) optimized the temperature of rotary microwave dryer for keeping the moisture below one percent by using a genetic algorithm as the cost function of genetic algorithm optimization can be adapted with the output variations. The solar dryer of paddy by using of GA was optimized by Rahman et al. (2015). The variable parameters of their reviews were the temperature dryer and air velocity. Also, GA was used for the optimum design of solar dryer and the improvement of dryer conditions (Kumar et al., 2010). Erenturk and Erenturk (2007) evaluated the drying kinetics of carrot by using two methods of neural networks and GA. They used GA for optimizing the mathematical models obtained from regression analysis and the neural networks for estimating the moisture content.
necessary to be done.
2 Materials and methods
2.1 Drying experiment
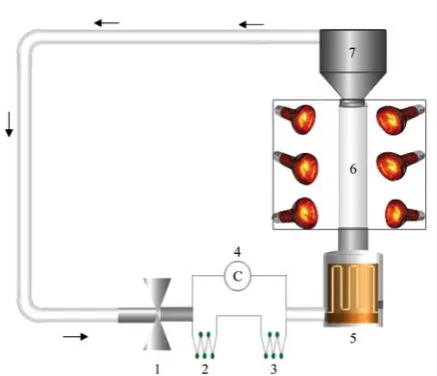
A scale experimental fluidized bed dryer was constructed in the Department of Biosystem Engineering, Gorgan University of Agricultural Sciences and Natural Resources, Gorgan, Iran (Figure 1). This device is composed of two components: a drying chamber and an energy source. The chamber wall is formed of a plexiglass cylinder with 200 mm in diameter and 600 mm in height. In order to adjust the air pressure and to assist the fluidization process, a subsidiary chamber with a triple diameter of the cylinder is set up above it. In the drying chamber, a paddy sample was placed on a wire mesh drying tray (20 cm × 19 cm), and the required air volume was supplied by a centrifugal blower type of radial flow. The air temperature was measured by three temperature sensors (ELREHA, GMBH, Germany) that were installed at inlet, middle, and bottom of the dryer chamber to regulate the conditions in the case of any sudden changes. An air dehumidifier (SAMWON, SU-503B, Japan) was used to steadily humidify the system. The energy was supplied once with the radiation of infrared lamps and once again with an electric heater of 1650 W. In the IR method, infrared lamps with the radiation intensities of 0.031, 0.042, 0.053 W cm-3 were installed around fluidization chamber to obtain the corresponding air temperature of 40°C, 50°C, 60°C. Also, the air velocity was set at 4.5 m s-1.
1. Fan 2. Condenser 3. Evaporator 4. Compressor 5. Heater 6. Fluidized chamber 7. Auxiliary tank
Figure 1 Fluidized bed dryer
2.2 Sample preparation
Fresh paddy varieties Tarom and Shirudi were harvested in the northeast region of Iran. After harvesting, the samples were thoroughly cleansed of foreign materials and immature. The moisture content of the rough rice at harvest was 15% and 14% (d.b.) for Shirudi and Tarom varieties, respectively. The initial moisture content was determined based on the American Society of Agricultural Engineers (ASAE Standards, 1995) in that 30 g samples were put in a convection oven at 130°C for 24 h. Fresh paddy was kept in cold storage at temperatures of 4oC-7oC for 7 days (Laohavanich and Wongpichet, 2008). Before the beginning of the experiments, the samples were located at perimeter temperature to reach equilibrium conditions. At each test stage, 250 g paddy was fed into the dryer. During the drying process, the samples were weighed with a digital scale (Satorius, Germany) with an accuracy of ±0.1%. Samples fluidization at three air temperatures of 40°C, 50°C and 60°C continued until reaching the moisture content of 8%-9%, 9%-10% and 10%-11% (d.b.). The moisture content was considered as an independent parameter till multi-objective optimization determined the optimized moisture content level of dried grains to have the lowest losses in milling operations.
degree of milling were determined by Equations (1), (2) and (3):
100
T d
W MR
W
= × (1)
100
f T
W FR
W
= × (2)
( )
100
b T
M
p
W W
DOM
W
−
= × (3)
where, MR is the milling recovery (%); WT is the weight
of total milled rice (g) and Wd is the weight of dried
paddy (g) following (Pan et al., 2008); FR is the fractured rice percent (%); WT is the weight of the total milled rice
(g) and Wf is the weight of the fractured white rice (g)
DOMM is the degree of milling (%); Wb is the weight of
brown rice (g) and Wp is the weight of grains before milling (g) (Nasirahmadi et al., 2014).
2.3 Analytical methods and mathematical modeling
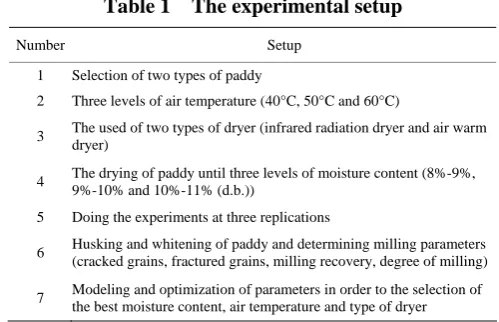
The data were analyzed in a factorial layout based on a randomized completely block design with three replications in which three levels of final paddy grain moisture content, three levels of air temperature, two varieties of paddy and two types of dryers were the independent variables and the rice milling characteristics and drying time were the dependent parameters. The experimental setup was demonstrated in Table 1. The total analysis was done by MATLAB (version 17.3.1) and Minitab (version 17.3) statistical software.
Table 1 The experimentalsetup
Number Setup 1 Selection of two types of paddy
2 Three levels of air temperature (40°C, 50°C and 60°C)
3 The used of two types of dryer (infrared radiation dryer and air warm dryer)
4 The drying of paddy until three levels of moisture content (8%-9%, 9%-10% and 10%-11% (d.b.))
5 Doing the experiments at three replications
6 Husking and whitening of paddy and determining milling parameters (cracked grains, fractured grains, milling recovery, degree of milling) 7 Modeling and optimization of parameters in order to the selection of
the best moisture content, air temperature and type of dryer
Stepwise regression was used in order to model the measured parameters (cracked and fractured grains, drying time, milling recovery, and degree of milling) and affection of inlet air temperature and paddy ultimate moisture content. Several statistical measurements such as determination coefficient, adjusted determination
coefficient and the effective factor were used to predict different models’ accuracy. The statistical values were calculated with Equations (4)-(7).
100
xi T
SS pc
SS
= × (4)
2 R
T
SS R
SS
= (5)
2 1
1 ( )( E)
adj
T
SS n
R
n p SS
− = −
− (6)
2 1
2 1
ˆ
( )
1
( )
n
j j
j n
j j
y y
EF
y y
=
= − = −
−
∑
∑
(7)where, PC is the percentage of contribution; R2 is the coefficient of determination; SSR is the sum of squares
regression, and SSE is the sum of squared residuals; R
2
adj is
coefficient of adjusted determination for an equation with
p statement (Sarvestani et al., 2016); EF is the effective factor; y is the actual value, and ˆy is the predicted value.
2.4 Multi-objective optimization
In this stepwise genetic algorithm, the optimum temperatures (T) and final moisture content (M) were estimated with a close, simultaneous consideration of five goals of optimization including the minimization of drying time, cracked and fractured grains and maximization of milling recovery and degree of milling (Equation (8)). The optimization limit and the variation range of the two variables T and M were considered.
d
( , ) ( , )
( , ) ( , ) ( , )
t f m
c
Minimize f T M Minimize f T M
Maximum f T M Maximum f T M
Minimize f T M
⎧ ⎪ ⎪⎪ ⎨ ⎪ ⎪ ⎪⎩
(8)
generation continues until no new solution is generated.
3 Result and discussion
3.1 Selection of dryer type
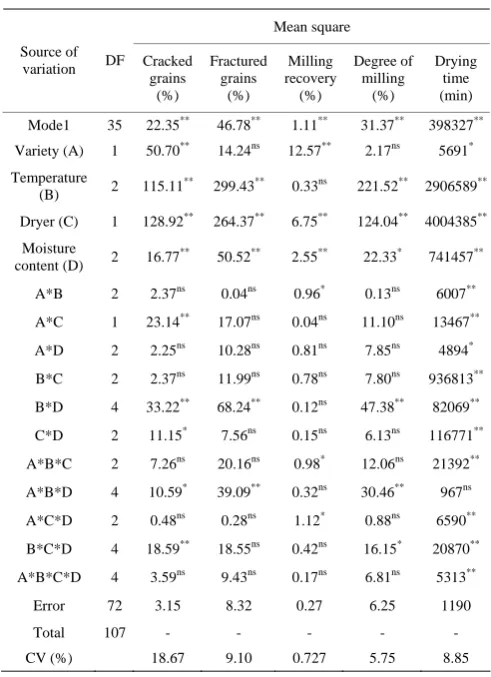
The results of variance analysis for the effect of the studied variables on the milling characteristics and drying time were indicated in Table 2, according to which the variety was significant on the cracked grains, milling recovery, and drying time (p-value <0.05). Also, the cracked grains, fractured grains, degree of milling and drying time were influenced by temperature at the one percent level. Madamba and Yabes (2005) revealed that the temperature significantly affected the drying time, cracked percent and head rice percent but it was not effective on the milling recovery. The effect of dryer type and moisture content on all measured parameters was significant (p-value <0.01). A similar result was reported by Sarker et al. (2013). They showed the significant effect of dryer type on the head rice percent and degree of whitening. Also, Nasirahmadi et al. (2014) indicated the significant effect of paddy moisture on the milling recovery, head rice percent and degree of milling. Their assessment of interaction effects of independent parameters showed different results. As the results showed, the drying time was almost affected by interaction and direct effects of all studied parameters. The degree of milling factor was affected by interaction effects of B×D, A×B×D and B×C×D factors, and A×B, A×B×C and A×C×D factors influenced the milling recovery. The interaction of B×D and A×B×D were significant for the fractured grains and A×C, B×D, C×D, A×B×D and B×C×D were significant for the cracked grains. The coefficient of variation (CV) indicates the relative dispersion of experimental points and it is at an acceptable level for all parameters. Since the cracked grains were influenced by many parameters, therefore the value of CV of cracked grains varied in a large range and other parameters with the best potential to predict instead of the cracked grains should be used to compare two dryer types (Sharma and Prasad, 2006). In general, it can be concluded that the interaction of variety (A) and air temperature (B) was significant for all response variations. Therefore, each dryer should be adjusted in proportion to variety in order to optimize its condition.
Table 2 Analysis of variance indicating the effects of
independent variables on the milling properties and drying
time
Mean square Source of
variation DF Cracked grains
(%)
Fractured grains
(%)
Milling recovery (%)
Degree of milling
(%)
Drying time (min) Mode1 35 22.35** 46.78** 1.11** 31.37** 398327** Variety (A) 1 50.70** 14.24ns 12.57** 2.17ns 5691* Temperature
(B) 2 115.11
**
299.43** 0.33ns 221.52** 2906589** Dryer (C) 1 128.92** 264.37** 6.75** 124.04** 4004385**
Moisture
content(D) 2 16.77
**
50.52** 2.55** 22.33* 741457** A*B 2 2.37ns 0.04ns 0.96* 0.13ns 6007** A*C 1 23.14** 17.07ns 0.04ns 11.10ns 13467** A*D 2 2.25ns 10.28ns 0.81ns 7.85ns 4894* B*C 2 2.37ns 11.99ns 0.78ns 7.80ns 936813**
B*D 4 33.22** 68.24** 0.12ns 47.38** 82069** C*D 2 11.15* 7.56ns 0.15ns 6.13ns 116771** A*B*C 2 7.26ns 20.16ns 0.98* 12.06ns 21392**
A*B*D 4 10.59* 39.09** 0.32ns 30.46** 967ns A*C*D 2 0.48ns 0.28ns 1.12* 0.88ns 6590** B*C*D 4 18.59** 18.55ns 0.42ns 16.15* 20870**
A*B*C*D 4 3.59ns 9.43ns 0.17ns 6.81ns 5313**
Error 72 3.15 8.32 0.27 6.25 1190 Total 107 - - - - - CV (%) 18.67 9.10 0.727 5.75 8.85 Note: ns: not significant, ** and * significant at 1% and 5% respectively.
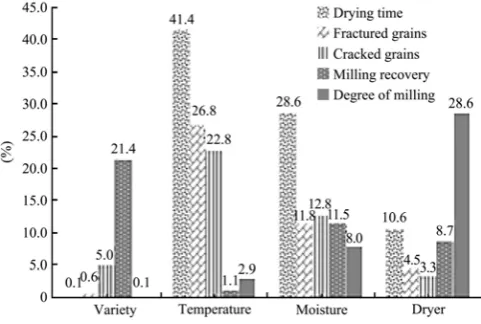
Figure 2 Contribution of independent parameters to the milling properties and drying time
The means comparison for the studied dependent parameters caused by dryer type in two varieties of Shirudi and Tarom is shown by least significant difference (LSD) method at five percent level in Table 3 and 4. According to Table 3, the paddy dried in infrared fluidized bed dryer had the least cracked and fractured grains because the drying of the grains started from the surface of the seed in warm air fluidized bed dryer and as the surface of grain started to dry and its permeability decreased, the removal of the moisture from the grain was extended. The gradient of moisture content inside the grain caused tensile stress on the surface and compressive stress within the grain. Since tensile strength of rice was lower than the compressive strength, the surface of grain reached the critical tensile stress and cracked, and the wastes increased in later stages of processing and milling (Zhang et al., 2005). But the heat was generated within the rice grain in the infrared fluidized bed dryer and was concentrated in areas with more moisture. Increasing steam pressure caused moisture release from these parts to the external layer. Therefore, it alleviated the problems related to the drying surface layer of grain (Sharma et al., 2005).
The results also indicated that the drying time of the two studied varieties was significantly shorter in infrared dryer than in the warm air dryer (Table 3). Similar results were reported by Laohavanich and Wongpichet (2008). Meeso et al. (2004) reported that without a significant increase in fractured and cracked grains, the drying process of rice in the infrared dryer was done faster than in warm air fluidized bed dryer. The degree of milling and milling recovery of dried paddy in two types of dryer
did not exhibit significant differences (Table 3). The degree of milling is the ratio of the removed bran weight of brown rice to the weight of brown rice and depends on the settings of whitener machine. This means that the higher the brown rice in whitener device, the higher the whiteness of rice and vice versa (Pourbagher et al., 2016). Yadav and Jindal (2008) used whiteness degree and head white rice percent for determining milling quality. They indicated that the whiteness degree increased with increasing milling time. Therefore, the infrared fluidized bed dryer could be considered as a suitable option for drying two varieties.
Table 3 The means comparison of Tarom variety for the
studied dependent parameters
The types of dryer Infrared dryer Heating dryer
The dependent parameters
7.3b 10.4a
Cracked grains (%)
41.9a 44.6a
Degree of milling
71.6a 72.2a
Milling recovery
29.4b
33.3a
Fractured grains (%)
215.6b
578.3a
Drying time (min)
Note: Similar letters at each line indicating no significant difference.
Table 4 The means comparison of Shirudi variety for the
studied dependent parameters
The types of dryer Infrared dryer Heating dryer
The dependent parameters
9.6b 10.8a
Cracked grains (%)
42.8a 44.3a
Degree of milling
72.4a 72.8a
Milling recovery
30.9b
33.2a
Fractured grains (%)
178.7b
586.1a
Drying time (min)
Note: Similar letters at each line indicating no significant difference.
3.2 Modeling of dryer parameters
parameters (air temperature and final moisture content of paddy) at each model for Tarom and Shirudi were different from each other. Therefore, it could be
concluded that the models are highly dependent on the type of product and they should be calculated for each crop separately.
Table 5 Analysis of variance table (ANOVA)
Tarom variety
Cracked grains (y5)
Degree of milling (y4)
Milling recovery (y3)
Fractured grains (y2)
Time (y1)
MS DF MS DF MS DF MS DF MS DF Source 0.94 3 0.41 3 2.29×10⁻⁴ 4 91.28 4 2.17 3 Model 2.51** 1 0.86** 1 5.22×10⁻⁵ 1 - - 2.60** 1
Temperature (x1)
3**
4.2 10× −
1 0.07** 1 1.54×10-5* 1 30.21** 1 3.12** 1
Moisture (x2)
- - - - 2.92×10⁻⁴ 1 26.49* 1 0.79** 1
X12
- - - - 5.57×10-3* 1 - - - -
x22
0.296** 1 0.31** 1 - - 70.96** 1 - -
x1x2
0.029 23 0.04 23 6.88×10⁻⁵ 22 7.28 23 0.03 23 Error 0.133 26 0.08 26 9.35×10⁻⁵ 26 20.20 26 0.28 26 Total Shirudi variety 0.88 2 33.63 2 2.7×10⁻⁴ 3 46.74 2 6.41 3 Model 1.64*** 1 - 1 4.43×10⁻⁶** 1 83.72* 1 14.27* 1 x1 - - 61.2*** - 6.27×10⁻⁴ 1 - - 4.89** 1 x2 0.14* 1 - 1 - - 9.76* 1 - 1
X12
- - 6.06* - - - - - 0.05** -
x22
- - - - 1.99×10-4* 1 - - - -
x1x2
0.0394 24 1.55 24 2.27×10⁻⁵ 23 1.66 24 0.005 23 Error 0.104 26 4.02 26 5.21×10⁻⁵ 26 5.12 26 0.74 26 Total
Note: **significant at 1% level, * significant at 5% level, ns not significant difference.
Although we used the quadratic model to estimate the dependent variables of both varieties, the results of stepwise regression after removing the independent factors with very low significant effect indicated that some of the dependent variables followed the models of linear, quadratic and interaction effect. For example, the drying time of Tarom was a function of moisture content, temperature, and the quadratic temperature while the drying time of Shirudi was a function of moisture content, temperature and the quadratic moisture content. Therefore, the moisture content was a very influential factor in drying time of Shirudi in comparison with Tarom. The fractured grains percent of Tarom was a function of air temperature and moisture whereas it was a function of air temperature in Shirudi variety. Also, the milling recovery of Tarom variety was a function of quadratic air temperature and moisture content but it was a function of their interaction effects in Shirudi. The degree of milling of Shirudi unlike Tarom was the only function of moisture content. The cracked grains percent in Shirudi was the only trait that was a function of air temperature. Other studies have considered the drying
kinetics of paddy and few studies have focused on the subject of this article (Chakraborty et al., 2016; Manikantan et al., 2014; Nachaisin et al., 2016). The research on forecasting drying energy of paddy, radiation intensity, final moisture, cracked grains and value of removed moisture has suggested the neural network model (Zhang et al., 2002). Also, Cheng and Huang (2010) used the neural network to estimate the degree of milling of rice.
In order to increase the sufficiency of models, different conversions were applied. Table 6 presented the shape of model and coefficients values of their parameters with determination coefficients, adjusted determination coefficient, and model efficiency. The results indicated that some models did not need conversion and the best type of conversion was selected for other models. As can be observed, the values of R2
and R2adj were close to each other so the variables in the
model had the adequacy of estimates. Also, the determination coefficients of models except for the fractured grains (y3) of Tarom variety were acceptable.
Table 6 Equation of milling properties and drying time
Model R2 R2adj EF
2
1 1 2 1
ln( )y = −0.4x−0.42x +0.004x 0.89 0.87 0.87
2 2 10.86 2 0.241 2 0.021
y = x − x x + x 0.69 0.64 0.70
2 2
3 1 2 1 2
ln(y)= −0.0068x+0.18x +6.98x −0.0096x 0.38 0.26 0.38
4 0.171 0.742 0.021 2
y = x+ x − x x 0.59 0.54 0.61 Tarom
5 0.1861 0.8012 0.0151 2
y = x + x − x x 0.81 0.78 0.81
2
1 1 2 2
ln( )y = −0.089x −2.33x +0.095x 0.99 0.99 0.99
2 2 1.061 0.011
y = − x+ x 0.70 067 0.70
3 1 2 1 2
ln(y)=0.0038x +0.0144x −0.0004x x 0.61 0.56 0.61
2 4 0.822 0.012
y = − x + x 0.64 0.61 0.64 Shirudi
2 5 0.121 0.00151
y = − x+ x 0.65 0.62 0.65
We used statistical comparison, variance, and the statistical distribution between actual and predicted values to more closely review the validation of the
models. The null hypothesis holded similarity and equality of average, variance and statistical distribution of the experimental values and the predicted values by models. Thus, paired t-test, F-test, and Kolmogorov-Smirnov were used at the five percent significant level. The p-value of comparisons for all models and for two varieties was shown in Table 7. As the results showed, except y3 variance of Tarom, in the
other cases the differences between average, variance and statistical distribution of the actual values and the predicted values of models were not significant (p-value >0.05). Therefore, the predictions of models can be said to be reliable.
Table 7 The amounts of P-Value for means comparison, variance and statistical distribution of experimental and predicted values by the models
Y1 Y2 Y3 Y4 Y5 Variety
Tarom Shirudi Tarom Shirudi Tarom Shirudi Tarom Shirudi Tarom Shirudi Mean 0.90 0.99 0.99 0.99 0.98 0.99 0.97 0.99 0.96 0.94
Var 0.43ns 0.97ns 0.36ns 0.37ns 0.02* 0.22ns 0.19ns 0.26ns 0.57ns 0.29ns Dist 0.47 0.99 0.91 0.28 0.69 0.91 0.91 0.15 0.08 0.08
3.3 Optimization
In the previous section, we obtained the regression models of the fluidized bed dryer with the infrared thermal source for Tarom and Shirudi variety and then, we evaluated them. The results of their evaluation indicated that they can be confided to the forecasting models. Therefore, in this section, they were used as the cost functions or competencies in GA. The aim at this
stage was the optimization of air temperature and moisture content of paddy by using a multi-objective genetic algorithm. The purpose of multi-objective GA was the maximization of milling recovery and degree of milling and the minimization of cracked and fractured grains percent and drying time. The results of multi-objective GA for Tarom and Shirudi were summarized in Table 8.
Table 8 The optimum values of multi-objective genetic algorithms
Time (y1) Fractured grains (y2) Milling recovery (y3) Degree of milling (y4) Cracked grains (y5)
Variety
Tarom Shirudi Tarom Shirudi Tarom Shirudi Tarom Shirudi Tarom Shirudi Temperature (x1) 55.25 58.00 55.25 58.00 55.25 58.00 55.25 58.00 55.25 58.00
Moisture (x2) 10.50 9.80 10.50 9.80 10.50 9.80 10.50 9.80 10.50 9.80
y 87.57 50.37 27.88 32.39 71.22 72.14 41.35 44.24 7.84 10.97
According to Table 5, the drying condition to have an appropriate quality of the final product was different and each variety should have been dried up to a certain percentage of moisture content. The optimized moisture content of Tarom and Shirudi was 10.50% and 9.80%, respectively. Also optimized air temperature of Tarom and Shirudi was obtained as 55.25°C and 58.00°C, respectively. Rahman et al. (2015) used a genetic algorithm and found the optimized values of drying time of rice seed (120-180 minute) at the drying temperature
optimized moisture content (21.31%-21.86%) in the fix bed dryer of paddy for minimizing consumption energy and the maximum milling recovery were reported by Wang et al. (2012). Jha et al. (2012) studied the drying paddy in the vertical flow dryer by using response surface method and then the optimized values of the air temperature, percentage of decreased moisture, the drying time and head rice percent were reported to be 58.3°C, 7.13%, 53.1 min and 54.53%, respectively.
4 Conclusion
In drying paddy, it is important to know the air temperature and final moisture content to achieve better milling characteristic and frugality at the same time. The design of experiments, statistical regression, and genetic algorithms could be the important methods to study the effect of the dryer parameters on rice quality. In this study, the better dryer was selected by the design of experiments and after the modeling of parameters, the optimized drying condition determined by multi-objective genetic algorithms for achieving the paramount quality of product at the shortest drying time. The results of the design of experiments indicated that the effect of air temperature and final moisture content of dried paddy was significant on the dependent variables as the percentage of contribution of final moisture content to the drying time, fractured and cracked grains, milling recovery and degree of milling was 28.6%, 11.8%, 12.8%, 11.5% and 8%, respectively. According to the means comparison results, the paddy dried in infrared fluidized bed dryer had less cracked and fractured grains and drying time than air warm fluidized bed dryer. Therefore, the infrared fluidized bed dryer was selected as the appropriate dryer for access to high-quality of rice, while the dryer type had no significant effect on the milling recovery and degree of milling. The results of models showed that the quadratic model was best fitted with the experimental data. The optimized dryer conditions by genetic algorithms exhibited that the achievement to the maximum head white rice percent, the most milling recovery and degree of milling, and the shortest drying time require the temperature to be set at 55.25°C and 58°C for Tarom and Shirudi, respectively. Also, two varieties of Tarom and Shirudi dried to moisture content
of as low as 10.5% and 9.8%, respectively. It is suggested to do similar tests on other varieties of paddy. Also, comprehensive data are required for each crop to have the recommended models and optimal conditions.
References
ASAE Standards. 1995. S352.2: Moisture measurements: Unground grain seeds. Moisture relationships of grains. St. Joseph, Mich.: ASAE.
Chakraborty, S., M. Sarma, J. Bora, S. Faisal, and M. K. Hazarika. 2016. Generalization of drying kinetics during thin layer drying of paddy. Agricultural Engineering International:
CIGR Journal, 18(4): 177–189.
Chen, K. J., and M. Huang. 2010. Prediction of milled rice grades using Fourier transform near-infrared spectroscopy and artificial neural networks. Journal of Cereal Science, 52(2): 221–226.
Chua, K. J., and S. K. Chou. 2003. Low-cost drying methods for developing countries. Trends in Food Science & Technology, 14(12): 519–528.
Dondee, S., N. Meeso, S. Soponronnarit, and S. Siriamornpun. 2011. Reducing cracking and breakage of soybean grains under combined near-infrared radiation and fluidized-bed drying. Journal of Food Engineering, 104(1): 6–13.
Ebadi, M. T., M. Rahmati, M. Azizi, and M. Hassanzadeh Khayyat. 2010. Effects of different drying methods (natural method, oven and microwave) on drying time, essential oil content and composition of Savory (Satureja hortensis L.). Iranian
Journal of Medical and Aromatic Plants, 26(4): 477–489.
Erenturk, S., and K. Erenturk. 2007. Comparison of genetic algorithm and neural network approaches for the drying process of carrot. Journal of Food Engineering, 78(3): 905–912. Jain, D., and P. B. Pathare. 2004. Selection and evaluation of thin layer drying models for infrared radiative and convective drying of onion slices. Biosystems Engineering, 89(3): 289–296.
Jha, S. K., N. Patel, S. K. Jagan, R. K. Pal, C. Kaur, and J. P. Sinha. 2012. Optimization of drying process for PB1121 variety of paddy. Quality Assurance and Safety of Crops & Foods, 4(3): 142–142.
Jittanit, W., N. Saeteaw, and A. Charoenchaisri. 2010. Industrial paddy drying and energy saving options. Journal of stored
products research, 46(4): 209–213.
Karimi, S. R., R. Shahhoseini, and S. Zakeri. 2013. Assessment of drying process, quantity of essential oil and mathematical modeling of lemon verbena (lippia citriodora hb et k.) using hot air. Iranian Journal of Medicinal and Aromatic Plants,
4(58): 684–698.
1126–1132.
Khodadadi, M., M. H. Rahmati, M. R. Alizadeh, and A. R. Asl. 2013. Investigation on effective factors in drying time Iranian rice varieties in fluidized bed dryer. International Journal of
Agriculture and Crop Sciences, 5(24): 2934.
Kumar, R., S. Jain, and M. K. Garg. 2010. Drying behaviour of rapeseed under thin layer conditions. Journal of Food Science
and Technology, 47(3): 335–338.
Laohavanich, J., and S. Wongpichet. 2008. Thin layer drying model for gas-fired infrared drying of paddy. Songklanakarin
Journal of Science and Technology, 30(3): 343–348.
Madaeni, S. S., and A. R. Kurdian. 2011. Fuzzy modeling and hybrid genetic algorithm optimization of virus removal from water using microfiltration membrane. Chemical Engineering
Research and Design, 89(4): 456–470.
Madamba, P. S., and R. P. Yabes. 2005. Determination of the optimum intermittent drying conditions for rough rice (Oryza
sativa, L.). LWT-Food Science and Technology, 38(2):
157–165.
Manikantan, M. R., P. Barnwal, and R. K. Goyal. 2014. Drying characteristics of paddy in an integrated dryer. Journal of
Food Science and Technology, 51(4): 813–819.
Meeso, N., A. Nathakaranakule, T. Madhiyanon, and S. Soponronnarit. 2004. Influence of FIR irradiation on paddy moisture reduction and milling quality after fluidized bed drying. Journal of Food Engineering, 65(2): 293–301. Mujumdar, A. S. 2014. Handbook of Industrial Drying. 4th ed.
Boca Raton, FL: CRC press.
Nachaisin, M., J. Jamradloedluk, and C. Niamnuy. 2016. Application of combined far‐infrared radiation and air convection for drying of instant germinated brown rice.
Journal of Food Process Engineering, 39(3): 306–318.
Nasirahmadi, A., B. Emadi, M. H. Abbaspour-Fard, and H. Aghagolzade. 2014. Influence of moisture content, variety and parboiling on milling quality of rice grains. Rice Science, 21(2): 116–122.
Nathakaranakule, A., P. Jaiboon, and S. Soponronnarit. 2010. Far-infrared radiation assisted drying of longan fruit. Journal
of Food Engineering, 100(4): 662–668.
Nowak, D., and P. P. Lewicki. 2004. Infrared drying of apple slices.
Innovative Food Science & Emerging Technologies, 5(3):
353–360.
Öztekin, S., and M. Martinov. 2007. Medicinal and Aromatic
Crops: Harvesting, Drying, and Processing. Binghamton, NY:
Haworth Food & Agricultural Products Press.
Pan, Z., R. Khir, L. D. Godfrey, R. Lewis, J. F. Thompson, and A. Salim. 2008. Feasibility of simultaneous rough rice drying and disinfestations by infrared radiation heating and rice milling quality. Journal of Food Engineering, 84(3): 469–479. Pourbagher, R., M. H. Rahmati, and M. R. Alizadeh. 2016. Air
temperature and final grain moisture effects on drying time
and milling quality in two types of fluidized bed dryer.
Agricultural Engineering International: CIGR Journal, 18(2):
449–456.
Rahman, M. M., A. G. M. B. Mustayen, S. Mekhilef, and R. Saidur. 2015. The optimization of solar drying of grain by using a genetic algorithm. International Journal of Green Energy, 12(12): 1222–1231.
Sarker, M. S. H., M. N. Ibrahim, N. A. Aziz, and M. S. Punan. 2013. Drying kinetics, energy consumption, and quality of paddy (MAR-219) during drying by the industrial inclined bed dryer with or without the fluidized bed dryer. Drying
Technology, 31(3): 286–294.
Sarvestani, N. S., A. Rohani, A. Farzad, and M. H. Aghkhani. 2016. Modeling of specific fuel consumption and emission parameters of compression ignition engine using nanofluid combustion experimental data. Fuel Processing Technology, 154: 37–43.
Sellami, I. H., W. A. Wannes, I. Bettaieb, S. Berrima, T. Chahed, B. Marzouk, and F. Limam. 2011. Qualitative and quantitative changes in the essential oil of Laurus nobilis L. leaves as affected by different drying methods. Food Chemistry, 126(2): 691–697.
Sharma, G. P., and S. Prasad. 2006. Optimization of process parameters for microwave drying of garlic cloves. Journal of
Food Engineering, 75(4): 441–446.
Sharma, G. P., R. C. Verma, and P. B. Pathare. 2005. Thin-layer infrared radiation drying of onion slices. Journal of Food
Engineering, 67(3): 361–366.
Wang, D., C. Li, L. Tong, Q. Liu, and Y. Hu. 2012. Influences of drying parameters on efficiency rate of paddy rice in deep fixed-bed. Transactions of the Chinese Society of Agricultural
Engineering, 28(1): 285–290.
Yadav, B., and V. Jindal. 2008. Changes in head rice yield and whiteness during milling of rough rice (Oryza sativa L.).
Journal of Food Engineering, 86(1): 113–121.
Yang, B., G. Liang, J. Peng, S. Guo, W. Li, S. Zhang, Y. Li, and S. Bai. 2013. Self-adaptive PID controller of microwave drying rotary device tuning on-line by genetic algorithms. Journal of
Central South University, 20(10): 2685–2692.
Zare, D., H. Naderi, and A. A. Jafari. 2012. Experimental and theoretical investigation of rough rice drying in infrared-assisted hot air dryer using artificial neural network.
Agricultural and Biosystems Engineering, 6(9): 976–680.
Zhang, Q., S. X. Yang, G. S. Mittal, and S. Yi. 2002. Ae-automation and emerging technologies: prediction of performance indices and optimal parameters of rough rice drying using neural networks. Biosystems Engineering, 83(3): 281–290.