http://dx.doi.org/10.22161/ijeab/2.2.53 ISSN: 2456-1878
Combined Toxicity and Bioconcentration of
Fluoride and Arsenic in African Catfish Clarias
gariepinus (Burchell, 1822)
Gamini Sahu
1, Shamsh Pervez
2, Aditi Niyogi Poddar
1*1SOS in Life Sciences, Pt Ravishankar Shukla University Raipur, Chhattisgarh, India
2SOS in Chemistry, Pt Ravishankar Shukla University Raipur, Chhattisgarh, India
Address for correspondence: *Aditi (Niyogi) Poddar, School of studies in Life Sciences, Pt. Ravishankar Shukla University Raipur,Chhattisgarh, India. E-mail: adinpod@gmail.com
Abstract— Laboratory experiments were performed to examine the combined toxic effects of two important aquatic contaminants viz., arsenic and fluoride on African catfish, Clarias gariepinus. Additionally, the bio concentration factors (BCFs) of the two contaminants in tissues and blood of catfish were also determined. The LC50 for sodium fluoride and arsenic trioxide were determined to be 619.3 mg L-1, 30.3 mg L-1, respectively. Erratic swimming movements with hyperactivity, loss of equilibrium, augmented air gulping and decreased food consumption were observed in the experimental groups. In co-exposure groups of arsenic and fluoride, the concentration of fluoride in fish tissues increased with increasing water fluoride concentration in the test aquaria with significant differences (P<0.01) between different groups. Also significant differences (P<0.05) in tissue concentrations of arsenic between groups were observed in response to different concentrations of water arsenic. However, the differences in blood fluoride and arsenic concentrations were not significantly dissimilar (P>0.05) among the exposure groups. Arsenic was observed to exceedingly bioaccumulate and biomagnify in the tissues. Perhaps due to the complex formation of arsenic and fluoride the bio concentration of arsenic in tissues was observed to decrease with increasing water fluoride concentration and vice-versa. The study concludes that fluoride may interfere with the bio-concentration of arsenic.
Keywords—Arsenic, Bio-concentration factor, Combined toxicity, Fluoride, LC50.
I. INTRODUCTION
Fluoride and arsenic are two stern drinking water contaminants recognized worldwide [1] with natural sources contributing to the bulk of their environmental load.
Fluoride is found in freshwater at concentrations less than 1.0 mg L-1; however, its natural concentrations may exceed
even 50.0 mg L-1 [2]. While lower concentrations, viz., <1.0
mg L-1 according to Bureau of Indian standards and 1.5mg
L-1 according to World Health Organization are beneficial,
higher concentrations may lead to various health problems [1]. Fluoride causes fluorosis, a slow degenerative disease affecting teeth and bone tissues. It also induces neurological defects, infertility, mental retardation, depression of thyroid activity [3, 4, 5, 6, 7] and persistently bioaccumulates in aquatic animals continuously exposed to the contaminated medium [8, 9, 10].In India, 19 out of 35 states and union territories have ground water highly contaminated with fluoride [11].
A heavy metal, arsenic is more toxic than fluoride at the same dose and exposure duration [1]. Symptoms of toxicity during short term exposures in humans include vomiting, abdominal pain, encephalopathy, and watery bloody diarrhea. Long-term exposure may result in thickened pigmented skin, abdominal pain, diarrhea, heart disease, numbness, and cancer. Globally, arsenic toxicity is mostly prevalent in West Bengal (India), Nepal, and Bangladesh [12, 13] with contaminated drinking water being the most common source. A higher concentration of arsenic is lethal to many organisms in the aquatic environment [14, 15] inducing the synthesis of stress related proteins [16] and alterations in B and T cell functions [17] in the fish body. Like other heavy metals, it is non degradable and considered hazardous to aquatic ecosystem due to its
environmental persistence and tendency for
bioaccumulation [18, 19, 20]. Donohue and Abernathy [21] reported that total arsenic (μg g−1 dry weight), in marine
http://dx.doi.org/10.22161/ijeab/2.2.53 ISSN: 2456-1878
Koch et al., [22] demonstrated that total arsenic in freshwater fish ranged from 0.28 to 3.1 for whitefish
(Coregonus clupeaformis), 0.98 to 1.24 for sucker
(Catostomus commersoni), 0.46 to 0.85 for wall eye (Stizostedion vitreum), and 1.30 to 1.40 μg g−1 dry wt. for
pike (Esox lucius).
Geological structures and expanding human activities contribute to the high concentrations of both fluoride and arsenic. Although, their concurrent chronic poisoning is a sprouting disease prevalent in India and many other countries, however, few reports exist suggestive of their chronic co exposure [23]. Li et al., [24] studied effects of arsenic-fluoride co-exposure on rat teeth and observed no effects on dental tissues. Distinct damage on the nervous system of the offspring with decreased learning and memory ability was reported by Zhang et al.,[25]. Altered histology of cerebral hemisphere subsequent to combined arsenic-fluoride exposure was observed by Chinoy and Shah [26] with arsenic having more prominent effects as compared from fluoride. Marked genotoxic effects were apparent in case of combined exposure to arsenic and fluoride as compared to their individual exposures [27, 28].
Exposure of mice to higher doses of fluoride and arsenic revealed their antagonistic effects [29] while, low doses showed synergistic effects [30]. González-Horta et al. (2015) [31] studied urinary arsenic and fluoride in human residents of Chihuahua, Mexico exposed to concurrent arsenic and fluoride in drinking water. Positive correlations between As and F in drinking water and between urinary arsenic and fluoride were observed.
Fishes, the major source of protein in many countries [32] are often contaminated with high concentration of water borne pollutants and act as a major vector for contaminant transfer to humans. Their ability to detect sudden changes in the environment and to monitor short or long term changes in water quality, make them efficient biomarkers. Although, toxic effects of elevated levels of fluoride [33, 34, 35, 36] and arsenic [16, 17, 37, 38] individually on various aquatic species are well documented, however, no work has been done on their combined toxic effects. The present study includes the determination of the Median Lethal Concentrations, bio concentration and behavioral effects of fluoride and arsenic separately and in combination on the freshwater fish Clarias gariepinus (Burchell, 1822).
II. MATERIALS AND METHODS
2.1. Determination of Median lethal Concentration (LC50 ) of Fluoride and Arsenic
2.1.1. Experimental design
Seventy African catfish (Clarias gariepinus) of either sex weighing between 100 and 250 g were procured live from local hatcheries in Raipur. The animals were housed in an air conditioned animal house at 24 ± 2°C under 12 hours of light and dark cycles and acclimatized for a period of seven days using de-chlorinated tap water. Feeding was done with Tokyo fish food.
2.1.2. LC50 estimation of Arsenic and Fluoride
Post acclimation, the fishes were divided into seven groups of ten fish each and acute toxicity bioassay conducted by exposing the fish to diverse concentrations (100, 200, 300, 600, 800, 1000, 1200ppm) of sodium fluoride in glass aquaria. Similar experiments were conducted with 7 different concentrations (10, 20, 25, 40, 45, 60 ppm) of arsenic trioxide. The control group was kept in an aquarium having tap water without addition of sodium fluoride and arsenic trioxide. The bioassay was conducted in a static system. Mortality was recorded at every 24, 48, 72 and 96 hour of exposure. LC50 was calculated by Probit analysis using SPSS 16.0 [39].
2.2. Combined arsenic and fluoride toxicity assay
On the basis of 96 hr LC50 values and the 95% confidence limits of sodium fluoride and arsenic trioxide obtained from the preliminary tests, various concentrations viz., Group I (600ppm F+10ppmAs), Group II (350ppm F+20ppm As), Group III (600ppm F+20ppm As) and Group IV (350ppm F+40ppm As) of sodium fluoride and arsenic trioxide were selected for combined toxicity testing. Blood and tissue (liver, kidney and muscle) samples were collected at the end of 96 hours along with water samples for quantitative analysis of fluoride and arsenic. Behavioral changes during the 96 hours duration were also recorded. Physicochemical properties of the test water during exposure were measured according to standard methods. Water quality during experiment varied as follows: Ambient temperature 24-26°C, Water temperature 21-22°C, pH 7.5-8.5, Conductivity 350-460 µs cm-1, Ammonia nitrogen 0.005-0.01 mg L-1, TDS 200-250 mg L-1.
2.3. Arsenic analysis
http://dx.doi.org/10.22161/ijeab/2.2.53 ISSN: 2456-1878
24 hours. 0.5 g dried tissue samples were taken in 100 ml beaker. The sample was covered with watch glass and digested on a hot plate by the addition of HNO3: HCLO4 (3:1) [41].All the digested samples were filtered through Whatman filter paper No. 541 and diluted to 25 ml using distilled water. Sample analysis was done by Thermo Fisher Scientific Atomic Absorption Spectrophotometer (Model no.ICE 3000).
2.4. Fluoride analysis
Collection and storage of all samples was done as mentioned in arsenic analysis. Water fluoride was measured by direct determination method by adding TISAB buffer (1:1) .Tissue samples were digested with a mixture of 1:1 (HNO3: HCLO4) and neutralized with citrate buffer. Final sample solution was obtained by adding TISAB buffer (1:1). Fluoride content was measured by direct determination method [42] with required modifications. Blood fluoride was measured by Analyte addition method using the following equation (Thermo scientific Orion ion selective electrode manual):
CU = CS [(VU / VS+VU)* 10ΔE/S]
Where: CU = concentration of unknown sample, CS = concentration of standard sample, VU = volume of unknown sample, VS = volume of standard sample, ΔE = E2 – E1= is the change in the electrode potential after addition, E2= mV after addition of sample, E1=mV before addition of sample S = slope of the electrode
In all samples, quantification of Fˉ ion was done with the help of Thermo Fisher Scientific Orion 9609 BNWP ion selective fluoride electrode.
2.5. Bioconcentration factor (BCF): Bio-concentration factors of arsenic and fluoride in the fish samples were obtained using following equation:
BCF= Corg /Cwater
Where BCF- bio-concentration factor, Corg = concentration of chemical in aquatic organism, Cwater= concentration of chemical in ambient environment, water in this case.
III. RESULTS
No fishes were observed dead in the control aquarium at the end of the experiments. Highest fluoride concentration caused mortality with increasing exposure time. 100% mortality was observed at 1200 ppm, 60 ppm and 40+350 ppm for fluoride, arsenic and arsenic+ fluoride, respectively.
3.1. Determination of LC50 value of sodium fluoride for Clarias gariepinus
The observed percentages of mortality of Clarias gariepinus for sodium fluoride are shown in Tables 1, 2, 3
&4. The observed LC values and 95% confidence limits for LC25 (333.445-590.361), LC45 (454.322-743.495), LC75 (649.953-1141.940), LC96 (938.671-2279.511) are shown in Table 4. In this study, 96 hour LC50 of sodium fluoride on Clarias gariepinus was estimated to be 619.3 mg L-1. 3.2. Determination of LC50 value of arsenic trioxide for Clarias gariepinus
The observed percentages of mortality of Clarias gariepinus for arsenic trioxide are shown in Tables 5, 6, 7 & 8. The observed LC values and 95% confidence limits for LC25 (13.5-29.2), LC45 (20.8-35.9), LC75 (31.8-59.39.0), LC96 (44.3-148.4) are shown in Table 8. In the present study, the 96 hour LC50 value of arsenic trioxide on Clarias gariepinus was estimated to be 30.3 mg L-1.
3.3. Concentration of fluoride and arsenic in fish sample
The levels of arsenic and fluoride obtained in fish tissues and blood are depicted in Figures 3 and 4, respectively. Bio-concentration factors of arsenic and fluoride in blood and tissues are depicted in Fig. 5. Fluoride concentration in fish
tissues increased with increasing water fluoride
concentration in the test aquaria and significant differences exist (P<0.01) between different groups. Similar to fluoride, arsenic concentration increased in tissues with increasing water fluoride and arsenic concentration and accumulation in liver was higher than blood. Significant differences (P<0.05) in tissue concentrations of arsenic was observed in response to different concentrations of water arsenic levels. However, the differences in blood fluoride and arsenic concentrations were not significantly different (P>0.05) among the exposure groups. Bioaccumulation of arsenic in tissues was observed decreased by increasing water fluoride concentration. Similarly, bioaccumulation of fluoride in tissue was observed to decrease with increasing water arsenic concentration.
IV. DISCUSSION
Highly variable 96 hour Median Lethal Concentration (mg L-1) values have been reported for fluoride in diverse
http://dx.doi.org/10.22161/ijeab/2.2.53 ISSN: 2456-1878
as compared from Oreochromis mossambicus, Oncorhynchus mykiss, Puntius sophore and Salmo trutta.
On the basis of 96 hours LC50 values (30.33 mg L-1)
observed in this study for arsenic, Clarias gariepinus
appears to be equally tolerant than Oryzias latipes (30) [47] and Cyprinus carpio (32) [49], less tolerant than
Ctenopharyngodon idella (89) [50] and Channa punctatus (76) [16] and more tolerant than Carassius carrassius auratus (10), Anabas testudineus (18.21) [51], Danio rerio (8.91) [52] and Clarias batrachus (8.4) [17].Erratic swimming activity, increased opercular movement and mucous secretion, loss of equilibrium and body dispigmentation ,changes in feeding behavior, similar to reports by Bhavani and Karuppasamy [52], Narwaria and Saksena [48] were also observed.
Although numerous studies exist on evaluation of the individual effect of fluoride and arsenic on mammals and fishes, there are no studies related to understanding the potential combined effects of fluoride and arsenic on fish. Cao et al., [53] reported that the concentration of fluoride in the gills and other tissues in C. carpio increased with exposure time and exposure concentration and were in the order of gills > liver > brain > kidney > muscle > intestine. In this study, tissue fluoride content of Clarias gariepinus
increased significantly (P<0.01) with increasing water fluoride and arsenic concentration and exposure time. Similar results were obtained by Aguirre-Sierra et al., [54] after exposing white clawed crayfish (A. pallipes) to different concentration of fluoride. Our results also depict BCF values of blood arsenic (0.48 - 0.50), blood fluoride (0.024 - 0.384) and tissue fluoride (0.58 - 0.87), to be in the lower range ie. (<01). However, tissue arsenic was observed to be very high (0.63 - 3.11), indicating that arsenic exceedingly bioaccumulated and biomagnified in the tissues. Data show bioaccumulation of arsenic and fluoride to occur predominantly in liver, it being responsible for detoxification and elimination of toxic elements. Differences in blood fluoride and arsenic concentrations were not significantly different (P>0.05) among the exposure groups.
Bio concentration of arsenic in tissues was observed to decrease with increasing water fluoride concentration and vice-versa. We agree with [23] that the possible reason of this antagonistic behavior could be the presence of an empty
d orbital of fairly low energy in arsenic which
predominately binds with the halogen due to its electro negativity. In trivalent oxidation state it shows SP3
hybridization with the formation of AsF3, while in
pentavalent oxidation state it shows SP3d hybridization and
forms AsF5 which is a potent ion acceptor forming AsF6-
ions or more complex species. Hence, fluoride possibly suppresses the ionization of sodium arsenite thereby reducing its retention.
V. ACKNOWLEDGEMENTS
Sincere thanks are due University Grants Commission for providing UGC-BSR fellowship to Gamini Sahu as financial assistance and to the Head, SoS in Life Science for providing lab facilities.
VI. DECLARATION OF INTEREST
The authors declare that there are no conflicts of interest to disclose.
REFERENCES
[1] Flora, S.J.S., Mittal, M., Pachauri, V. and Dwivedi, N. (2012). A possible mechanism for combined arsenic and fluoride induced cellular and DNA damage in mice. Metallomics, 4:78-90.
[2] Mc Neeley, R.N., Neimanis, V.P. and Dwyer, L. (1979). Water quality source book: A guide to water quality parameters. Inland waters directorate. Water quality branch, Environment Canada.
[3] Aoba, T. and Fejerskov, O. (2002). Dental Fluorosis, chemistry and biology. Crit. Rev. Oral Biol. Med., 13:155-70.
[4] Tang, Q.Q., Du, J., Ma, H.H., Jiang, S. and Zhou, X.J. (2008). Fluoride and children’s intelligence: a meta- analysis. Biol. Trace. Elem. Res., 126:115-120.
[5] Bronckers, A.L.J.J., Lyaruru, D.M. and Denbesten, P.K. (2009). The impact of fluoride on ameloblasts and the mechanisms of enamel fluorosis. J. Dent. Res., 88:877-893.
[6] Dhar, V. and Bhatnagar, M. (2009). Physiology and Toxicity of Fluoride. Indian J. Dent. Res., 20:350-355. [7] Reddy, D.R. (2009). Neurology of endemic skeletal
fluorosis. Neurol. India, 57:7-12.
[8] Gupta, R., Saroj Gopal, K., Tripathi, M. and Sharma, U.D. (2001). Fluoride induced haematological and histopathological changes in fresh water fish (Labeo rohita). Biol. Mem., 26:27-31.
[9] Camargo, J.A. (2003). Fluoride toxicity to aquatic organisms: A review. Chemosphere, 50:251-264.
http://dx.doi.org/10.22161/ijeab/2.2.53 ISSN: 2456-1878
[11] Indian National Science Academy, (2011). Hazardous metals and metal pollution in India: sources, toxicity and managements. A position paper. New Delhi.
[12] Ahmed, M.F. Arsenic contamination: regional and global scenario. In: Arsenic contamination: Bangladesh perspective.TN-Bangladesh, BUET, Dhaka, Bangladesh (2003).
[13] Bamji, M.S. and Neelam, (2002). Environment and Nutrition-Effects of infections and interaction with heavy metals. Proc. Indian Natl. Acad. Sci., 68:401-14.
[14] Pedlar, R.M., Ptashynski, M.D., Evans, R. and Klaverkamp, J.F. (2002). Toxicological effects of
dietary arsenic exposure in Lake Whitefish
(Coregonus clupeaformis). Aquat.Toxicol. 57:167– 189.
[15] Bhattacharya, A. and Bhattacharya, S. (2007). Induction of oxidative stress by arsenic in Clarias batrachus; involvement of Peroxisomes, Ecotoxicol. Environ. Saf., 66:178-187.
[16] Roy, S. and Bhattacharya, S. (2006). Arsenic-induced histopathology and synthesis of stress proteins in liver and kidney of Channa punctatus. Ecotoxicol. Environ. Saf., 65:218-229.
[17] Ghosh, D, Bhattacharya, S. and Mazumder, S. (2006). Perturbations in the catfish immune responses by arsenic: organ and cell specific effects. Comp. Biochem. Physiol., 143:455-463.
[18] Gosh, L. and Adhikari S. (2006). Accumulation of heavy metals in fresh water fish- An assessment of toxic interactions with calcium. Am. J. Food Technol.,
1:139.
[19] Foulkes, R.G. and Anderson A.C. (1994). Impact of artificial fluoridation on salmon species in the North West USA and British Columbia Canada. Fluoride, 27:220-226.
[20] Das, S., Patro, S.K. and Sahu, B.K. (2001). Biochemical changes induced by mercury in the liver of penaeid prawns Penaeus indicus and P. monodon
(Crustacean: Penaeidae) from Rushikulya estuary, east coast of India. Indian J. Geo Mar. Sci., 30:246-252.
[21] Donohue, J.M., Abernathy, C.O. (1999).“Exposure to
inorganic arsenic from fish and shellfish.” in Arsenic exposure and health effects, Chappell WR, Abernathy CO and Calderon RL, Eds. Oxford, UK: Elsevier, 1999, pp 89-98.
[22] Koch, I., Reimer, K.J., Beach, A., Cullen, W.R., Gosden. A. and Lai V.W.M. “Arsenic speciation in
fresh-water fish and bivalves.” in Arsenic exposure and health effects IV, Chappell WR, Abernathy CO and Calderon RL, Eds. Oxford, UK: Elsevier, 2001, pp. 115–123.
[23] Chouhan, S. and flora, S.J.S. (2010). Arsenic and fluoride: Two major ground water pollutants. Indian J. Exp. Biol., 48:666-678.
[24] Li, D.S., Cutress, T.W., Pearce, E.I.F. and Cootec, G.E. (1996). Effect of arsenic or/and fluoride on mineralized tissues of the rat. Fluoride, 29:156-162. [25] Zhang, C., Ling, B., Liu, J. and Wang, G. (1999).
Effect of fluoride-arsenic exposure on the
neurobehavioral development of rat’s offspring, Wei Shengyan Jiu, 28:337.
[26] Chinoy, N.J. and Shah, S.D. (2004). Adverse effects of fluoride and/or arsenic on the cerebral hemisphere of mice and recovery by some antidotes. Fluoride,
37:162.
[27] Basu, T.K. and Dickerson, J.W. Vitamin E. in
Vitamins in human and disease, (CAB International, Walling ford, UK) 1996, 214.
[28] Rao, M.V. and Tiwari, H. (2006). Amelioration by melatonin of chromosomal anomalies induced by arsenic and/or fluoride in human blood lymphocyte cultures, Fluoride, 89:255.
[29] Mittal, M. and Flora, S.J.S. (2006). Effects of individual and combined exposure to sodium arsenite and sodium fluoride on tissue oxidative stress, arsenic and fluoride level in male mice. Chem-Biol. Interact., 152:128-39.
[30] Mittal, M. and Flora, S.J.S. (2007). Vitamin E supplementation protects oxidative stress during arsenic and fluoride antagonism in male mice. Drug Chem. Toxicol., 30:263-81.
[31] González-Horta, C., Ballinas-Casarrubias, L.,
Sánchez-Ramírez, B., Ishida, M. C., Barrera-Hernández, A., Gutiérrez-Torres, D. and Del Razo, L. M. (2015). A concurrent exposure to arsenic and
fluoride from drinking water in Chihuahua,
Mexico. Int. J. Environ. Res. Public Health, 12:4587-4601.
[32] WHO. (1990). Diet, nutrition and prevention of chronic diseases: report of a WHO study group (WHO technical report series; 797).
http://dx.doi.org/10.22161/ijeab/2.2.53 ISSN: 2456-1878
[35] Gikunju, J.K. (1992). Fluoride concentration in tilapia fish (Oreochromis leucostictus) from Lake Naivasha, Kenya. Fluoride, 25:37–43.
[36] Azmat, R., Talat, R. and Ahmed, K. (2007). The length- weight relationship, condition factor and
impact of fluoride concentration in Johnius
belangerii of Arabian Sea. Res. J. Environ. Toxicol, 1:138-143.
[37] Sivakumar, S., Karuppassamy, R. and Subhathra, S. (2006). Acute toxicity and behavioral changes in fresh water fish, Mystus vittatus (Bloch) exposed to chromium (VI) oxide. Nat. Environ. Poll. Tech., 5:381-388.
[38] Karuppasamy, R. (2001). Evaluation of acute toxicity levels and behavioral responses of Channa punctatus
(Bloch) to phenyl mercuric acetate. Ecol. Env. & Cons., 7:75-78.
[39] Rathnamma, V.V., Nagaraju, B. (2013). Median lethal concentration (LC50) of Chlorantraniliprole and its effects on behavioral changes in freshwater fish Labeo rohita. Int. J. Public Health Sci., 2:137-142.
[40] Chaurasia, N., Pandey, S.K. and Devendra, M. (2013). Determination of Arsenic content in the water and blood samples of Balia region using Hydride Generation Atomic Absorption Spectrophotometer. Res. J. Forensic Sci., 1:1-3.
[41] Pazhanisamy, K., Vasanthy, M., Indra, N. (2007). Bioaccumulation of arsenic in the freshwater fish
Labeo rohita (Ham.).The Bioscan, 2:67-69.
[42] Birkel, J.M. (1970). Direct Potentiometric
determination of fluoride in soft tooth deposits.
Carries Res., 4:243-55.
[43] Camargo, J.A and Tarazona, J.V (1991). Short-term toxicity of fluoride ion (F-) in soft water to rainbow trout and brown trout. Chemosphere, 22:605-611. [44] Wright, D.A. (1977). Toxicity of fluoride to brown
trout fry (Salmo trutta). Environ. Pollut.,12:57-62. [45] Kale, M.D., Muley, D.V. (2010). Sodium fluoride
induced protein alterations in fresh water fish, Labeo rohita. National J. Life Sci., 7:131-2.
[46] Bagale, M.B., Rao, K.R., Rokade, A.U. and Shah,
N.V. (2011). Sodium fluoride induced
histopathological changes in oesophagus and intestine of freshwater fish, Tilapia mossambica (Oreochromis mossambicus). J. Exp. Zool. India, 14:203-8.
[47] Suhendrayatha, O.A., Nakajima, T. and Maeda, S.,
(2002). Studies on the accumulation and
transformation of arsenic in fresh water organisms. I. Accumulation, transformation and toxicity of arsenic compounds on the Japanese Medaka, Oryzias latipes.
Chemophere, 46: 319-324.
[48] Narwaria, Y.S. and Saksena, D.N. (2012). Acute toxicity bioassay and behavioral responses induced by sodium fluoride in freshwater fish Puntius sophore
(Bloch). Fluoride, 45:7-12.
[49] Kovendan, K., Vincent, S., Janarthanan, S. and Saravanan, S. (2013). Expression of metallothionein in liver and kidney of freshwater fish Cyprinus carpio
var. communis (Linn.) exposed to arsenic trioxide. Am. J. Sci. Ind. Res., 4:1-10.
[50] Ananth, S., Mathivanan, V., Aravinth, S. and Sangeetha, V. (2014). Impact of arsenic metal toxicant
on biochemical changes in the grass carp,
Ctenopharyngodon idella. Int. J. Mod. Res. Rev.,
2:74-78.
[51] Akter, M. S., Ahmed, Md. K., Akhand, Md. A. A. and Islam, Md. M. (2008). Acute Toxicity of Arsenic and Mercury to Fresh Water Climbing Perch, Anabas testudineus (Bloch). World J. Zool., 3:13-18.
[52] Bhavani, K. and Karuppasamy, R. (2014). Acute toxicity bioassay and behavioral changes on zebra fish,
Danio rerio (Hamilton) under arsenic trioxide. Int. J. mod. res. rev., 2:40-46.
[53] Cao, J., Chen, J., Wang, J., Wu, X., Li, Y. and Xie, L. (2013). Tissue distributions in fluoride and its toxicity in the gills of a freshwater teleost, Cyprinus carpio.
Aquat. toxicol., 68:130-131.
[54] Aguirre-sierra, A., Alonso, L. and Camargo, J. A. (2013). Fluoride bioaccumulation and toxic effects on the survival and behavior of the endangered
white-clawed crayfish Austropotamobius pallipes
(Lereboullet). Arch. Environ. Contam. Toxicol.,
http://dx.doi.org/10.22161/ijeab/2.2.53 ISSN: 2456-1878
TABLES
Table.1. Parameter Estimates for fluoride vs. Clarias gariepinus
Parameter Estimate Std. Error Z Sig. 95% Confidence Interval
Lower Bound Upper Bound
Probita Concentration 5.769 1.278 4.513 .000 3.264 8.275
Intercept -16.107 3.584 -4.494 .000 -19.691 -12.523
a. PROBIT model: PROBIT(p) = Intercept + BX (Covariates X are transformed using the base 10.000 logarithm.)
Table.2: Log concentration, observed responses in fish Clarias gariepinus
Number Concentration Number of
Subjects
Observed Responses
Expected
Responses Residual Probability
1 2.000 10 0 .000 .000 .000
2 2.301 10 0 .023 -.023 .002
3 2.477 10 0 .347 -.347 .035
4 2.602 10 0 1.367 -1.367 .137
5 2.699 10 5 2.960 2.040 .296
6 2.778 10 6 4.684 1.316 .468
7 2.903 10 7 7.394 -.394 .739
8 3.000 10 8 8.851 -.851 .885
9 4.079 10 10 10.000 .000 1.000
Table.3: Confidence Limits for fish Clarias gariepinus
Probibility Probit point
95% Confidence Limits for Concentration 95% Confidence Limits for log(Concentration)a
Concentration Lower Bound Upper Bound Concentration Lower Bound Upper Bound
LC1 244.701 112.764 343.699 2.389 2.052 2.536
LC25 473.113 333.445 590.361 2.675 2.523 2.771
LC45 588.976 454.322 743.495 2.770 2.657 2.871
LC50 619.269 484.202 789.417 2.792 2.685 2.897
LC75 810.576 649.953 1141.940 2.909 2.813 3.058
LC96 1245.487 938.671 2279.511 3.095 2.973 3.358
LC99 1567.196 1119.693 3366.831 3.195 3.049 3.527
http://dx.doi.org/10.22161/ijeab/2.2.53 ISSN: 2456-1878
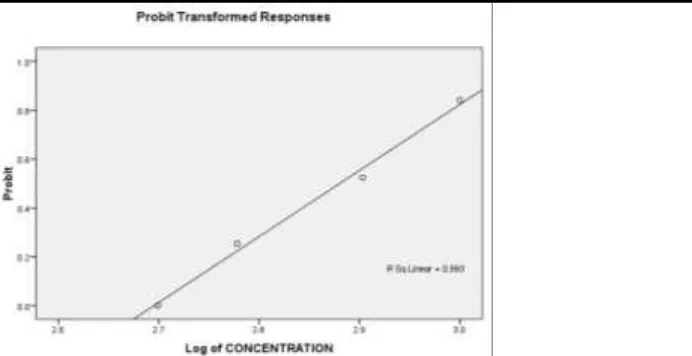
Fig. 1:The graph showing linear curve between Log concentrations of sodium fluoride against probit mortality of fish Clarias gariepinus
Table.4: Parameter Estimates for arsenic vs. Clarias gariepinus
Parameter Estimate Std. Error Z Sig. 95% Confidence Interval
Lower Bound Upper Bound
Probita Concentration 6.110 1.845 3.312 .001 2.495 9.726
Intercept -9.056 2.795 -3.240 .001 -11.851 -6.260
a. PROBIT model: PROBIT(p) = Intercept + BX (Covariates X are transformed using the base 10.000 logarithm.)
Table.5: Log concentration, observed responses in fish Clarias gariepinus
Number Concentration Number Of
Subjects
Observed Responses
Expected
Responses Residual Probability
1 1.301 6 1 .807 .193 .134
2 1.398 6 2 1.823 .177 .304
3 1.602 6 3 4.611 -1.611 .768
4 1.653 6 6 5.114 .886 .852
5 1.778 6 6 5.789 .211 .965
Table.6: Confidence Limits for fish Clarias gariepinus
Probibility Probit Point
95% Confidence Limits for Concentration 95% Confidence Limits for log(Concentration)a
Concentration Lower Bound Upper Bound Concentration Lower Bound Upper Bound
LC1 12.626 3.133 18.568 1.101 .496 1.269
LC25 23.528 13.540 29.175 1.372 1.132 1.465
LC45 28.934 20.762 35.956 1.461 1.317 1.556
LC50 30.337 22.603 38.210 1.482 1.354 1.582
LC75 39.116 31.793 59.390 1.592 1.502 1.774
LC96 58.678 44.318 148.423 1.768 1.647 2.172
LC99 72.893 51.518 248.919 1.863 1.712 2.396
http://dx.doi.org/10.22161/ijeab/2.2.53 ISSN: 2456-1878
Parameter Control group Fˉˉ exposed group As exposed group
Body position Horizontal at the bottom of the aquarium
Both horizontal and vertical At the bottom of the aquarium
Operculum movement
2 per 5 minutes 6-7 per 5 minutes 7-8 per 5 minutes
Sensitivity to food Immediate Slow Initially unresponsive then
sluggish Swimming
movements
Normal Erratic Erratic
Fig. 2: The graph showing linear curve between Log concentrations of arsenic trioxide against probit mortality of fish Clarias gariepinus
Fig. 3: Comparisonin the concentrations of arsenic in blood and tissue of Clarias gariepinus. 7
2
6
0.7
0.36 0.33 0.28 0.31
0 1 2 3 4 5 6 7 8
A(600+10) B(350+20) C(600+20) D(350+40)
A
n
al
ysed
c
o
n
c.of
Fl
u
o
ri
d
e
in
m
g/
L
http://dx.doi.org/10.22161/ijeab/2.2.53 ISSN: 2456-1878
Fig. 4: Comparisonin the concentrations of fluoride in blood and tissue of Clarias gariepinus
Fig.5: Comparison in the bio concentration factors of arsenic and fluoride in blood and tissues of Clarias gariepinus 0.64
3.11
1.34
3.11
0.50 0.50 0.49 0.48
0.00 0.50 1.00 1.50 2.00 2.50 3.00 3.50
A(600+10) B(350+20) C(600+20) D(350+40)
A
n
al
ysed
c
o
n
c.of
Fl
u
o
ri
d
e
in
µ
g/
L
Different doses of fluoride and Arsenic in (ppm) Tissue Blood
0.64
3.11
1.34
3.11
0.6 0.8 0.58 0.88
0.50 0.50 0.49 0.48
0.04 0.13 0.02 0.38
0.00 0.50 1.00 1.50 2.00 2.50 3.00 3.50
A(600+10) B(350+20) C(600+20) D(350+40)
B
io
co
n
ce
n
tr
ation
fact
o
r
Different doses of Fluoride and Arsenic in (ppm)
AsT
FT
AsB