44
Volume-4, Issue-4, August-2014,
ISSN No.: 2250-0758
International Journal of Engineering and Management Research
Available at:
www.ijemr.net
Page Number: 44-53
The Efficiency Testing of Weak Form of the Indian Stock Market
Sachin K1, Kantesha Sanningammanavara2
1Student in Business Administration, Vidyavardhaka College of Engineering, Gokulam 3rd Stage, Mysore, INDIA 2
Assistant Professor, Department of Business Administration, Vidyavardhaka College of Engineering, Gokulam 3rd Stage, Mysore, INDIA
ABSTRACT
The efficient market hypothesis states that stock prices in financial markets should reflect to all information available; as a result of this, prices shouldbe consistent with fundamentals. The efficiency the stock market should not be overstated. Efficient Stock Markets make available the funds for the developmental purposes. They give opportunities to investors to diversify their variety of assets. In general, ideal market is the one in which prices provide accurate signals for resources allocation so that firms can make productive investment decisions and investors can choose among the stocks under the assumption that shock prices fully reflect all the available information at any time. A market in which prices fully reflect all available information is called efficient. This paper takes into consideration twenty three stocks in different sectors of National Stock Exchange and tries to investigate the efficiency of Indian stock market. The random walk hypothesis is examined using serial autocorrelation test, a non-parametric runs test.This study examines the random walk hypothesis to determine the validity of weak-form efficiency for Indian stock markets.Daily returns from 1st
April 2004 to 31st March 2014 used for the study. The empirical results of this study support previous studies that Indian stock markets are weak-form inefficient. With the exception of the results from serial autocorrelation test, runs test are similar and reject random walk hypothesis for Indian stock markets. The results show that the behaviour of share price displays considerably more violations of the random walk hypothesis.
Keywords – Market Efficiency, Indian Capital Market, Runs Test, Autocorrelation JEL Codes
I.
INTRODUCTION
Efficiency market hypothesis (EMH) is an important theory in terms of the understanding the equity market and the cost of equity capital for the firms. In terms of capital market theory, the conception of market efficiency is used to explain the degree to which stock price reflect available and relevant information in a timely manner fully. The Efficient market hypothesis (EMH) states that at any given time, stocks price fully reflect to all
45
In 1965 Nobel prize winner Paul Samuelson supported the efficient market hypothesis and endorsed the concept of random walk. Fama (1965) defined the term efficient market as one in which security prices fully reflect all available information so that old information cannot be used to foretell future price movements. As an extension of the EMH he re-endorsed the Random Walk Theory which states that stock prices are absolutely independent and they cannot form a proper base for taking an investment decision. The random walk model of asset prices is an extension of the EMH, as are the notions that the market cannot be consistently beaten, arbitrage is impossible and free lunches are generally unavailable.
An efficient capital market is one where no individual investor will have an opportunity to earn excess return. And this happens because the price discovery mechanism would be so systematic that the market prices of the securities would reflect all the relevant information. The stock price of a particular security would have been determined at that equilibrium point where demand meets supply in an efficient market. This occurs because the demand and supply would arise or fall because all investors would utilize all the information relating to historical trend or publicly and/or privately available news, almost at the same time. Thus, as already said, no investor can have an opportunity in an efficient market to earn an above-normal return.
Efficient Market Hypothesis is described by Samuelson (1965) and Fama (1970) supposing that security prices adjust rapidly to the new information and ensure that the price at any given point in time reflect all available information. This makes the price changes to follow a random walk process (Awad and Daraghma, 2009). Fama (1971) researched further and coined three levels of efficiency one can classify any market into, viz., weak-form, semi-strong-form and strong-form.
Weak-form of market efficiency entails that stock prices reflect all the past price and volume related data. This is so possible in today’s era of information technology, where availability and accessibility of such information is abundant, but, still the question remains if market participants are using such information and thus making a market efficient in its weak-form.
Semi-strong-form of market efficiency claims that the stock prices subsume all the past data of trends and also all publicly available information, like the dividend declaration, director’s statements, company’s press releases, stock split, bonus issues, ongoing controversies etc. Even though this information are publicized at one point of time, the speed at which it reaches different investment points differs and thereby causes the investor who gathered the said information at first gets to make an abnormal return. A market which is efficient at this level would ensure that the information dissemination occurs almost instantly to the maximum part of investing community of the market.
A strong-form efficient market would exhibit a peak level of efficiency in its price discovery process, that there is no information in the market, which is alien to any participant in the market. Even the private-most information is also available and strewn throughout the market. It would be the most ideal market that would move without any surprising turn of trend, unless and until there is a new information appearance. This would be a level of adeptness that even an insider would not be able to make an over-the-normal return.
Considering the level of inter-dependency of markets across the world due to globalization and other forms of integration, it becomes of utmost importance to study if markets in general are efficient. Foreign Portfolio Investments are increasingly looking for newer and emerging markets to diversify their risk. In the process of diversifying, it should not happen such that they end up taking higher risk, by investing in an unknown market. This necessitates them to test the level of efficiency that these markets operate at and thereby define the level of risk that they would be assuming in their investment process. This would also back them in designing mechanisms of information based portfolio reviews.
As developed markets’ return potential is becoming normal and matured, investors, in the past few decades have turned their hunting heads towards emerging markets. These emerging markets in the wake of achieving prosperity have adopted a series of measures to improvise their capital markets and make them attractive. The question now for the foreigners who are considering these markets and also the domestic regulators of these markets is how efficient are these markets in providing platform for a larger and more knowledgeable investor base.
In this context, it becomes important to keep testing the efficiency levels of capital markets. While it becomes subjective as well as biased to test the semi-strong and semi-strong form of market efficiencies, testing for weak-form of market efficiency can be done to a reasonable level of accuracy. Testing weak-form of EMH is basically about testing the randomness of stock price changes over a given period of time, and thus found out randomness determines if a market is efficient or inefficient in its weak-form. Hence, this study aims to test the weak-form of market efficiency levels of selected emerging markets across the globe, selected based on MSCI Emerging Markets definition and thus trying to conclude upon the nature of these markets.
II.
REVIEW OF LITERATURE
The followings are the researches that have been conducted so for in the area of EMH in India and outside India
Ramasastri (1999) Tested Indian stock markets during 1990s using the Dickey-Fuller unit root test and accepted that the stocks prices follow a random walk.
Samanta (2004) Used daily data on the BSE-100 for
46
establish interesting results that market efficiency differ in different time periods.
Poshakwale (1996) showed that Indian stock market was weak form in efficient, he used daily BSE index data for the period 1987 to 1994.
Jarrett (2010) weak form of efficiency does not exist for the emerging markets as the returns are predictable and so the desire of stock markets to become strongly efficient is much difficult. Also in certain developed markets even, the role of insider trading is important as these individuals can surely beat the market.
Mobarek and keasey (2000) possibility that the stock prices are not adjusted by the information availability as are expected because different investors interpret information in different ways. So there can be instances that the prices of stocks will move in a way not justified by the information available.
Akbar and Baig (2010) Market efficiency does not occur
by itself even if information is readily available in the market. It heavily depends upon the interpretational and analytical abilities of the traders present in the market considering they have sufficient time and are willing to transfer the sensitive information that plays an important role in the fluctuation of stock market returns.
Fama (1991) the judgment of market efficiency literature is based on how it improves our ability to describe the time series and cross-sectional returns of security returns.
Bhanu Pant and T R Bishnoy (2001) analysed the weak
for of efficiency on the daily and weekly returns of five Indian stock market indices for the time period between 1996 and 2001. The authors found that the Indian stock market indices do not follow random walk.
David Walsh (1997) employed variance ratio to test the efficiency of the Australian Stock Exchange over a period fifteen years starting from 1980 to 1995. His results suggested that many indices of the stock exchange follow the random walk.
Madhumita Chakra Bor (2006) investigated the stock price behavior using daily closing figures of Milanka Price Index during January 1991 to December 2001 and daily closing prices of twenty-five underlying individual companies included in the index from July 1991 to May 1999. The study found that stock market in Sri lank did not follow random walk, while results of weak form efficient market hypothesis in twenty-five companies showed mixed outcome.
Madhusudan (1998) found that NSE nifty and national indices did not follow random walk. Using correlation analysis on monthly stock returns data over the period January 2009 to November 2012
New opinion about the three assumptions of market efficiency is that the test result regarding the semi strong and strong form of market efficiency are same but the new research about weak form of market efficiency differs from the old theory. It says that the stock market returns can be predicted from the observed regularities from the past prices.
III.
STATEMENT OF THE PROBLEM
AND RESEARCH GAP
This study is follows are background on the institutional nature and development of the stock markets in India, as well as discusses some special features related to efficiency of Indian stock market. Testing of efficient market hypothesis is explained in a theoretical and an empirical point view. And study the previous empirical evidence on weak-form efficiency in developed, emerging and Indian stock market as well. Describe the dates, hypotheses test and using some methodology of the study. Give empirical results and conclusion the results of this study and as well as provide suggestion for future research.
IV.
SCOPE OF THE STUDY
The purpose of our research is to investigate the weak form of market efficiency of Indian stock market which is actively traded. For our study we took a daily closing price of nifty 23 stock markets under the study from the 1st April 2004 to 31st March 2014 and also divide full sample as in three interval periods, and have applied various test like Runs Test, Auto Correlation and other test and developed hypothesis that stock markets under study are weak form efficient or not.
V.
OBJECTIVES OF THE STUDY
1. To determine whether the Indian stock market follows a random walk model
VI.
RESEARCH METHODOLOGY:
Type of Research – Descriptive
VII.
COLLECTION OF DATA
The data analyzed in this paper has been collected from a wide range of reliable sources. The data has been collected basically from the official website of NSE i.e., www.nseindia.org.The Data consists of daily closing prices of nifty 23 in different sectors (It, Automobile, Energy, Finance, FMCG and Pharma) companies of India from 1st April 2004 to 31st march 2014.
VIII. DATA ANALYSIS TOOLS
The tools which are used both parametric tests and non-parametric tests to analyses the randomness of stock price of company in nifty 50. Dickey Fuller test and Auto-correlation coefficient test are the parametric tests and modern approaches applied to check the randomness in prices. Runs test has been traditionally used as a non-parametric tool to comment on randomness of prices.
47
Non Parametric Test
Runs Test
Parametric Test
Autocorrelation
ANOVA Test
Software Packages
The study uses SPSS Version, AMOS and Microsoft Office Excel 2007 for performing data analysis and generating results.
Limitations of the Study:
Only secondary data will be used for the study
The study confined only NSE nifty 23 companies
The data used only 10 years
Only weak-form of efficiency will be test
Results of Data Analysis and Interpretation Runs Test
In Runs test is a non-parametric test. It depends only on the sign of the stock prices changes but not on the magnitude of the stock price. It does not require the specification of the probability distribution. The main
drawbacks of using Runs Test that it could not be detect the amount of change from means because it only looks at the number of positive or negative changes. By its comparing the total number of runs in the data with the expected number of runs under which are random walk hypothesis, the test of the random walk hypothesis may be constructed. The Positive Z indicates that there are too many runs in the sample, and the negative value of Z indicates that there are less runs than one would expect if the changes were random. Another important advantages of this test are its simplicity and independence of extreme values in the sample.
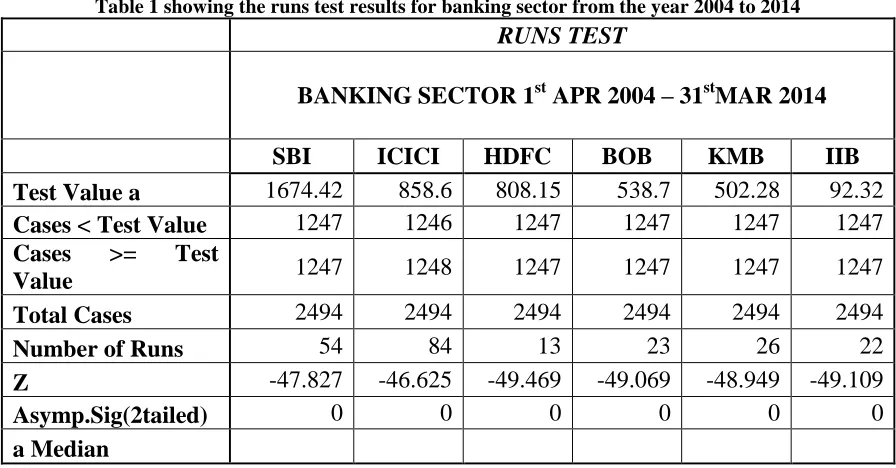
Testing Efficiency of Market on Banking Stocks H0: Banking Sector Stocks follow a Random Walk. H1: Banking Sector Stocks do not follow a Random Walk.
Table 1 showing the runs test results for banking sector from the year 2004 to 2014
RUNS TEST
BANKING SECTOR 1
stAPR 2004 – 31
stMAR 2014
SBI
ICICI
HDFC
BOB
KMB
IIB
Test Value a
1674.42
858.6
808.15
538.7
502.28
92.32
Cases < Test Value
1247
1246
1247
1247
1247
1247
Cases
>=
Test
Value
1247
1248
1247
1247
1247
1247
Total Cases
2494
2494
2494
2494
2494
2494
Number of Runs
54
84
13
23
26
22
Z
-47.827
-46.625
-49.469
-49.069
-48.949
-49.109
Asymp.Sig(2tailed)
0
0
0
0
0
0
a Median
The above table shows the results of Runs Test conducted for six different Banking Stocks on daily prices for ten years starting from 1st Apr, 2004 to 31st Mar, 2014. The Z Value for SBI Stock is negatively. However, the critical value of Z for 95% level of confidence is 1.96, which means that the calculated value is falling in the rejection area for all the selected banks. Therefore, the null
hypothesis is rejected and Stocks do not not fallow the random walk.
48
Table 2showing the runs test results for IT sector from the year 2004 to 2014
IT SECTOR
1st APR 2004-31st MAR 2014
Wipro Ltd.
HCL Technologies Ltd.
Test Value a
463.48
404.6
Cases < Test Value
1247
1247
Cases >=Test Value
1247
1247
Total Cases
2494
2494
Number of Runs
71
40
Z
-47.146
-48.388
Asymp. Sig(2tailed)
0
0
It can be seen in table 2 that the Z value negative for both the IT firmsand the critical value of Z for 95% level of confidence is 1.96, which means that the calculated value is falling in the rejection area. Therefore, the null hypothesis is rejected and does not fallow the random walk.
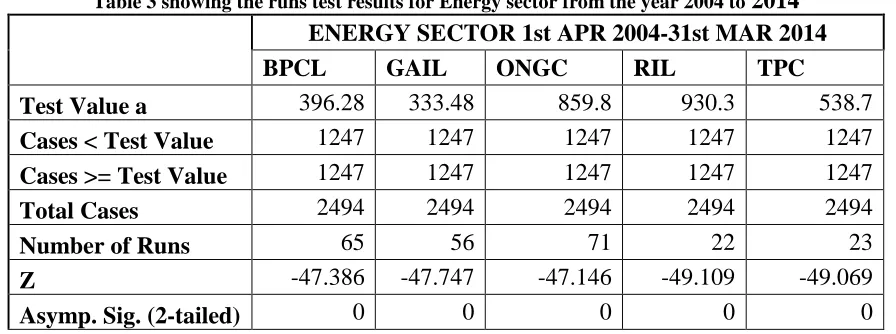
Testing Efficiency of Market on Energy Sector Stocks H0: Energy Sector Stocks follow a random walk. H1: Energy Sector Stocks do not follow a random walk.
Table 3 showing the runs test results for Energy sector from the year 2004 to
2014
ENERGY SECTOR 1st APR 2004-31st MAR 2014
BPCL
GAIL
ONGC
RIL
TPC
Test Value a
396.28
333.48
859.8
930.3
538.7
Cases < Test Value
1247
1247
1247
1247
1247
Cases >= Test Value
1247
1247
1247
1247
1247
Total Cases
2494
2494
2494
2494
2494
Number of Runs
65
56
71
22
23
Z
-47.386
-47.747
-47.146
-49.109
-49.069
Asymp. Sig. (2-tailed)
0
0
0
0
0
The above table shows that the values of Z are skewed very much towards left for all the firms. However, the critical value of Z for 95% level of confidence is 1.96, which means that the calculated value is falling in the rejection area. Therefore, the null hypothesis is rejected and any of the stocks do not fallow the random walk.
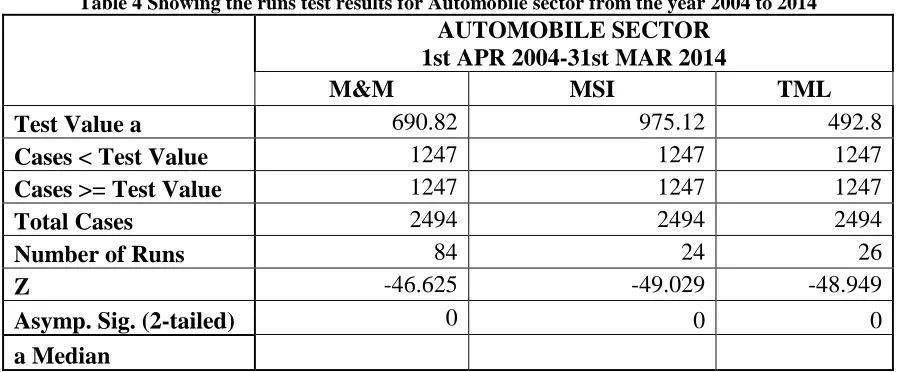
Testing Efficiency of Market on Automobile Sector Stocks
49
Table 4 Showing the runs test results for Automobile sector from the year 2004 to 2014
AUTOMOBILE SECTOR
1st APR 2004-31st MAR 2014
M&M
MSI
TML
Test Value a
690.82
975.12
492.8
Cases < Test Value
1247
1247
1247
Cases >= Test Value
1247
1247
1247
Total Cases
2494
2494
2494
Number of Runs
84
24
26
Z
-46.625
-49.029
-48.949
Asymp. Sig. (2-tailed)
0
0
0
a Median
The above table shows that the values of Z are skewed very much towards left for all the firms. However, the critical value of Z for 95% level of confidence is 1.96, which means that the calculated value is falling in the rejection area. Therefore, the null hypothesis is rejected
and any of the stocks selected in automobile industry do not fallow the random walk.
Testing Efficiency of Market on Pharmaceuticals Sector Stocks
H0: Pharma Sector Stocks follow a random walk. H1: Pharma Sector Stocks do not follow a random walk.
Table 5Showing the runs test results for Pharma sector from the year 2004 to 2014
PHARMA SECTOR
1st APR 2004-31st MAR 2014
Cipla Ltd. Dr. Reddy's
Lupin Ltd.
Sun Pharma
Test Value a
303.98
1072.08
635.48
786.68
Cases < Test Value
1247
1247
1247
1247
Cases >= Test Value
1247
1247
1247
1247
Total Cases
2494
2494
2494
2494
Number of Runs
35
4
63
21
Z
-48.588
-49.83
-47.467
-49.149
Asymp. Sig. (2-tailed)
0
0
0
0
a Median
The above table shows that the values of Z are skewed very much towards left for all the firms. However, the critical value of Z for 95% level of confidence is 1.96, which means that the calculated value is falling in the
rejection area. Therefore, the null hypothesis is rejected and any of the stocks do not fallow the random walk.
50
Table 6Showing the runs test results for consumer sector from the year 2004 to 2014
FMCG GOODS 1
stAPR 2004-31st MAR 2014
Asian Paints Ltd.
I T C Ltd.
United Spirits
Ltd.
Test Value a
1032.45
207.4
931.28
Cases < Test Value
1247
1246
1247
Cases >= Test Value
1247
1248
1247
Total Cases
2494
2494
2494
Number of Runs
21
31
40
Z
-49.149
-48.748
-48.388
Asymp. Sig. (2-tailed)
0
0
0
a Median
The above table shows that the values of Z are skewed very much towards left for all the firms. However, the critical value of Z for 95% level of confidence is 1.96, which means that the calculated value is falling in the rejection area. Therefore, the null hypothesis is rejected and any of the stocks selected in the FMCG do not fallow
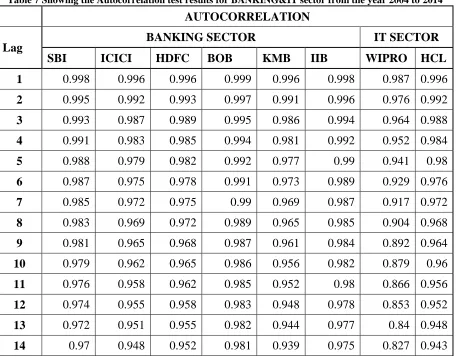
the random walk. Parametric Test – Autocorrelation
Table 7 Showing the Autocorrelation test results for BANKING&IT sector from the year 2004 to 2014
AUTOCORRELATION
Lag
BANKING SECTOR
IT SECTOR
SBI
ICICI
HDFC
BOB
KMB
IIB
WIPRO HCL
1
0.998
0.996
0.996
0.999
0.996
0.998
0.987 0.996
2
0.995
0.992
0.993
0.997
0.991
0.996
0.976 0.992
3
0.993
0.987
0.989
0.995
0.986
0.994
0.964 0.988
4
0.991
0.983
0.985
0.994
0.981
0.992
0.952 0.984
5
0.988
0.979
0.982
0.992
0.977
0.99
0.941
0.98
6
0.987
0.975
0.978
0.991
0.973
0.989
0.929 0.976
7
0.985
0.972
0.975
0.99
0.969
0.987
0.917 0.972
8
0.983
0.969
0.972
0.989
0.965
0.985
0.904 0.968
9
0.981
0.965
0.968
0.987
0.961
0.984
0.892 0.964
10
0.979
0.962
0.965
0.986
0.956
0.982
0.879
0.96
11
0.976
0.958
0.962
0.985
0.952
0.98
0.866 0.956
12
0.974
0.955
0.958
0.983
0.948
0.978
0.853 0.952
13
0.972
0.951
0.955
0.982
0.944
0.977
0.84 0.948
51
15
0.968
0.944
0.949
0.98
0.935
0.973
0.813 0.939
16
0.966
0.941
0.946
0.978
0.93
0.971
0.801 0.935
The results above table indicate a high degree of dependence on previous prices when the lag is low. However, as the time lag increases the impact of past prices is found to be reducing.
For all the firms, autocorrelation values are ranging between 0.941 & 0.999. However, the market to be
efficient in its weak form the values of autocorrelation should be around zero. That means the share prices do not follow the weak form of efficiency or the market is inefficient in its weak form for all the firms selected.
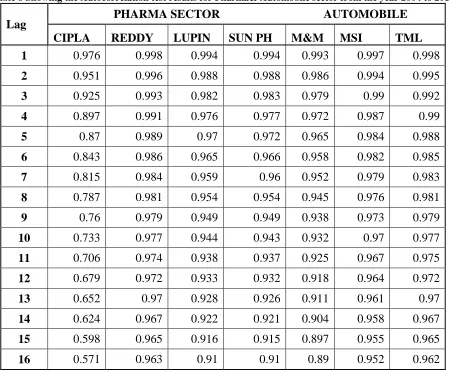
Table 8 Showing the Autocorrelation test results for Pharma& Automobile sector from the year 2004 to 2014
Lag
PHARMA SECTOR
AUTOMOBILE
CIPLA
REDDY
LUPIN
SUN PH
M&M
MSI
TML
1
0.976
0.998
0.994
0.994
0.993
0.997
0.998
2
0.951
0.996
0.988
0.988
0.986
0.994
0.995
3
0.925
0.993
0.982
0.983
0.979
0.99
0.992
4
0.897
0.991
0.976
0.977
0.972
0.987
0.99
5
0.87
0.989
0.97
0.972
0.965
0.984
0.988
6
0.843
0.986
0.965
0.966
0.958
0.982
0.985
7
0.815
0.984
0.959
0.96
0.952
0.979
0.983
8
0.787
0.981
0.954
0.954
0.945
0.976
0.981
9
0.76
0.979
0.949
0.949
0.938
0.973
0.979
10
0.733
0.977
0.944
0.943
0.932
0.97
0.977
11
0.706
0.974
0.938
0.937
0.925
0.967
0.975
12
0.679
0.972
0.933
0.932
0.918
0.964
0.972
13
0.652
0.97
0.928
0.926
0.911
0.961
0.97
14
0.624
0.967
0.922
0.921
0.904
0.958
0.967
15
0.598
0.965
0.916
0.915
0.897
0.955
0.965
16
0.571
0.963
0.91
0.91
0.89
0.952
0.962
The results above table indicate a high degree of dependence on previous prices when the lag is low. However, as the time lag increases the impact of past prices is found to be reducing.
For all the firms, autocorrelation values are ranging between 0.571 & 0.998. However, the market to
52
Table9 Showing the Autocorrelation test results for Energy &FMCG sector from the year 2004 to 2014
Lag
ENERGY SECTOR
FMCG SECTOR
BPCL
GAIL
ONGC
RIL
TPC
ASL
ITC
USL
1
0.995
0.996
0.997 0.997 0.998
0.997
0.995
0.997
2
0.989
0.992
0.994 0.995 0.996
0.994
0.99
0.994
3
0.984
0.988
0.991 0.992 0.994
0.991
0.985
0.991
4
0.979
0.984
0.988 0.989 0.992
0.988
0.98
0.988
5
0.973
0.981
0.985 0.987
0.99
0.985
0.976
0.985
6
0.968
0.978
0.982 0.985 0.988
0.982
0.971
0.982
7
0.963
0.976
0.979 0.983 0.986
0.979
0.966
0.979
8
0.957
0.973
0.977 0.981 0.984
0.976
0.961
0.976
9
0.952
0.969
0.974 0.979 0.982
0.973
0.957
0.973
10
0.947
0.966
0.971 0.977
0.98
0.97
0.952
0.97
11
0.942
0.963
0.969 0.974 0.978
0.967
0.948
0.967
12
0.937
0.959
0.966 0.972 0.977
0.964
0.944
0.964
13
0.932
0.956
0.963
0.97 0.975
0.961
0.94
0.962
14
0.927
0.952
0.96 0.967 0.973
0.959
0.935
0.959
15
0.922
0.949
0.957 0.965 0.971
0.956
0.931
0.956
16
0.917
0.945
0.954 0.962
0.97
0.953
0.927
0.953
For all the firms as shown in the above table, the results of autocorrelation values are ranging between 0.917 & 0.998. However, the market to be efficient in its weak form the values of autocorrelation should be around zero. That means the share prices do not follow the weak form of efficiency or the market is inefficient in its weak form for all the firms selected.
IX.
FINDINGS OF THE STUDY
It is been found in this study that the Indian stock market is not an efficient.
It is been found that the market is in the weak form of efficiency for all sectors of companies.
The study shown that there is no significant difference in the returns of the days of the week for all the stocks selected in six sectors.
X.
SUGGESTIONS AND
RECOMMENDATIONS
For the study, the researcher suggests that the movements of the share prices can be predicting in future price.
It is suggested to the regulators of the stock market to formulate the norms and policies to make our capital market to be efficient.
For the investors it is recommended to time the market for the higher returns as the market can be predicted at various levels.
Investors are suggested to be very caution on the news events as this may impact share prices severely.
XI.
CONCLUSION
53
returns are possible only when the market is inefficient as the future prices can be predicted using the past information. Thus, observation and the use of the past behavior of stock price movement may help investors in generating excess profits.
The practical implication of inefficiency in stock markets is that, it may lead to the variation in the expected returns of the stocks. In the state of inefficiency, the share prices may not reflect the fair value of the stocks because of which the companies with lower fair value of shares may find it difficult to raise capital, which may disturb the investment pattern in the country in long-term. The condition of weak form market inefficiency may have positive impact on the financial innovation because the opportunity of earning abnormal profit may be increases the short-term investments in the country.
Therefore Indian stock market, the price movement of stock can predict, market should be reacting on new information. So investor can know the market conduction and market movement before investment.
XII.
SCOPE FOR FUTURE RESEARCH
The future implication of this present research work is considered, the research work on Indian stock markets done in past may be functional for the researchers who are all wish to work on the same topic line in future because these type of studies are persistent in nature.
The observations, which are drawn from such studies conducted in one time period, may be helpful in justifying the studies of future researchers. In addition, the future studies who wish to work on same topic, to find what all the information should be are react, this help to investor to better predict the price movement more than this report.
REFERENCES
[1] Akbar, M, Baig, H., (2010). Reaction of Stock Prices to Dividend Announcements and Market Efficiency in Pakistan. The Lahore Journal of Economics, 15 (1), p. 103-25.International Journal of Business and Management, March, 2009, Volume-4, No-3.
[2] Bhanu Pant and Dr.Bishnoy(2001),‖Testing Random Walk Hypothesis for Indian Stock Market Indices, paper presented at iicm conference in 2002, pp. 1-15. [3] Ball, R., and Brown, P. (1968): ―An empirical evaluation of accounting income numbers‖. Journal of Accounting Research, vol. 6, 159-178.
[4] David Walsh(1997),‖Variance Ratio tests of random walks in Australian Stock Market Indices‖ Unionversity of Western Australia working paper available
athttp://www.af.ecel.uwa.edu.au/__data/page/9429/97-074.pdf, pp 1-30.
[5] Fama, E. (1970). Efficient Capital Markets: A Review of Theory and Empirical Work, Journal of Finance, 25, 283-306.
[6] Granger, C. W. J., and Morgenstern, O.(1963): ―Spectral analysis of New York stock market prices‖. Kyklos, vol. 16, 1-27.
[7] Huang, B. N. (1995): ―Do Asian stock markets follow random walks: Evidence from the variance ratio test‖. Applied Financial Economics, vol. 5, no. 4, 251-256. [8] HinYuChung. Testing Weak- Form Efficiency of the Chinese Stock Market, September 18th 2006.
[9] Jarrett, E.J., (2010). Efficient markets hypothesis and daily variation in small Pacific-basin stock markets. Management Research Review, 33(12), p. 1128-139. [10] Lo, A. W., and MacKinlay, A. C. (1988): ―Stock market prices do not follow random walks: Evidence from a simple specification test‖. Review of Financial Studies, vol. 1, no. 1, 41-66.
[11] Madhusudan, T.P.,(1998), ―Persistence in the Indian Stock Market Returns: An application of Variance Ratio Test‖, Vikalpa, Vol.23(4), pp.61-73. [12] MadhumitaChkraborty (2006), ―On validity of Random Walk Hypothesis in Colombo Stock Exchange, Sri Lamka‖, Decision, Vol33(1), pp.135-161.
[13] Mobarek, A, and Keasey, K. (2002): ―Weak-Form Market Efficiency of and Emerging Market: Evidence from Dhaka Stock Market of Bangladesh‖. [E-document][Retrieved October,26,2005] From: http://www.bath.ac.uk /centers / CDS / Enbspapers /Mobarek_new.hm.
[14] Moustafa, M. A. (2004): ―Testing the Weak-Form Efficiency of the United Arab Emirates Stock Market‖. International Journal of Business, vol. 29, no. 3, 310-325. [15] Ojah, K., and Karemera, D. (1999): ―Random Walk and Market Efficiency Tests of Latin American Emerging Equity Markets: A Revisit‖. The Financial Review, vol. 34, no. 2, 57-72.
[16] Poshakwale, S., ―The Random Walk Hypothesis in the Emerging Indian Stock Market‖, Journal of Business Finance & Accounting, Volume 29, Issue9-10, Pages 1275–1299, 2002.
[17] Poterba, J., and summers, L. (1986): ―The Persistence of Volatility and Stock Market Fluctuations‖. American Economic Review, vol. 76, 1142-1151.
[18] Ramasastri, A. S., (1999). Market efficiency in the Nineties: Testing through Unit Roots Prajanan, Vol. XXVIII, No.2, pp.155-161.
[19] Sunil Poshakwale, Evidence On Weak Form Efficiency And Day Of The Week Effect In The Indian Stock Market, Finance India Vol. X No. 3, September 1996 Pages— 605-616.