51
RACIAL DIFFERENCES IN ECONOMIC BEHAVIOR
PATTERNS AND MARKET PERFORMANCE IN BUSINESS
VENTURES: A COMPARATIVE STUDY OF BLACK-OWNED
AND WHITE-OWNED BUSINESS ENTERPRISES
D. Anthony Miles
Our Lady of the Lake University, San Antonio, Texas USA
Abstract
The purpose of this study is to compare entrepreneurial risk and market behavior patterns between BBE and WBE. This study is a continuation of a prior study on SMEs. A majority of the prior research on Black-owned business enterprises (BBE) concluded that they are less successful and have dismal profitability compared to White-owned business enterprises (WBE). Two independent studies are conducted comparing both groups. Both ethnic/SME groups are examined across 11 different industry types. This research examines the market and economic and entrepreneurial risk patterns of BBEs compared to WBEs. A multivariate regression analysis is used to measure ethnicity as a predictor variable. The results indicate that BBEs were not much different or any more risky compared to WBEs. Despite the prior research that states to the contrary, the results indicate that BBEs are equally likely to be as competitive as WBEs in terms of firm dynamics.
Key words
Economic behavior; Market performance; Black-owned business enterprises; Market patterns; Customer turnover.
INTRODUCTION
prior research on the firm survival of BBEs has been bleak at best. This leaves many researchers to conclude dismal success and failure is a self-fulfilling prophecy concerning BBEs.
Two major key influences in comparing BBEs to WBEs are social and economic constraints. Nevertheless, BBEs have been successful in their own right that may transcend race, socioeconomic factors. Most notable, financing and venture funding has been a challenge (Boden & Headd, 2002; Zajonc, 2003; Handy, 2008; Strang, 2001). However, BBEs can still be competitive in their own marketplaces (Porter, 1995a; Porter, 1995b; Porter, 1995c; Robb, 2002; Renzulli, 2009). Thus, entrepreneurial risk plays a pivotal role in comparing BBEs to WBEs. By examining entrepreneurial risk, we may gain more insights on firm behavior to understand ethnic differences between the two groups.
Most notably, the prior research on BBEs and minority-owned businesses seems to focus on three general areas: (a) psychological studies, (b) sociological and socioeconomic studies; and (c) economic studies. Considering the issues that some BBEs face, there have been some successful firms. Furthermore, a significant amount of the prior research on them has relied on government data or secondary data. Very few of the prior studies used primary data and often yielding generalized results that often supported the conventional wisdom on the vitality and survival of black-owned business enterprises. Furthermore, this leads to an incomplete picture of the underlying factors that influence the success and failure of BBEs.
The purpose of this study is to compare differences between black-owned business enterprises and white-owned business enterprises. This study examines the entrepreneurial and economic behavioral patterns between the two groups. This research has three primary objectives: (a) compare and contrast economic differences between BBEs and WBEs; (b) investigate and explore the firm idiosyncrasies between the two groups; and (c) examine and compare customer turnover analytics between the two groups to estimate profitability levels.
53
The paper is structured as follows. First, a review of the literature and prior research relevant to the study was compiled. Next, Section 2 discusses the hypotheses proposed for the study. Section 3 describes the sample, variables and data collection. Section 4 presents the conceptual model of the study. Section 5 presents the results and the statistical analyses of the data. Section 6 presents the discussion of the results, implications, and directions for the future research. Finally, the conclusion and summary are presented.
LITERATURE REVIEW AND PRIOR STUDIES
Prior Research on Black Businesses
A majority of the prior research on comparing black-owned business enterprises to white-owned business enterprises have been varied and mostly focusing on socioeconomic studies. Based on the literature there is a large body of the research has concluded that black-owned business enterprises have not as successful compared to white-owned business enterprises. The major of the prior research on comparing the black businesses with white businesses were three types: (a) psychological studies, that based on research on individual psychological characteristics comparing black businesses with white businesses; (b) sociological studies, that examined sociological factors that impacted successful operations of black businesses compared to white businesses; and (c) economic studies that focused on the economic characteristics of black businesses compared to white businesses (Hornaday & Hunnally, 1987). Also further studies have focused on inner city economic development and black entrepreneurship. Many of the black-owned business enterprises were limited to the inner city (ghetto) communities (Tabb, 1969). Other studies have examined the state of the inner cities and black entrepreneurship (Bates, 1973; Porter, 1995a; Porter, 1995b; Porter, 1995c; Simms & Allen, 1995; Butler, 1996; Boston, 1995; Fairlie & Robb, 2007). Some studies offered possible solutions to developing more black-owned business enterprises in the inner cities (Bates, 1973; Bates, 2006; Bates, 2006; Bates & Bradford, 2009; Bates, 2010).
with the number of years of formal education to some threshold. Furthermore, minority business survival was increased with the utilization of commercial bank financing to enter into business; and there is a slightly higher rate of survival for individuals who use a mix of debt and equity capital in business formation. The following hypothesis was developed from the preceding literature and prior research:
Hypothesis 1: There are differences between black-owned business enterprises (BBE) and white-owned business enterprises (WBE) in terms of individual demographics (age, marital status, and education level).
In another study, Bates (1990) concluded that Black enterprises have diversified and grown in size and scope, they have also had added many employees, most of whom have been African Americans, a profound difference from firms that are not owned by minorities. Furthermore, Blacks hire Blacks, while White owners employ a predominantly White workforce. In a follow up study, Bates (1994) reached similar conclusions.
Some of the research examined black-owned business enterprises over a course of time to measure firm survival. In longitudinal study, Boden and Headd (2002) concluded there were differences in firm survival based on race and gender ownership in dissolution rates and factors related to dissolution. Singh, Know and Crump (2008) asserted they found significant differences between the percentage of black and white nascent entrepreneurs, who recognized externally-stimulated versus internally-stimulated opportunities and their projected firm revenues. The following hypothesis was developed from the preceding literature and prior research:
Hypothesis 2: There are differences BBEs between WBEs in terms of firm demographics (length of business ownership, entity type, industry type, employee number, and capital investment).
Lastly, black nascent entrepreneurs were more likely to pursue externally-stimulated opportunities with significantly lower expected revenues than their white counterparts. Other studies have examined black businesses and minority economic development were notable research from Bates and Hester (1977), Ekanem (1992), Zajonc (2003), Handy (2008), Strang (2001), and Sonfield (2007).
Racial Barriers to Firm Existence
55
that limited their size and scope (Rodgers, Gent, Palumbo and Wall, 2001). Some of the prior research has also compared firm dynamics and survival chacteristics among subminority groups and genders (Moskowitz, 1983; Miles, 2013; Robb, 2002; Renzulli, 2009). The following hypothesis was developed from the preceding literature and prior research:
Hypothesis 3: There are differences BBEs between WBEs in terms of market behavior and entrepreneurial risk factors.
The prior research on economic development and employment segmented by ethnicity has been significant. An interesting fact concerning employment is that most of the nonminority-owned small businesses operating in large urban areas did not employ minorities. Even among the businesses physically located within minority communities, the majority of the workers in the nonminority small firms were white. However, Black-owned business enterprises, in contrast, relied largely on minority workers even when their firms were located outside of minority neighborhoods (Bates, 2006). In another study, Boyd (2006) found that geographical and occupational shifts reflect salient post World War II changes in race relations, most notably the decline of racial segregation in many areas of social life and the increase of opportunities for black entertainers to achieve distinction on a national level.
Another pivotal study on black-owned business enterprises compared to white-owned business enterprises was from Fairlie and Robb (2007). They concluded that based on estimates from the 1992 Characteristics of Business Owners (CBO) Survey indicated that: (a) black-owned firms have lower profits and sales, hire fewer employees, and are more likely to close than white-owned firms; (b) Secondly, black business owners are much less likely than white business owners to have had a self-employed family member owner prior to starting their business and are less likely to have worked in that family member’s business; (c) thirdly, black firms and white firms concentrate in different industries; black firms are underrepresented in construction, manufacturing, wholesale trade, agricultural services, finance, insurance, and real estate relative to white firms; and (d) lastly black firms are more concentrated in transportation, communications, public utilities, and personal services than white firms.
Financial and Capital Matters
In terms of financial activity, in terms of lending and venture capital, there differences between black and white businesses with lending policies with the Small Business Administration (SBA). Bates (1973) concluded that in general, for shorter-term loans from the New York SBA average black borrowers generating average levels of cash flow would receive larger loans than whites with identical loan applications. Black borrowers who were weaker than average will, in the absence of especially large cash flow, tended to receive smaller loans than identical firms owned by whites.
Furthermore, due to the fact that loan amount is quite sensitive to the level of a firm's cash flow, extremely weak black firms were considerably penalized and extremely strong. Black borrowers have considerably benefited relative to whites with comparable loan applications. Black business owners were more concerned about growth/expansion and capital as opposed to white business owners (Hornaday & Hunnally, 1987). Many minority-owned businesses and firms with limited access to capital were constrained in their ability to generate sales and production when compared to peer-firms within the same industry. Furthermore, minority firms were stronger in services industries but performed poorly in manufacturing industries such as production function based on measures of efficiency and productivity. This was due to a low level of productivity or possibly access to more fruitful markets and profitable business opportunities (Rodgers, Gent, Palumbo and Wall, 2001). The following hypothesis was developed from the preceding literature and prior research:
Hypothesis 4: There are differences BBEs between WBEs in terms of customer turnover analytics and customer behavior.
57 Hypothesis 5: There are differences BBEs between WBEs in terms of Entrepreneurial Risk Orientation (ERO) index levels.
Government Involvement and Issues
Government involvement has been a force in developing economic development in the inner cities and black-owned business enterprises. This is was most likely to be at the local, state and federal levels in being an agent in economic development. In most cases, cities with African American mayors were more conducive than other cities to African American economic development with regard to both the numbers and sales activity. Most notably, black mayoral incumbency and significant but not majority black political representation on city councils was most conducive to Black business numbers and level of activity (Hewitt et al. 1987).
Market entry barriers have been an influence on black-owned business enterprises. As an entry barrier, consumer discrimination was found to deter black firm entry in four industrial sectors identified in the Census Bureau’s 1992 Survey of Minority-Owned Business Enterprises (SMOBE). The results show that in 1992, consumer discrimination resulted in the lost of $5.6 billion dollars of black producers’ surplus (Price, 2005).
Criticisms of the Prior Research
One critical observation that was most apparent is the tendency of the prior research to utilize a significant amount of government agency data or secondary data. What was equally disturbing were some of the prior studies that used data sets that were nearly 10 years old. Thus, the prior research using secondary data seemed to maintain the accepted conventional beliefs about the failure or non-success of black business enterprises. Notably, very few prior studies collected primary data on black business enterprises. Another interesting observation is that some of the prior studies seemed to ignore e-business ventures or internet businesses, which tend to be ethnicity free or color neutral. Another interesting observation is the prior research does not take in consideration on data on black franchise owners. The research methodology for examining on black business-owned businesses and minority owned-businesses needs to be severely updated.
on black businesses; and thus add to the body of knowledge. Figure 1 illustrates the Literature Review Model:
FIG. 1 LITERATURE REVIEW MODEL
THEORETICAL FRAMEWORK AND CONCEPTUAL MODEL
Conceptual Model of the Study(s)
Figure 1 illustrates the conceptual model. The model illustrates that typically risk factors influence small business enterprises (BBEs and WBEs). The conceptual model proposes the entrepreneurial risk factors influence the BBEs and WBEs. Ethnicity is proposed as a moderating influence to the two groups. Lastly, the risk factors are measured, which determine the ERO index levels.
FIG. 2 CONCEPTUAL MODEL FRAMEWORK
Entrepreneurial Risk Factors
Black-owned Business Enterprises (BBE)
White-owned Business Enterprises (WBE)
Ethnicity
Entrepreneurial Risk Orientation (ERO) Index Levels Psychological,
Economic, and Sociological Studies
Government Involvement and Issues
Racial Barriers to Firm Existence Studies
59
Two models were used for both studies. The first model measured eight factors between black business enterprises (BBE) and white-owned business enterprises (WBE) in Study 1. For the Study 2, seven different factors were measured.
METHODOLOGY
The purpose of this study was to conduct a comparative analysis between black-owned business enterprises (BBE) with white-owned business enterprises (WBE). The objective of the study was to measure market behavior and firm behavior patterns based on economic and entrepreneurial risk constructs between the two groups. Based on the prior studies and literature review, the researcher wanted examine if there were differences between BBEs and WBEs. This study was built on a theoretical model developed on measuring economic behavior and market behavior of small business enterprises (SME).
Study 1 Model
ERO Index Levels = F1 + F2 + F3 + F4 + F5 + F6+ F7 + F8 Where
F1 = Factor 1: Industry/Economic Forces F2 = Factor 2: Terrorism/Security Dynamics F3 = Factor 3: Government/Market
F4 = Factor 4: Market Forces
F5 = Factor 5: Global/Economic Forces F6 = Factor 6: Internal Forces
F7 = Factor 7: Business Enterprise Intangibles F8 = Factor 8: Profit and Inflation
Study 2 Model
ERO Index Levels = F1 + F2 + F3 + F4 + F5 + F6+ F7 Where
F1 = Factor 1: Internal Enterprise Operations F2 = Factor 2: External Enterprise Operations F3 = Factor 3: Overhead Costs and Operations F4 = Factor 4: Government and Market
Sampling
This study took place over a three-year period from 2011 - 2014. Both Study 1 and Study 2 were conducted during this period. This study is a continuation of two prior studies on market and economic behavior patterns of SMEs (Miles, 2011); and economic patterns and gender differences with Black-owned business enterprises (Miles, 2013). The sample was drawn from a population of less than 30,000 small-to-medium businesses (SME) in the metropolitan area. The proportionate sample was based on estimated population of SMEs in the area. Participants were recruited from the local Bexar county and San Antonio metropolitan area. A total sample of 248 participants, which included Black-owned business enterprises (n = 112) and White-owned business enterprises (n = 136). For both studies, the researcher estimated that approximately 1,400 participants were solicited, which resulted in a response rate of about 18.0%. Participants selected were identified as black and white business owners from the local area from the surveys. In addition, the study required the respondents to be business owners and be in business at least one year or more. Lastly, the study used control variables such as age, marital status, and education level.
Sampling Frame and Data Collection
The sampling frame consisted of black-owned and white-owned business enterprises. This research utilized systematic random sampling to establish equal distribution from large, medium, SMEs. The researcher used the number of employees in the enterprise (500 or fewer) for qualifying businesses for inclusion in the study.
To test the hypotheses, data was collect through a researcher-developed survey. The study used a random sample from the businesses in the Yellow Pages Directory. Random phone calls to the participants were made from listings for both studies. The data was collected with the assistance of some governmental and non-profit agencies. Those agencies were the following: local Black Chamber of Commerce; Small Business Administration (SBA); local black business directory; Small Business Development Center (SBDC); Service Corps of Retired Executives (SCORE); Greater Chamber of Commerce; and Other local chambers of commerce.
61 Research Instruments
The Entrepreneurial Risk Survey (ERS). The scale developed by the researcher for the first study. ERS began as a pilot study for collecting data on entrepreneurial risk factors. It consists of a multidimensional scale design. It is a 32-item scale in order to identify and predict market behavior and risk patterns in business enterprises. ERS used a 5-point Likert scale (1 = Low risk to 5 = High risk). Of the 32 items in the survey instrument, 22 items were utilized to compute entrepreneurial risk and ERO index levels. Analyses were made through total scores obtained from the scale. The Entrepreneurial Risk Assessment Scale (ERAS). This scale was also developed by the researcher for the second study. It consists of a 37-item scale that identifies and predicts market behavior and risk patterns in SMEs. After further development of the pilot ERS instrument, three variables were added: (a) line of credit risk, (b) customer credit risk; and (c) economic risk. Analyses were made through total scores obtained from the scale. ERAS used a 5-point Likert Scale ranging from “1” Low risk variable to “5” high risk variable. Of the 37 items in the survey instrument, 25 items were utilized to assess entrepreneurial risk and ERO index levels.
Measures
Dependent Variables
For Study 1, the dependent variables are the factors and variables used for measuring market behavior and risk patterns in the data: Factor 1: Industry/Economic Forces; Factor 2: Terrorism/Security Dynamics; Factor 3: Government/Market Forces; Factor 4: Market Forces; Factor 5: Global/Economic Forces; Factor 6: Internal Forces; Factor 7: Business Enterprise Intangibles; and Factor 8: Profit and Inflation Forces.
For Study 2, the dependent variables are: Factor 1: Internal Enterprise Operations; Factor 2: External Enterprise Operations; Factor 3: Overhead Cost and Operations; Factor 4: Government and Market; Factor 5: Profit and Energy Factor; Factor 6: Globalization and Market and Factor 7: Economic Forces. For of hypotheses testing, these dependent variables were defined as a composite index composed of eight to seven indicators of market behavior and entrepreneurial risk. The combined composite ERO index provides a more robust test of hypotheses for both studies.
Independent Variables
independent variables were also used in the study (gender, business entity type, time length of business ownership and industry type, and capital investment amount). However, for the purposes of the study, ethnicity was the primary independent variable used for this comparative study.
Control Variables
Three control variables were used for this study: (a) age, (b) marital status, and (c) education level. To control the dynamics of the study, the black and white business owners were asked to consider all of the survey factors and items that can possibly influence their responses and decisions. The respondents were instructed to complete the survey based on the current state of their business enterprises. First, the control variables were an influence but not the focus in the study. Second, there were no dummy variables used for the study. There were other controlled variables included in the analyses. First, the size of the firm was controlled because firm size is based on the number of employees in the firm. Second, the group represents is controlled for the effect of group membership by ethnicity. Group is a dummy variable, with a “1” indicating membership in an ethnic Group 1: “Black” and “2” indicating membership in Group 2: “White.” Last, the researcher controlled for the age of the firm by including the time length of business ownership. The empirical analyses include descriptive statistics; mean and standard deviations comparisons and multivariate regression analysis are illustrated in the forthcoming tables and figures.
RESULTS OF THE STUDY
Data Analysis
The study employed a quantitative methodology. The data of the study were analyzed by means of an independent sample t-test and multivariate regression analysis. In multivariate regression analysis, the hypotheses were tested. The research design employed a two-step process to test the hypotheses. For step one, a descriptive statistical analysis was conducted for both studies. Descriptive statistics were used to measure frequency trends and percentage trends, and compare the scores. This was conducted on personal demographics and firm demographics.
63
both the ERS and ERAS instruments were analyzed using the SPSS ® Version 21.0 software. This was used for establishing central tendencies (mean, median, and mode) and developing the exploratory analysis, and data cleaning.
Descriptive Statistics
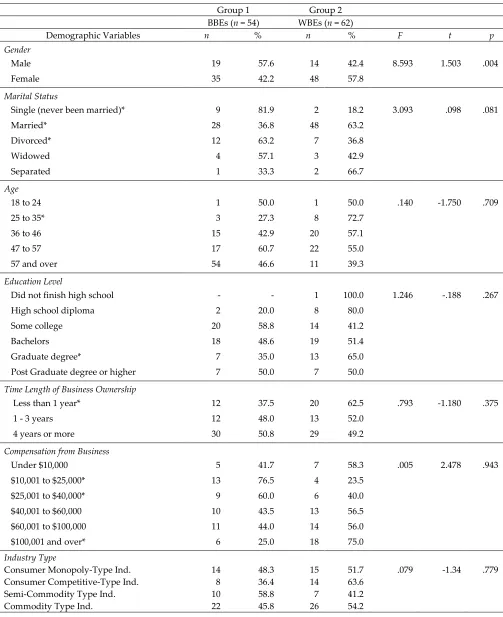
The descriptive statistics for demographics of the respondents are presented for both studies with Table 1 and Table 2. For Study 1, Table 1 displays a cross tabulation of the individual demographics with the BBEs and WBEs for Study 1. As indicated, the first column shows the descriptive of the customer turnover variables. The second column shows the two ethnic groups and the frequency and percentage of the respondents. The third column shows the F ratio. The next column shows the t-test ratio. Lastly, the remaining column shows the significance coefficient.
The hypotheses states there are differences between BBEs and WBEs in terms of individual demographics. Table 1 provides a cross-tabulation between ethnicity and the respondents in terms of personal demographics. There were some notable results. First, the results indicate that 63.2% of the BBEs were divorced compared to 36.8% of WBEs. Last, the results indicate that 35.0% of the BBEs had a graduate college degree compared to 65.0% of WBEs.
TABLE 1. STUDY 1 - COMPARATIVE MEANS AND STANDARD DEVIATIONS OF SMEs BY EHNICITY
Group 1 Group 2
BBEs (n = 54) WBEs (n = 62)
Demographic Variables n % n % F t p
Gender
Male 19 57.6 14 42.4 8.593 1.503 .004
Female 35 42.2 48 57.8
Marital Status
Single (never been married)* 9 81.9 2 18.2 3.093 .098 .081
Married* 28 36.8 48 63.2
Divorced* 12 63.2 7 36.8
Widowed 4 57.1 3 42.9
Separated 1 33.3 2 66.7
Age
18 to 24 1 50.0 1 50.0 .140 -1.750 .709
25 to 35* 3 27.3 8 72.7
36 to 46 15 42.9 20 57.1
47 to 57 17 60.7 22 55.0
57 and over 54 46.6 11 39.3
Education Level
Did not finish high school - - 1 100.0 1.246 -.188 .267
High school diploma 2 20.0 8 80.0
Some college 20 58.8 14 41.2
Bachelors 18 48.6 19 51.4
Graduate degree* 7 35.0 13 65.0
Post Graduate degree or higher 7 50.0 7 50.0 Time Length of Business Ownership
Less than 1 year* 12 37.5 20 62.5 .793 -1.180 .375
1 - 3 years 12 48.0 13 52.0
4 years or more 30 50.8 29 49.2
Compensation from Business
Under $10,000 5 41.7 7 58.3 .005 2.478 .943
$10,001 to $25,000* 13 76.5 4 23.5
$25,001 to $40,000* 9 60.0 6 40.0
$40,001 to $60,000 10 43.5 13 56.5
$60,001 to $100,000 11 44.0 14 56.0
$100,001 and over* 6 25.0 18 75.0
Industry Type
Consumer Monopoly-Type Ind. Consumer Competitive-Type Ind. Semi-Commodity Type Ind. Commodity Type Ind.
14 8 10 22 48.3 36.4 58.8 45.8 15 14 7 26 51.7 63.6 41.2 54.2
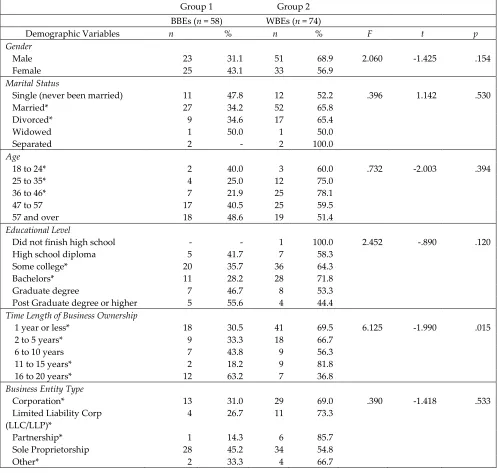
65 TABLE 2. STUDY 2 - COMPARATIVE MEANS AND STANDARD DEVIATIONS OF SMEs BY EHNICITY
Group 1 Group 2
BBEs (n = 58) WBEs (n = 74)
Demographic Variables n % n % F t p
Gender
Male 23 31.1 51 68.9 2.060 -1.425 .154
Female 25 43.1 33 56.9
Marital Status
Single (never been married) 11 47.8 12 52.2 .396 1.142 .530
Married* 27 34.2 52 65.8
Divorced* 9 34.6 17 65.4
Widowed 1 50.0 1 50.0
Separated 2 - 2 100.0
Age
18 to 24* 2 40.0 3 60.0 .732 -2.003 .394
25 to 35* 4 25.0 12 75.0
36 to 46* 7 21.9 25 78.1
47 to 57 17 40.5 25 59.5
57 and over 18 48.6 19 51.4
Educational Level
Did not finish high school - - 1 100.0 2.452 -.890 .120
High school diploma 5 41.7 7 58.3
Some college* 20 35.7 36 64.3
Bachelors* 11 28.2 28 71.8
Graduate degree 7 46.7 8 53.3
Post Graduate degree or higher 5 55.6 4 44.4 Time Length of Business Ownership
1 year or less* 18 30.5 41 69.5 6.125 -1.990 .015
2 to 5 years* 9 33.3 18 66.7
6 to 10 years 7 43.8 9 56.3
11 to 15 years* 2 18.2 9 81.8
16 to 20 years* 12 63.2 7 36.8
Business Entity Type
Corporation* 13 31.0 29 69.0 .390 -1.418 .533
Limited Liability Corp (LLC/LLP)*
4 26.7 11 73.3
Partnership* 1 14.3 6 85.7
Sole Proprietorship 28 45.2 34 54.8
Other* 2 33.3 4 66.7
Comparative Analyses of Means and Standard Deviations: Independent Sample t-Tests
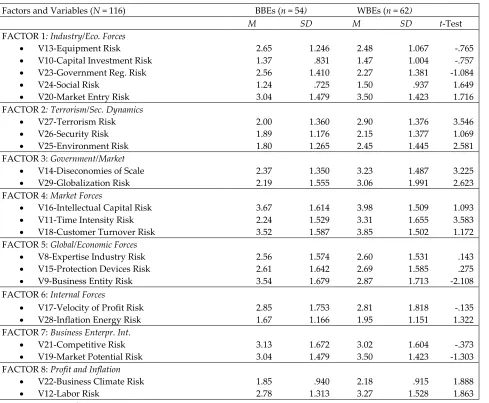
An independent sample t-Test was conducted for both studies to test the hypotheses in terms of market and economic behavioral differences between BBEs and WBEs. Tables 3 and 4 illustrate the results of market behavior and risk factors with BBEs for Study 1. As indicated, the tables illustrate the means and standard deviations, t-values, and degrees of freedom in the data. For Study 1, Table 3 illustrates the results of t-tests, BBE participants displayed similar factor means and standard deviations compared to WBEs. For example, Factor 5: Market Forces revealed similarities in means and standard deviations for BBEs (M = 8.71, SD = 4.895) and WBEs (M = 8.16, SD = 4.829). Overall, the t-tests means and standard deviations of both groups did not reveal any significant differences across the eight factors.
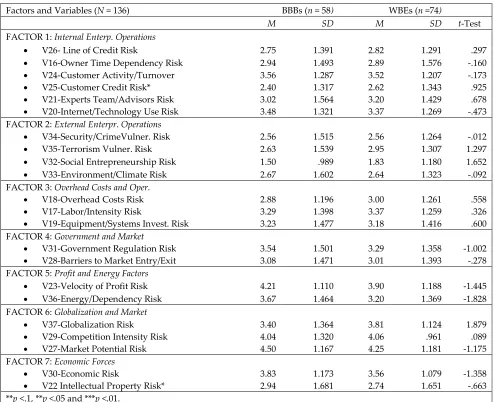
For Study 2, Table 4 illustrates the results of market behavior and risk scores with BBEs. The market behavior patterns and risk patterns of BBEs did not reveal any significant
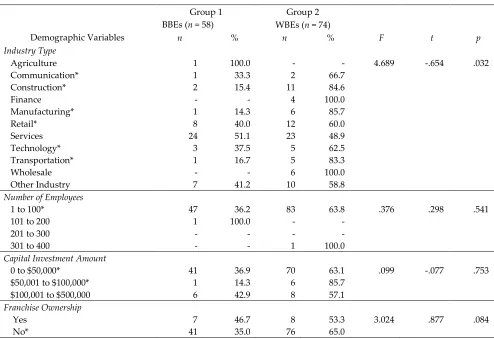
TABLE 2. STUDY 2 - COMPARATIVE MEANS AND STANDARD DEVIATIONS OF SMEs BY EHNICITY
Group 1 Group 2
BBEs (n = 58) WBEs (n = 74)
Demographic Variables n % n % F t p
Industry Type
Agriculture 1 100.0 - - 4.689 -.654 .032
Communication* 1 33.3 2 66.7
Construction* 2 15.4 11 84.6
Finance - - 4 100.0
Manufacturing* 1 14.3 6 85.7
Retail* 8 40.0 12 60.0
Services 24 51.1 23 48.9
Technology* 3 37.5 5 62.5
Transportation* 1 16.7 5 83.3
Wholesale - - 6 100.0
Other Industry 7 41.2 10 58.8
Number of Employees
1 to 100* 47 36.2 83 63.8 .376 .298 .541
101 to 200 1 100.0 - -
201 to 300 - - - -
301 to 400 - - 1 100.0
Capital Investment Amount
0 to $50,000* 41 36.9 70 63.1 .099 -.077 .753
$50,001 to $100,000* 1 14.3 6 85.7
$100,001 to $500,000 6 42.9 8 57.1
Franchise Ownership
Yes 7 46.7 8 53.3 3.024 .877 .084
67
differences compared to WBEs for Study 2. For example, Factor 2: External Enterprise Operations revealed similarities in means and standard deviations for BBEs (M = 9.36, SD = 5.645) and WBEs (M = 9.98, SD = 5.074). Overall, for both studies, the t-tests means and standard deviations of both groups did not reveal any significant differences across the seven factors. Thus, the hypothesis that BBEs are different from WBEs in terms of the means and standard deviation across seven and eight risk factors was not supported.
TABLE 3. STUDY 1 - COMPARATIVE FACTOR MEANS AND STANDARD DEVIATIONS OF SMEs BY ETHNICITY
Factors and Variables (N = 116) BBEs (n = 54) WBEs (n = 62)
M SD M SD t-Test
FACTOR 1: Industry/Eco. Forces
V13-Equipment Risk 2.65 1.246 2.48 1.067 -.765
V10-Capital Investment Risk 1.37 .831 1.47 1.004 -.757
V23-Government Reg. Risk 2.56 1.410 2.27 1.381 -1.084
V24-Social Risk 1.24 .725 1.50 .937 1.649
V20-Market Entry Risk 3.04 1.479 3.50 1.423 1.716
FACTOR 2: Terrorism/Sec. Dynamics
V27-Terrorism Risk 2.00 1.360 2.90 1.376 3.546
V26-Security Risk 1.89 1.176 2.15 1.377 1.069
V25-Environment Risk 1.80 1.265 2.45 1.445 2.581
FACTOR 3: Government/Market
V14-Diseconomies of Scale 2.37 1.350 3.23 1.487 3.225
V29-Globalization Risk 2.19 1.555 3.06 1.991 2.623
FACTOR 4: Market Forces
V16-Intellectual Capital Risk 3.67 1.614 3.98 1.509 1.093
V11-Time Intensity Risk 2.24 1.529 3.31 1.655 3.583
V18-Customer Turnover Risk 3.52 1.587 3.85 1.502 1.172
FACTOR 5: Global/Economic Forces
V8-Expertise Industry Risk 2.56 1.574 2.60 1.531 .143
V15-Protection Devices Risk 2.61 1.642 2.69 1.585 .275
V9-Business Entity Risk 3.54 1.679 2.87 1.713 -2.108
FACTOR 6: Internal Forces
V17-Velocity of Profit Risk 2.85 1.753 2.81 1.818 -.135
V28-Inflation Energy Risk 1.67 1.166 1.95 1.151 1.322
FACTOR 7: Business Enterpr. Int.
V21-Competitive Risk 3.13 1.672 3.02 1.604 -.373
V19-Market Potential Risk 3.04 1.479 3.50 1.423 -1.303
FACTOR 8: Profit and Inflation
V22-Business Climate Risk 1.85 .940 2.18 .915 1.888
V12-Labor Risk 2.78 1.313 3.27 1.528 1.863
TABLE 4. STUDY 2 - COMPARATIVE FACTOR MEANS AND STANDARD DEVIATIONS OF SMEs BY ETHNICITY
Results of the Multivariate Regression Analysis
To test the third hypothesis, a multivariate regression analysis was conducted to determine the effect of ethnicity on the dependent variables (factors and variables) as a predictor variable. Table 5 summarizes the results of the multivariate regression analysis for Study 1. As shown in the first column of Table 5, the control variables did explain a significant portion of variance in Factors 2, 3, and 4 (adjusted R² = .123; F = 5.27; p < .001). The multivariate regression results revealed that ethnicity was significant for Factor 2 (V27-Terrorism, p < .001), Factor 3(V14- Diseconomies of Scale, p < .002), and Factor 4 (V11-Time Intensity risk, p < .001). Ethnicity was not a significant predictor variable for entrepreneurial risk. Table 5 also presents the adjusted and unadjusted group means. The ethnicity of the entrepreneur was not negatively and insignificantly
Factors and Variables (N = 136) BBBs (n = 58) WBEs (n =74)
M SD M SD t-Test
FACTOR 1: Internal Enterp. Operations
V26- Line of Credit Risk 2.75 1.391 2.82 1.291 .297
V16-Owner Time Dependency Risk 2.94 1.493 2.89 1.576 -.160
V24-Customer Activity/Turnover 3.56 1.287 3.52 1.207 -.173
V25-Customer Credit Risk* 2.40 1.317 2.62 1.343 .925
V21-Experts Team/Advisors Risk 3.02 1.564 3.20 1.429 .678
V20-Internet/Technology Use Risk 3.48 1.321 3.37 1.269 -.473 FACTOR 2: External Enterpr. Operations
V34-Security/CrimeVulner. Risk 2.56 1.515 2.56 1.264 -.012
V35-Terrorism Vulner. Risk 2.63 1.539 2.95 1.307 1.297
V32-Social Entrepreneurship Risk 1.50 .989 1.83 1.180 1.652
V33-Environment/Climate Risk 2.67 1.602 2.64 1.323 -.092
FACTOR 3: Overhead Costs and Oper.
V18-Overhead Costs Risk 2.88 1.196 3.00 1.261 .558
V17-Labor/Intensity Risk 3.29 1.398 3.37 1.259 .326
V19-Equipment/Systems Invest. Risk 3.23 1.477 3.18 1.416 .600 FACTOR 4: Government and Market
V31-Government Regulation Risk 3.54 1.501 3.29 1.358 -1.002 V28-Barriers to Market Entry/Exit 3.08 1.471 3.01 1.393 -.278 FACTOR 5: Profit and Energy Factors
V23-Velocity of Profit Risk 4.21 1.110 3.90 1.188 -1.445
V36-Energy/Dependency Risk 3.67 1.464 3.20 1.369 -1.828
FACTOR 6: Globalization and Market
V37-Globalization Risk 3.40 1.364 3.81 1.124 1.879
V29-Competition Intensity Risk 4.04 1.320 4.06 .961 .089
V27-Market Potential Risk 4.50 1.167 4.25 1.181 -1.175
FACTOR 7: Economic Forces
V30-Economic Risk 3.83 1.173 3.56 1.079 -1.358
69
associated with entrepreneurial risk. For example, Factor 4: Market Forces revealed the following results the variable, Time Intensity (F = 12.839, R² = .101) (Δ R² = .093; p < .001).
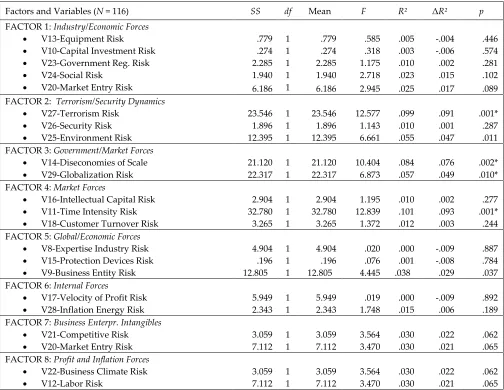
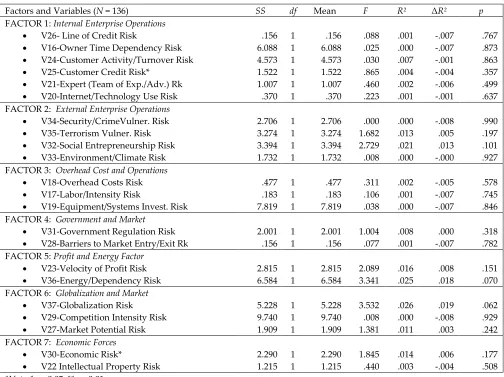
For Study 2, another multivariate regression analysis was conducted to determine the effect of ethnicity on the dependent variables (factors and variables) of market and economic variables. Table 6 summarizes the results of the multivariate regression analysis for Study 2. As shown in the first column of Table 6, the control variables did not explain a significant portion of variance in the Factors and variables (adjusted R² = .123; F = 5.27; p < .001). The multivariate regression results revealed that ethnicity was significant for Factors 1 to Factor 7. Ethnicity was not a significant predictor variable for entrepreneurial risk. The table also presents the adjusted and unadjusted group means. The ethnicity of the entrepreneur to the firm was not significantly associated with entrepreneurial risk. For example, Factor 1: Internal Enterprise Operation revealed the following results the variable, Customer Credit Risk (F = .865, R² = .004) (Δ R² = -.004; p < .357). Therefore, these results do not support the third hypothesis.
TABLE 5. STUDY 1 – MULTIVARIATE REGRESSION USING ETHNICITY AS PREDICTOR VARIABLE
Factors and Variables (N = 116) SS df Mean F R² ΔR² p
FACTOR 1: Industry/Economic Forces
V13-Equipment Risk .779 1 .779 .585 .005 -.004 .446
V10-Capital Investment Risk .274 1 .274 .318 .003 -.006 .574 V23-Government Reg. Risk 2.285 1 2.285 1.175 .010 .002 .281
V24-Social Risk 1.940 1 1.940 2.718 .023 .015 .102
V20-Market Entry Risk 6.186 1 6.186 2.945 .025 .017 .089
FACTOR 2: Terrorism/Security Dynamics
V27-Terrorism Risk 23.546 1 23.546 12.577 .099 .091 .001*
V26-Security Risk 1.896 1 1.896 1.143 .010 .001 .287
V25-Environment Risk 12.395 1 12.395 6.661 .055 .047 .011
FACTOR 3: Government/Market Forces
V14-Diseconomies of Scale 21.120 1 21.120 10.404 .084 .076 .002* V29-Globalization Risk 22.317 1 22.317 6.873 .057 .049 .010* FACTOR 4: Market Forces
V16-Intellectual Capital Risk 2.904 1 2.904 1.195 .010 .002 .277 V11-Time Intensity Risk 32.780 1 32.780 12.839 .101 .093 .001* V18-Customer Turnover Risk 3.265 1 3.265 1.372 .012 .003 .244 FACTOR 5: Global/Economic Forces
V8-Expertise Industry Risk 4.904 1 4.904 .020 .000 -.009 .887 V15-Protection Devices Risk .196 1 .196 .076 .001 -.008 .784 V9-Business Entity Risk 12.805 1 12.805 4.445 .038 .029 .037 FACTOR 6: Internal Forces
V17-Velocity of Profit Risk 5.949 1 5.949 .019 .000 -.009 .892 V28-Inflation Energy Risk 2.343 1 2.343 1.748 .015 .006 .189 FACTOR 7: Business Enterpr. Intangibles
V21-Competitive Risk 3.059 1 3.059 3.564 .030 .022 .062
V20-Market Entry Risk 7.112 1 7.112 3.470 .030 .021 .065
FACTOR 8: Profit and Inflation Forces
V22-Business Climate Risk 3.059 1 3.059 3.564 .030 .022 .062
V12-Labor Risk 7.112 1 7.112 3.470 .030 .021 .065
TABLE 6. STUDY 2- MULTIVARIATE REGRESSION USING ETHNICITY AS A PREDICTOR VARIABLE
Examining Customer Activity in Business Enterprises: Comparing Customer Turnover
Table 7 displays a cross-tabulation of the customer turnover variable with the BBEs and WBEs for Study 1. This metric was used to make estimation on the sales generated for the business enterprises. The profitability of the business enterprises was estimated due the lack of financial data that was available to the researcher. The hypotheses states there are differences between BBEs and WBEs in terms of customer turnover. The results indicate that BBEs (20.4%) had 20 or more customers per day; comparatively WBEs (16.1%) had a similar result. This was also similar with 5 or less customers or less. Thus, in terms of the customer turnover metric, the results of study indicate there were no significant differences between BBEs and WBEs.
Factors and Variables (N = 136) SS df Mean F R² ΔR² p
FACTOR 1: Internal Enterprise Operations
V26- Line of Credit Risk .156 1 .156 .088 .001 -.007 .767
V16-Owner Time Dependency Risk 6.088 1 6.088 .025 .000 -.007 .873 V24-Customer Activity/Turnover Risk 4.573 1 4.573 .030 .007 -.001 .863 V25-Customer Credit Risk* 1.522 1 1.522 .865 .004 -.004 .357 V21-Expert (Team of Exp./Adv.) Rk 1.007 1 1.007 .460 .002 -.006 .499 V20-Internet/Technology Use Risk .370 1 .370 .223 .001 -.001 .637 FACTOR 2: External Enterprise Operations
V34-Security/CrimeVulner. Risk 2.706 1 2.706 .000 .000 -.008 .990 V35-Terrorism Vulner. Risk 3.274 1 3.274 1.682 .013 .005 .197 V32-Social Entrepreneurship Risk 3.394 1 3.394 2.729 .021 .013 .101 V33-Environment/Climate Risk 1.732 1 1.732 .008 .000 -.000 .927 FACTOR 3: Overhead Cost and Operations
V18-Overhead Costs Risk .477 1 .477 .311 .002 -.005 .578
V17-Labor/Intensity Risk .183 1 .183 .106 .001 -.007 .745
V19-Equipment/Systems Invest. Risk 7.819 1 7.819 .038 .000 -.007 .846 FACTOR 4: Government and Market
V31-Government Regulation Risk 2.001 1 2.001 1.004 .008 .000 .318 V28-Barriers to Market Entry/Exit Rk .156 1 .156 .077 .001 -.007 .782 FACTOR 5: Profit and Energy Factor
V23-Velocity of Profit Risk 2.815 1 2.815 2.089 .016 .008 .151 V36-Energy/Dependency Risk 6.584 1 6.584 3.341 .025 .018 .070 FACTOR 6: Globalization and Market
V37-Globalization Risk 5.228 1 5.228 3.532 .026 .019 .062
V29-Competition Intensity Risk 9.740 1 9.740 .008 .000 -.008 .929 V27-Market Potential Risk 1.909 1 1.909 1.381 .011 .003 .242 FACTOR 7: Economic Forces
V30-Economic Risk* 2.290 1 2.290 1.845 .014 .006 .177
71
TABLE 7. STUDY 1 – COMPARING CUSTOMER TURNOVER METRIC BETWEEN BBEs AND WBEs
Results of ERO Index Level Scores for BBEs and WBEs
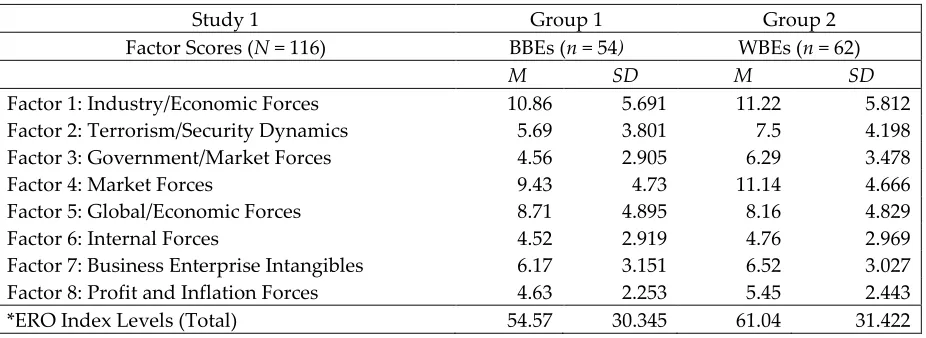
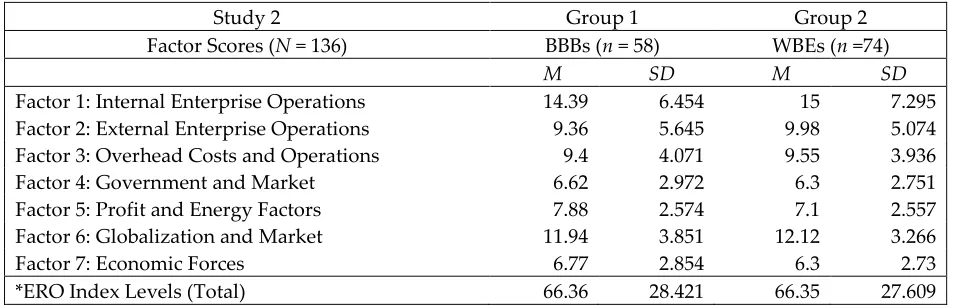
Table 8 illustrates the results of ERO index scores between the two groups for Study 1. Based on the results, BBEs did display significantly lower ERO index level (M = 54.57, SD = 30.345) compared to WBEs (M = 61.04, SD = 31.422). The results indicate that BBEs have a lower total ERO index level compared to WBEs. Overall, BBEs are slightly less risky than WBEs (or BBEs are slightly higher in risk factor coefficients). However, it is noteworthy that the means in both conditions were quite low given that the scale ranged from 0 to 5. In addition, Table 9 illustrates the results of ERO index scores between the two groups for Study 2. Based on the results, there ERO index levels for the BBEs (M = 66.36, SD = 28.421) compared to WBEs (M = 66.35, SD = 27.609) were even. The results indicate there were not any significant differences between both groups in terms of ERO index levels.
TABLE 8. STUDY 1 – RESULTS OF ERO INDEX LEVEL SCORES FOR ETHNIC GROUPS Group 1 Group 2
BBEs (n = 54) WBEs (n = 62) (N = 116)
Customer Turnover n % n % F t p
20 or more customers per day* 11 20.4 10 16.1 .787 1.172 .377 15 customers or less per day* 3 5.6 1 1.6
Neutral or unknown 11 20.4 11 17.7 10 or less customers per day 5 9.3 6 9.7 5 or less customers per day* 24 44.4 34 54.8
Total 54 100.0 62 100.0
Study 1 Group 1 Group 2
Factor Scores (N = 116) BBEs (n = 54) WBEs (n = 62)
M SD M SD
TABLE 9. STUDY 2 – RESULTS OF ERO INDEX LEVEL SCORES FOR ETHNIC GROUPS
DISCUSSION
A comparative analysis of small business enterprises (SME) was conducted to get insights into understanding economic differences between black-owned business enterprises (BBE) and white-owned business enterprises (WBE). This study examines the entrepreneurial and economic behavioral patterns between the two groups. The findings reported in this research suggest that ethnicity and race does not play a major factor in entrepreneurial risk and success. However, the degree of its role in the success or risk factors with black-owned business enterprises is questionable. The majority of the prior research on BBEs has provided some compelling evidence that ethnicity has been a pivotal issue as a basis for their success. However, the majority of the prior research on BBEs has been somewhat negative, dismal and a self-fulfilling prophecy on the likelihood of their success and survival.
According to much of the prior research, it is apparent there are some consistent differences between BBEs and WBEs. The central focus on these differences were along the lines of socio economic issues and most apparent, the issue of race. However, the results of our research reveal that BBEs were not much different from WBEs in terms of firm characteristics. There were minor but not significant differences between the two groups. Furthermore, we also found that BBEs were just as competitive as WBEs. Lastly, we observed the hypothesized relationships between ethnicity and entrepreneurial risk patterns were not significant. We examined these risk factors and patterns in both studies and used ethnicity as construct for the basis of the research. Based on the results of both studies, there were consistent results that indicated that BBEs were not that different compared to WBEs in terms of firm risk factors and market behavior.
Study 2 Group 1 Group 2
Factor Scores (N = 136) BBBs (n = 58) WBEs (n =74)
M SD M SD
Factor 1: Internal Enterprise Operations 14.39 6.454 15 7.295 Factor 2: External Enterprise Operations 9.36 5.645 9.98 5.074 Factor 3: Overhead Costs and Operations 9.4 4.071 9.55 3.936 Factor 4: Government and Market 6.62 2.972 6.3 2.751 Factor 5: Profit and Energy Factors 7.88 2.574 7.1 2.557 Factor 6: Globalization and Market 11.94 3.851 12.12 3.266
Factor 7: Economic Forces 6.77 2.854 6.3 2.73
73
A series of hypotheses were tested comparing market behavior and entrepreneurial risk patterns of BBEs and WBEs. The first hypothesis suggests there are differences between black-owned business enterprises (BBE) and white-owned business enterprises (WBE) in terms of individual demographics. Based on the results of our study, we discovered there were some differences between BBEs and WBEs. In Study 1, the results of the analyses revealed that: (a) black business owners were least likely to be married compared to white business owners; (b) BBEs were twice as likely to be divorced compared to WBEs; and (c) BBEs were equally likely to be as college educated as WBEs. However for Study 2, the results revealed: (a) the statistics on the marital status rates and divorce rates on both groups were consistent with the results of Study 1; and (b) for education, BBEs were least likely to have a bachelors degree compared to WBEs; however, BBEs were equally likely to have a graduate and post graduate degree compared to WBEs. Support for our first hypothesis is in line with Christopher (1989) similarly concluded the probability of minority business survival is increased with the number of years of formal education to some threshold. Based on the results of the study, the hypotheses can be marginally supported.
The third hypothesis suggests there were differences BBEs between WBEs in terms of firm characteristics. Multivariate regression analyses were conducted on both studies to determine the relationship between ethnicity and entrepreneurial risk factors. The objective of the multivariate analyses is to identify which entrepreneurial risk factors are significant and then compare them across the two ethnic groups. The results of the Study 1 revealed: (a) the independent sample t-test revealed there were minimal differences between BBEs and WBEs in terms of the eight entrepreneurial risk factors between the two groups; (b) the multivariate regression analyses revealed that were no significant differences between the two groups in terms of the eight entrepreneurial risk factors; and (c) only three factor variables indicated any significant differences between the two groups; those variables were terrorism risk, diseconomies of scale, globalization and time intensity risk. For Study 2, the results of the study were consistent with Study 1. As of a result, the third hypothesis could not be supported.
The fourth hypothesis suggests there were no differences BBEs between WBEs in terms of customer turnover analytics. The results of Study 1 revealed there were no significant differences between the two groups in terms of customer turnover analytics. For example, BBEs were equally like to have 20 customers or more per day compared to WBEs. There were no significant differences between the two groups. Therefore, the hypothesis could not be supported.
75
TABLE 10. SUMMARY OF HYPOTHESES TEST
CONCLUSIONS AND CRITICAL OBSERVATIONS
The study focused on a comparative study of black-owned business enterprises (BBE) and white-owned business enterprises (WBE). This study examined economic behavior and market behavior between the two groups. This research is based on two studies conducted on both groups that examined seven to eight entrepreneurial risk factors. This study used multivariate regression analyses of the risk factors to conduct comparative analyses of the two groups. The study extends the previous research on BBEs and the influence on entrepreneurial risk factors on firms’ vulnerability to business failure.
The study tested five hypotheses related to the individual demographics, firm characteristics, and risk factors linked to the literature. The results of the study reveal there were some important findings. First, there were consistent differences between BBEs and WBEs in terms of individual demographics, such as marital status, education, and divorce rates. Second, there were consistent differences between BBEs and WBEs in terms of firm characteristics such as industry type, franchise ownership, capital investment, employee size and length of business ownership. Most of these firm differences favored BBEs compared to WBEs. Third, most interestingly there were minimal differences between BBEs and WBEs in terms of the seven and eight entrepreneurial risk factors. The data did not reveal any significant differences between the two groups. Fourth, there were minimal differences between BBEs and WBEs in terms of the seven and eight entrepreneurial risk factors. The customer turnover rates
Hypotheses Measure Used Supported? Study 1
H1: Differences in individual demographics. t-test/crosstabs *Yes H2: Differences in firm demographics. t-test/crosstabs Yes H3: Differences in market behavior/risk factors. regression analysis No H4: Differences in customer turnover analytics. t-test/crosstabs No H5: Differences in ERO Index Levels. t-test/crosstabs No Study 2
within the firms for both groups were similar. BBEs had equal customer turnover analytics compared to WBEs. Last, there were significant differences between the two groups in terms of ERO index levels that measure entrepreneurial risk.
One clear implication is that BBEs are not that different from WBEs. A second observation is that BBEs were not as bad off as some of the prior research suggests. BBEs are equally likely to have success and profitability compared to WBEs despite the influence of ethnicity and race as an impediment. The results of our study refine and reframe the common perception that BBEs are less profitable and not as successful. Another observation is that BBEs are just as competitive and respond to the same number of ER risk factors compared to WBEs. Therefore, BBEs face similar market forces and ethnicity does not play an integral role as much as the prior research infers. Furthermore, a major flaw with some of the prior research has been the overreliance of government and secondary data. As researchers, maybe we can help solve some of their problems.
In conclusion, the results of our study make a contribution to the field of study. First, this study opens a new inquiry on comparative research on BBEs and SMEs by examining firm dynamics. Second, this study extends the prior research on BBEs by using entrepreneurial risk factors as a basis for examining economic risk patterns and economic behavior. Based on the results of our research, this study will provide a vehicle for examining SMEs and the role of ethnicity and race in the context of economic behavior. This study is one of the few studies in the literature that compares the economic behavior and risk patterns along ethnic and racial lines. This study also makes a comparative analysis along economic and market forces. Another major contribution of this study is that it challenges the conventional wisdom on the success and survival of BBEs. This study provides strong empirical support to challenge some of the prior research on BBEs and their success and economic behavior.
LIMITATIONS
This study had some limitations. First, all the survey data collected for the study was reported. As a limitation, this could be subject to some bias. The risk in using self-reported data is always the possibility of respondent bias. There could be challenges because of the data being biased. However, we minimized the issue of bias by the survey designs and questionnaire construction.
77
However, we did provide information on capital investment size and customer turnover analytics. Therefore, we could approximate some of limited financial information on both groups.
Last, geographic constraints were a limitation. Because this study used primary data as opposed to secondary data, there were time constraints and geographic limitations. However, the results of this study may support generalizations to populations beyond the scope of this sample or similar demographic characteristic. Despite these limitations, this study represents one of the most comprehensive comparative analyses on black-owned business enterprises (BBE) and white-black-owned business enterprises (WBE). This study makes an important contribution and thus highlights SMEs’ differences and similarities along the ethnic and economic lines.
FUTURERESEARCH
There are a wealth of opportunities for future research on BBEs in terms of economic pattern analysis, market behavior, and entrepreneurial risk. First, future research should continue to refine the economic factors to examine more firm dynamics on BBEs. For example, one possible inquiry of exploration would be to explain how personal demographics such as marital and divorce rates affect economic behavior and entrepreneurial success for comparing BBEs to WBEs. Furthermore, future research could explore the various ways in which market behavior, economic dynamics, and ethnicity influence business success and survival.
Second, future research could analyze economic patterns in detail and beyond governmental data. For example, future research can be extensive in examining economic patterns such as market entry barriers, market saturation, and competition more extensively on BBEs and WBEs. To exploit this future research opportunity, perhaps examining economic patterns in the capacity of a longitudinal study would be an optimal approach.
REFERENCES
Auster, E. R. (1988). Owner and organizational characteristics of black- and white-owned businesses: Self-Employed blacks had less training, fewer resources, less profits,but had similar survival rates, American Journal of Economics & Sociology, 47(3), 331-344.
Bates, T. & Bradford, W. (2009). The impact of institutional sources of capital upon the
minority-oriented venture capital industry, Small Business Economics, 33(4), 485-496.
Bates, T. (2010). Alleviating the financial capital barriers impeding business development in inner cities, Journal of the American Planning Association, 76(3), 349-362.
Bates, T. (2006). The urban development potential of black-owned business enterprises, Journal of The American Planning Association, 72(2), 227-237.
Bates, T. & Bradford, W. (2004). Analysis of venture-capital funds that finance minority-owned businesses, The Review of Black Political Economy/Summer 2004, 37-49.
Bates, T. & Williams, D. (1995). Preferential procurement programs and minority‐owned businesses, Journal of Urban Affairs, 17(1), 1-17.
Bates, T. & Williams, D. (1996). Do preferential procurement programs benefit minority business? The American Economic Review, 86(2), 294-297.
Bates, T. (1994). Utilization of minority employees in small business: A comparison of
nonminority and black-owned, Review Of Black Political Economy, 23(1), 113.
Bates, T. (1973). An Econometric Analysis of Lending To Black Businessmen, Review of Economics & Statistics, 55(3), 272.
Boden, R. J. & Headd, B. (2002). Race and gender differences in business ownership and
business turnover, Business Economics, 37(4), 61.
Boston, T. D. (1995). Characteristics of black-owned corporations in Atlanta: With comments on the SMOBE undercount, Review of Black Political Economy, 23(4), 85.
Boyd, R. L. (2006). Transformation of the black business elite, Social Science Quarterly, 87(3), 602-617.
Butler, J. S. (1996). Entrepreneurship and the advantages of the inner city: How to augment the Porter Thesis. Review of Black Political Economy, 24(2/3), 39-49.
Butler, J. S., (1999). Race self-employment & upward mobility: An elusive American dream, Small Business Economics, 12(2), 183-188.
79
Coleman, S. (2007). The use of debt by black-owned firms: Recent evidence from the 2003 survey of small business finances, Journal of Developmental Entrepreneurship, 13(1), 39-57.
Ekanem, N. (1992). Determinants of minority business formation: a detailed industry analysis, Applied Economics, 24(10), 1147.
Fairlie, R. W. & Meyer, B.D. (2003). The effect of immigration on native self-employment, Journal of Labor Economics, 21(3), 619-650.
Fairlie, R. W. & Robb, A. M. (2009). Gender differences in business performance: evidence from the characteristics of business owners survey, Small Business Economics, 33(4), 375-395.
Fairlie, R. W. & Robb, A. M. (2007). Why are black-owned business enterprises less successful than white-owned business enterprises? The Role of Families, Inheritances, and Business Human Capital, Journal of Labor Economics, 25(2), 289-323.
Handy, J. (2008). The emergence of the black economic research center and the review of black political economy: 1969-1972, Review of Black Political Economy, 35(4), 75-89.
Hornaday, R. W., & Nunnally Jr., B. H. (1987). Problems facing black-owned business enterprises, Business Forum, 12(4), 34.
Köllinger, P. P. & Minniti, M. M. (2006). Not for lack of trying: American entrepreneurship in Black and White. Small Business Economics, 27(1), 59-79.
Miles, D. A. (2013). Research in economics, ethnicity and gender: A comparative study on Black female-owned and Black Male-owned business enterprises, Global Business and Economics Research Journal, 2(4): pp. 1-23.
Miles, D. A. (2011). Assessing Business Risk: Development of the Entrepreneurial Risk Assessment Scale, University of the Incarnate Word, ProQuest Dissertations and Theses.
Moskowitz, M. R. (1983). Company performance roundup, Business & Society Review 45.
Porter, M. (1995a). An economic strategy for America’s inner cities: addressing the controversy, Review of Black Political Economy, 24(2/3), 303.
Porter, M. (1995b). The competitive advantage of the inner city, Harvard Business Review, 14, 57.
Price, G. N. (2005). Consumer discrimination and black firm entry deterrence: some reparable damage estimates, Review of Black Political Economy, 32(3/4), 121-139.
Renzulli, L. (2009). Race and entrepreneurial success: Black-asian- and white-Owned business in the United States. Administrative Science Quarterly, 54(3), 531-532.
Robb, A. M. (2002). Entrepreneurial performance by women and minorities: The case of new firms, Journal of Developmental Entrepreneurship, 7(4), 83.
Rogers, C. D., Gent, M. J., Palumbo, G. M. & Wall, R. A. (2001). Understanding the growth and viability of inner city businesses, Journal of Developmental Entrepreneurship, 6(3), 237.
Simms, M. C. & Allen, W. J. (1995). Is the inner city competitive? Review of Black Political Economy, 24(2/3), 213.
Singh, R., Knox, E. & Crump, M. (2008). Opportunity recognition differences between black and white nascent entrepreneurs: A test of Bhave’s Model. Journal of Developmental Entrepreneurship, 13(1), 59-75.
Sonfield, M. (2007). America’s largest black-owned companies: A 30-year longitudinal analysis, Journal of Developmental Entrepreneurship 12(3), 323–338.
Strang, W. A. (1977). The mix of black business: implications for growth, Business Horizons, 20(6), 62.
Tabb, W. K. (1970). Perspectives on black economic development, Journal of Economic Issues, 4(4), 68.