Purchased by the U. S. Department of Agriculture For Official Use
Reprinted from the Soil Science Society of America Proceedings Vol. 32, no. 5, September—October
RON W. RICKMAN 2
ABSTRACT
Current-voltage curves determined with tips of platinum electrodes touching a solution surface were used to evaluate the effect of solution electrical conductivity and specific ions on measurements of oxygen diffusion rates in unsaturated soil. Current was found to be dependent upon electrical conductiv-ity in pure monovalent cation solutions. In divalent cation solutions, or mixed monovalent-divalent cation solutions, cur-rent was only slightly affected by electrical conductivity of the solution. The presence of divalent cations caused a lower measured current with identical solution-electrode geometry and measured electrode potential than when only monovalent ions were in solution. Based upon the assumption that these determinations reflect at least the magnitude of such phe-nomena that occur in soils, conditions are described under which the platinum electrode should operate most satisfactorily cr have a minimum interference from salt.
Additional Key Words for Indexing; salt interference, unsatu-rated media, platinum microelectrode.
B
om VAN DOREN and Erickson (9) and Birkle et al.
(1) found that electrical conductivity (EC) of solu-tions and clay suspensions had no effect on oxygen diffu-sion rate (ODR) measurements. Gradwell (2) found no difference between measured ODR's in unsaturated aggre-gates of silt loam wet with distilled water or with 0.1N KCI.
For field determinations, however, workers have found that electrical resistance through the soil, which is largely determined by EC of the soil solution, does influence ODR Contribution from the Soil & Water Conservation Research Division, ARS, USDA; in cooperation with the Nevada Agr. Exp. Sta. Approved by University of Nevada as Journal Series no. 81. Received Mar. 15, 1968. Approved Mar. 15, 1968.
Research Soil Scientist, USDA, ARS, Soil & Water Conserv. Res. Div., formerly University of Nevada, Agr. Exp. Sta., Reno, Nevada; presently Snake River Conservation Research Center, Kimberly, Idaho.
measurement. For example, Kristensen (3) has prepared a figure from which measured currents can be corrected to a standard electrode potential. McIntyre (8) has also empha-sized the importance of knowing actual electrode potential rather than applied potential during an ODR measurement. The actual potential of an electrode can be calculated by correcting the applied potential for voltage drops across resistances in the ODR measuring system. It can also be measured directly for individual electrodes by using a vac-uum tube volt meter (VTVM) and an independent refer-ence electrode. An improved design of the oxygen diffusion meter would provide automatic applied potential adjust-ment based on such a direct measureadjust-ment of electrode potential as obtained in quality laboratory polarographs. The potential field around an electrode in a soil wet with a solution of low conductivity has a larger gradient than it would in the presence of a soil solution of higher con-ductivity. An electrode in a low conductivity soil solution will affect the potential of a larger volume around it than will an electrode in a soil solution of higher conductivity. The potential difference between the electrode and the solution immediately adjacent to it (which is the actual potential of the electrode as far as reduction of oxygen is concerned) will, therefore, be less than that measured with a VTVM and an independent reference cell unless the ref-erence cell is located in the solution immediately adjacent to the electrode. Since the reference cell cannot practically be placed that close to an electrode for ODR measurement,
it is necessary to determine the magnitude of the solution conductivity effects on ODR currents when using measured "actual" electrode potentials.
RICKMAN: OXYGEN DIFFUSION RATE MEASUREMENTS 619 A study of the operation of platinum electrodes in
un-saturated media is complicated by the lack of a reproduc-ible standard unsaturated media. The geometry of the electrode-soil-soil solution contact is not the same for any two measurements in different locations within a soil sam-ple. Successive measurements at one location are suspect because of possible electrode "poisoning" (chemical change of the electrode surface or physical coating of parts of the electrode). A reproducible medium that would approxi-mate the conditions to which an electrode is exposed in an unsaturated soil was sought to replace the unsaturated soil and so remove the uncontrollable variability associated with it.
There is reason to believe that the current flowing through an electrode that is only partly immersed in a salt solution will be controlled by the same factors that control the current flowing through an electrode in an unsaturated medium. McIntyre (8) maintains that the migration of ions in water films on the electrodes in unsaturated soils will change the actual potential of the electrode surface. This same phenomenon is proposed by Will (10) as the factor causing local surface potential of a partially immersed elec-trode to approach zero above a solution meniscus. Al-though Will (10) was speaking of the oxidation of hydrogen on platinum, the same physical processes—(i) diffusion of an uncharged gas molecule through solution to an elec-trode where it reacts, and (ii) movement of charged ions in solution away from the electrode—must occur in the reduction of oxygen. Maget and Roethlein (6) studied the reduction of oxygen on platinum in sulfuric acid. They also indicate that the unsubmerged portion of a partially immersed electrode has a near zero polarization potential because of the migration of ions parallel to its surface. As McIntyre (7) has pointed out, ions must move parallel to an electrode surface to points of contact with soil particles in unsaturated soils in order to conduct current from an electrode to the soil.
If similar processes do control the relation between cur-rent and voltage of a platinum electrode in an unsaturated soil and when partially immersed in a solution, then the partially immersed electrode may be used to study factors that influence current in unsaturated soils.
The experiments reported in this paper attempted to demonstrate the similarity of conditions discussed imme-diately above and use partially immersed electrodes to establish the magnitude of the effect of solution electrical conductivity and specific cations on ODR measurements taken in unsaturated media, using measured electrode potential.
PROCEDURE
ODR measurements were taken with an applied potential of —0.65 volts vs. Ag-AgCl in saturated KCl in sand samples located on a tension table. The sand samples were wet with different salt solutions of various conductivities. Plastic sheet-ing covered the surface of each tension table to minimize evaporation.
The sand was held in acrylic plastic cylinders 15.2 cm (6 inches) in diameter and 6.4 cm (21/2 inches) high. A lid for each cylinder had holes for 10 electrodes and two reference
cells. A small bolt was located near each electrode hole to allow electrode leads to be held securely once the electrodes were installed. Electrical contact was made to the bolts in the con-tainer lid so the electrodes were not moved when leads were connected and disconnected. The 6-mm-long, 25-gauge elec-trodes were left undisturbed in the sand for up to 4 weeks.
In one experiment, two tension tables were used. After the experiment, electrical conductivity of the solution was 3.1 mmho cm-1 in the one wet with tap water and 70 mmho cm-1
in the one wet with NaCI solution. Electrodes were installed in saturated samples. Daily ODR measurements were made as the water tables were lowered in various steps.
Current-voltage curves were determined on electrodes in the sand samples. Voltage was applied in 0.1-volt steps at 1-min intervals from an ODR meter (5). The voltage of each elec-trode was monitored with a Simpson3 Model 312 VTVM vs an independent Ag•AgC1 in saturated KC1 fiber junction refer-ence cell: Measured electrode voltage, not applied voltage, was plotted against measured current. Current was recorded on a Sargent Model SR recorder that was driven by a Keithley Model 61013 electrometer. The electrometer was in series with the electrode of interest.
Setting up the tension tables for each salt solution was time-consuming, and numerous measurements were necessary to establish a representative curve for each salt. Therefore, a more rapid technique was sought for finding the information desired in a system simulating the conditions in an unsaturated soil. For this purpose, the same current and voltage measuring systems were used to determine current-voltage curves on electrodes with only their tips touching a salt solution surface.
The reference cell used for the measurements was in direct contact with the solution. An anode contacted the solution through an agar-filled salt bridge. Salt solutions of Na+, Kt, Ca2+, and Mg2+ Cl- and SO42-, and NaHCO3, with conductivi-ties ranging from 0.1 to 100 mmho cm-1 were used for these measurements. Current at given measured electrode potential was plotted vs. solution conductivity for each salt. A capillary tip reference cell made from drawn glass tubing was used to measure electrode potential as a function of distance from an electrode. All measurements were made in a room with maxi-mum temperature fluctuation of 3C.
RESULTS
ODR measurements in two sand samples wet with tap water or NaCI solution (made up with tap water) provided only an indication of possible differences between results in the two media. In Fig. 1 is shown the average ODR from 10 electrodes for each sample. Measured ODR values appear greater in the salt solution sample than in the tap water sample at 24 cm of H 2O tension.
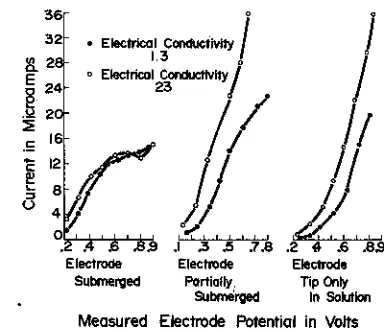
In Fig. 2 is shown a series of current-voltage (i-v) curves taken with one electrode submerged in, partially sub-merged in, and with only its tip touching a K 2SO4 solution. As less of an electrode was submerged, the i-v curve lost its diffusion plateau." The i-v curves of partially submerged electrodes and those with only their tip touching the solu-tion are similar in shape to the i-v curves found in unsaturated soils.
The i-v curves from submerged electrodes could be reproduced within 5% at will, Those from a partially sub-merged electrode or one with its tip only touching the solu-tion could be reproduced within 20% with a single
• Salutiir Electrical CcriductIvily•70
• Sali.rtiola EleCtrical Conductivity Nal
Month and Day
rig. 1—Oxygen diffusion rate and tension in a medium sand wet with tap water and NaC1 solution.
electrode. Different electrodes that were apparently equally immersed in the same solution would yield currents that were different by as much as a factor of 3 depending on the pretreatment history of the electrodes.
In Fig. 3 is shown the results of several solution meas-urements from similarly pretreated electrodes with only their tips touching the solutions. Current for NaC1 is typical of currents that were obtained for all monovalent cation salt solutions, and current for CaCl 2 is typical of those taken from curves made for divalent cation salt solutions. There was an increase in current with increasing EC in the monovalent cation salts up to an EC of about 10. Above an EC of 10, current changed little with increasing con-ductivity. A monovalent cation associated with a divalent anion (such as Na2SO4 which was used for Fig. 3) caused a smaller change i.n current with increased conductivity than when a monovalent anion was present, and the con-ductivity above which no increase in current occurred was
• itsCL
X 6 2 S °11
+ 1:5--CACQ:NACL
Ih. 1:1--i . CL2:NACL • CACL2
Al ..n
--x
;
_ _
_ + ---1
0
---nn,,,,,,,,..____________,----+
.3 1 3 It 30 100
Electrical conductivity in rnmho
Fig. 3—Current from a platinum electrode just touching salt solutions of various electrical conduc1ivities. The ratio of salts is in terms of equivalents.
• Elect/ice' Conductivity /
.3
• Electrical CcciductivIty/
23
12
L- 8
.713 .2 4 6
Electrode Electrode
Partially. Tip Only
Submerged In Solation Measured Electrode Potential in Volts
Fig. 2—Current-voltage curves from a platinum electrode just
touching, half submerged in, and submerged in K2SO4 solution.
lower. For the divalent cation salts there was little change in current with increasing salt concentration. Current was lower at any EC with a divalent cation solution than with a monovalent cation solution with the same measured electrode potentials and solution geometry around the electrodes.
Mixtures of monovalent and divalent cations yielded currents between the values obtained in a pure solution of either salt. Only a small percentage of divalent ions caused a major depression of measured current.
The addition of clay to a solution had little or no effect on the influence of the monovalent or divalent ions. In Fig. 4, currents measured in 0.1N KC1 or CaC12 clay suspensions are illustrated. When the electrodes were sub-merged, there were no specific salt effects on the
measure-22
• Electrode In 3% Bentonite. 0.1 N in KCL
• Electrode in 3% Bentonite. 0.1 N In CAcI.2
Electrode Tip Only
In Suspension 16
a
E12
Electrode Submerged
8
-.2 -.4 -6 .59 -1 -1.2
Measured Electrode Potential in Volts vs. Ag-AgCI in sat. KCL reference cell
Fig. 4—Current-voltage curves from an electrode just touching and submerged in 2% clay suspensions which were 0.1N
in ICC1 or CaCl2.
CZ
.0
IA
y
L
3
2
16 •_
36
32
2. 2
E
g 22
4
.8.9 Electrode
Submerged
18
14
RICKMAN: OXYGEN DIFFUSION RATE MEASUREMENTS 621
z
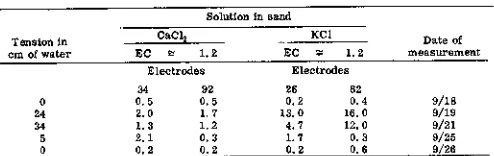
Table 1—Minus 0.65-volt current in microamps from current-voltage curves taken with undisturbed electrodes in
medium sand on a tension table
Solution In Band
Tension In ern of water
CeC12
EC e 1,2
KC1
EC '4-- 1.2 measurementDate of
Electrodes
24 92
Electrodes
26 52
0, 5 0, 5 0, 2 0. 4 sIla
24 2. 0 1. 7 15.0 16. 0 9/19
5. 3 1, 2 4, 7 12. 0 9/21
5 2. 1 0, 3 1.7 0. 9 9/25
0, 2 0. 2 0. 2 0. 9/26
ments. When the electrode tips only touched the suspen-sions, a difference between measured currents for K and Ca chlorides with the same electrode potential was evident.
Minus 0.65-volt currents from i-v curves taken in sand wet with KCl and CaCl2 solutions at a conductivity of about 1.2 mmho cm- 1 are given in Table 1, Current was lower by a factor of about four from electrodes in CaC1 2-wetted sand than from KC1-2-wetted sand with a tension of 24 cm of H2 O, or greater. At zero tension there was no dif-ference between treatments. The date of each measurement is given in Table 1 to provide the sequence of the measure-ments and times allowed for equilibrium of water movement within the samples.
DISCUSSION
From only ODR measurements in sand, one has diffi-culty establishing the influence of solution salt concentra-tion on the ODR measurement. In Fig. 1 it is shown that in a saturated sand little difference existed between measure-ments in the two different media. At a suction of 24 cm of water (air entry into the sand occurred at 20 cm of water) there appeared to be a difference in the average currents. Even though each plotted point is the average from 10 measurements there is no statistical difference between the curves. One can only state that average current from the sand wet with salt solution appeared to be higher than average current from the sand wet with tap water when both were at a tension of 24 cm of water.
McIntyre (7), Gradwell (2) and Birkle et al. (1) have shown that i-v curve from an unsaturated soil lacks a dif-fusion plateau. A similarly shaped curve was obtained with an electrode that was not completely submerged in a solu-tion (see Fig. 2). Measurements shown in Table 1
indi-cate that the same trends in measured current do occur in unsaturated sands as well as in solutions with the same salts
present. Most of the conclusions of this paper are therefore based on the assumption that a partially immersed elec-trode provides at least an order of magnitude
approxima-tion of an electrode in an unsaturated granular medium. In Fig. 3 it can be seen that currents increase with increasing NaCl concentration up to a conductivity of approximately 10. At conductivities higher than this, cur-rents change little. At the lower conductivities, the current may be lower than expected because of a potential drop within the potential measuring circuit itself. Even the meas-ured electrode potential may not be the correct one.
in order to check this factor, resistance measurements
were made. The measured resistance between a reference cell and an electrode with its tip only in solution was from 20,000 to 70,000 ohms, depending on solution conduc-tivity and contact between the electrode and solution. Conductivity of solutions used for measurements ranged from 50 to 0.5 mmho cm-1 . Assuming a resistance from the electrode through the reference cell of 10 5 ohms, with the VTVM used, any difference between actual electrode potential and measured potential was of the order of 5 my or less. A potential difference of this order would make little difference in current.
If the potential field near the electrode extends signifi-cantly into solution, the potential difference between the electrode and the solution immediately adjacent to it will be less than that measured with the VTVM and reference cell in the bulk solution. Using a reference cell with a capil-lary tip of drawn glass tubing, the potential of an electrode was determined with the reference cell at different distances from the electrode. In a KC1 solution with an electrical conductivity of 1.3, the electrode potential differed as much as 0.03 volt between placing the reference cell tip within 1 mm of the electrode and placing it 1 cm or farther away from the electrode. In an unsaturated medium wet with a solution of low conductivity, therefore, the actual electrode potential can be different from the measured potential. If the currents from an environment containing only monovalent cations are corrected for measureable potential differences, they still are not high enough at low salt concentrations to show current independent of salt concentrations.
Lowered currents at low salt concentrations could be explained by Will's (10) contention that migration of ions parallel to the electrode surface above the meniscus causes local depolarization of the electrode. The measured elec-trode potential was, therefore, not equal to that which existed between the electrode and the film of water on it. The conductivity of the film would be expected to exert a major controlling influence on the current flowing through the electrode.
Because of this movement of ions in thin films on the electrode surface, lowered currents in the presence of divalent ions might be explained by considering the mobil-ity of the ions involved. Values for the mobilities of Na t , K+ , Ca2+ , Cl-, and SO42- were taken to be the ratio of the equivalent conductance of the separate ions at 25C (taken from standard tables) to the Faraday. The values for
mobilities ranged from 5.3 x 10⁻¹ (cm5/sec volt) for Nat to 8.4 x 10⁻⁴ for SO4 .2- Ca2+ , and Cl- mobilities all are within the range of values given. No consistant relation between ionic mobilities and measured currents was ap-parent.
It is clear that there is a major difference between cur-rents measured in the presence of monovalent and divalent cations. For electrodes with tips only contacting the diva-lent cation solution, the current is only 25 to 50% that measured from monovalent cation solutions of equal conductivity.
basic solution the platinum oxide acts as a cation ex-changer. Since the oxide takes an integral part in the oxygen reduction process, one might expect, as appears to be the case, that the nature of the cations around an elec-trode influences oxygen reduction.
What effect will this have on the interpretation of ODR measurements? Rarely will a soil solution contain only monovalent or only divalent cations. In Fig. 3 is also shown current from mixed salt solutions. There is a gradation of the currents in mixed salts between that in a monovalent and divalent salt solutions. Current is not directly related to the ratio of divalent to monovalent cations, however. With only 1 part of CaCl 2 solution to 5 parts NaC1 solu-tion of equal conductivity, measured current is still only one-third that in NaCl solution at an EC of 10.
It should be pointed out that the currents reported are typical of measurements made in various solutions used. The absolute values obtained will, of course, depend upon electrode size and the total area of meniscus as indicated by the difference in magnitude of currents in Fig. 2 and 3. The differences between currents from the various solutions are indicative only of the magnitude of differences caused by the salts involved.
The differences shown in Fig. 3 among measurements taken in solutions with Ca2+ present can be considered insignificant for most field purposes. If differences no larger than those indicated occur in field measurements, the ratio of monovalent to divalent cations should have little influence on the measurements. If significant effects do occur, they might be expected when a saline soil is limed and leached. Preleaching measurements will be from a soil solution of high EC and high ratio of Na+ to Ca2+ . Post-leaching measurements will be from a soil solution of lower EC and lower Na+ to Ca2+ ratio.
Greenhouse or laboratory plant cultures may provide conditions in which the type or concentration of a particu-lar salt can significantly influence ODR measurements. Note that different ODR measurements are to be expected from unsaturated media with only monovalent ions present than if divalent ions are present too.
CONCLUSIONS
Two factors have been discussed that may influence ODR measurements-conductivity of soil solution, and the ratio of monovalent to divalent ions in the soil solution. Both of these factors vary from soil to soil and on occasion within any one soil. In what soils, then, can the electrodes be expected to operate most satisfactorily as far as these two factors are concerned?
The reason for the influence of solution conductivity on the measurement is evidently the migration of ions parallel to the electrode surface. If this is the case, the more directly the ions can be removed from an electrode, the less will
be the effect of conductivity on the measurement. Fine-textured soils will provide more opportunity for direct
particle contact (and, therefore, solution contact) with an electrode than will coarse-textured soils. The electrodes should operate more satisfactorily in fine-textured soils than in coarse-textured or well-aggregated ones. Fortu-nately it is in fine-textured soils that one is most often concerned about poor aeration.
For maximum consistency in comparison of measure-ments between soils, one ideally should compare readings from soils that provide comparable solution geometry and similar monovalent to divalent cation ratios. It is again fortunate that in mixed salt solutions there is little effect of solution conductivity on measurements. Rarely will only monovalent cations be present in soils. With a maximum difference of a factor of not quite two between currents from 100% CaC12 solution and that from 80% NaCI, 20% CaC1 2 solution at EC 10 as shown in Fig. 3, the actual influence of various ratios of monovalent to divalent cations upon measurements appears to be relatively unim-portant. Even if major changes in cation populations occur in fields because of such practices as gypsum application, leaching, or long-term use of poor quality irrigation water, the changes would not be expected to be sufficient to cause changes in ODR because of the salts.
In laboratory work where only monovalent ions may be used in unsaturated media, quite different ODR meas-urements are to be expected from media with, and those without, divalent ions.
LITERATURE CITED
1. Birkle, D. E., J. Letey, L. H. Stolzy, and T. E. Szuszkie-wicz. 1964. Measurement of oxygen diffusion rates with the platinum microelectrode. II. Factors influencing the measurement. Hilgardia, 35 (20): 555-566.
2. Gradwell, M. W. 1965. Soil physical conditions of winter and the growth of ryegrass plants. I. Effects of compacting and puddling. New Zealand J. Agr. Res. 8:238-269. 3. Kristensen, K. J. 1966. Factors affecting measurements of
oxygen diffusion rate (ODR) with bare platinum micro-electrodes. Agron. J. 58:351-354.
4. Kozawa, Akiya. 1964. Effects of anions and cations on oxygen reduction and oxygen evolution reactions on plati-num electrodes. J. Electroanal. Chem. 8:20-39.
5. Letey, I. and L. H. Stolzy. 1964. Measurement of oxygen diffusion rates with the platinum microelectrode. I. Theory and equipment. Hilgardia, 35(20) :545-554.
6. Maget, H. J. R., and R. Roethlein. 1965. The electro-chemical reduction of oxygen on platinum electrodes par. tially immersed in sulfuric acid. I. Electrochem. Soc.
112 : 1034-1040.
7, McIntyre, D. S. 1966. Characterizing soil aeration with a platinum microelectrode. II. Response under controlled soil physical conditions. Australian I. Soil Res. 4:103-113. 8. McIntyre, D. S. 1967. Physical factors affecting operation of the oxygen cathode in unsaturated porous media. Soil Sci. 103:118-125.
9. Van Doren, D. M., and A. E. Erickson. 1966. Factors affecting the platinum microelectrode method for measur-ing the rate of oxygen diffusion through the soil solution. Soil Sci. 102:23-28.