The Thirty-Third AAAI Conference on Artificial Intelligence (AAAI-19)
Gaussian-Induced Convolution for Graphs
Jiatao Jiang, Zhen Cui,
∗Chunyan Xu, Jian Yang
PCA Lab, Key Lab of Intelligent Perception and Systems for High-Dimensional Information of Ministry of Education, and Jiangsu Key Lab of Image and Video Understanding for Social Security,
School of Computer Science and Engineering, Nanjing University of Science and Technology, Nanjing, China {jiatao, zhen.cui, cyx, csjyang}@njust.edu.cn
Abstract
Learning representation on graph plays a crucial role in nu-merous tasks of pattern recognition. Different from grid-shaped images/videos, on which local convolution kernels can be lattices, however, graphs are fully coordinate-free on vertices and edges. In this work, we propose a Gaussian-induced convolution (GIC) framework to conduct local con-volution filtering on irregular graphs. Specifically, an edge-induced Gaussian mixture model is designed to encode varia-tions of subgraph region by integrating edge information into weighted Gaussian models, each of which implicitly char-acterizes one component of subgraph variations. In order to coarsen a graph, we derive a vertex-induced Gaussian mix-ture model to cluster vertices dynamically according to the connection of edges, which is approximately equivalent to the weighted graph cut. We conduct our multi-layer graph convo-lution network on several public datasets of graph classifica-tion. The extensive experiments demonstrate that our GIC is effective and can achieve the state-of-the-art results.
Introduction
As witnessed by the widespread applications, graph is one of the most successful models to conduct structured and semi-structured data, ranging from text (Defferrard, Bresson, and Vandergheynst 2016), bioinformatics (Yanardag and Vishwanathan 2015; Niepert, Ahmed, and Kutzkov 2016; Song et al. 2018) and social network (Gomez, Chiem, and Delvenne 2017; Orsini, Baracchi, and Frasconi 2017) to images/videos (Marino, Salakhutdinov, and Gupta 2016; Cui et al. 2018; Cui, Yang, and others 2017). Among these applications, learning robust representations from structured graphs becomes the main topic. To this end, various meth-ods have come forth in recent years. Graph kernels (Ya-nardag and Vishwanathan 2015) and recurrent neural net-works (RNNs) (Scarselli et al. 2009) are the most repre-sentative ones. Graph kernels usually take the classic R-convolution strategy (Haussler 1999) to recursively decom-pose graphs into atomic sub-structures and then define lo-cal similarities between them. RNNs based methods sequen-tially traverse neighbors with tied parameters in depth. With the increase of graph size, graph kernels would suffer di-agonal dominance of kernels (Sch¨olkopf et al. 2002) while
∗
Corresponding author
Copyright c2019, Association for the Advancement of Artificial Intelligence (www.aaai.org). All rights reserved.
RNNs would have the explosive number of combinatorial paths in the recursive stage.
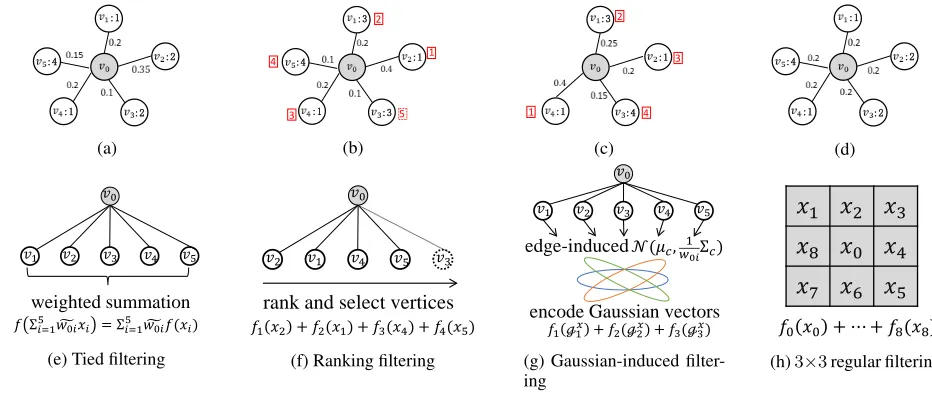
Recently convolutional neural networks (CNNs) (Le-Cun, Bengio, and Hinton 2015) have achieved breakthrough progresses on representing grid-shaped image/video data. In contrast, graphs are with irregular structures and fully coordinate-free on vertices and edges. The vertices/edges are not strictly ordered, and can not be explicitly matched between two graphs. To generalize the idea of CNNs onto graphs, we need to solve this problem therein that the same responses should be produced for those homomor-phic graphs/subgraphs when performing convolutional fil-tering. To this end, recent graph convolution methods (Def-ferrard, Bresson, and Vandergheynst 2016; Atwood and Towsley 2016; Hamilton, Ying, and Leskovec 2017) at-tempted to aggregate neighbor vertices as shown in Fig. 1e. This kind of methods actually employ a fuzzy filtering (i.e., a tied/shared filter) on neighbor vertices because only first-order statistics (mean) is used. Two examples are shown in Fig. 1a and Fig. 1b. Although they have different structures, the responses on them are fully equal. Oppositely, Niepert et.al (Niepert, Ahmed, and Kutzkov 2016) ranked neighbor vertices according to weights of edges, and then used dif-ferent filters on these sorted vertices, as shown in Fig. 1f. However, this rigid ranking method will suffer some limita-tions: i) probably consistent responses to different structures (e.g., Fig. 1b and Fig. 1c) because weights of edges are out of consideration after ranking; ii) information loss of node pruning for a fixed-size receptive field as shown in Fig. 1b; and iii) ranking ambiguity for equal connections as shown in Fig. 1d; and iv) ranking sensitivity to (slightly) changes of edge weights/connections.
In this paper we propose a Gaussian-induced graph con-volution framework to learn graph representation. For a coordinate-free subgraph region, we design anedge-induced
repre-:1
:2
:2 :1
:4
(a)
3 5
1 4
:3
:1
:3 :1
:4
2
(b)
:3
:1
:4 :1
3
1
2
4
(c)
:1
:2
:2 :1
:4
(d)
𝑓𝑓 Σ𝑖𝑖=15 𝑤𝑤�0𝑖𝑖𝑥𝑥𝑖𝑖 =Σ𝑖𝑖=15 𝑤𝑤�0𝑖𝑖𝑓𝑓(𝑥𝑥𝑖𝑖) 𝑣𝑣0
weighted summation
𝑣𝑣2
𝑣𝑣1 𝑣𝑣3 𝑣𝑣4 𝑣𝑣5
(e) Tied filtering
𝑓𝑓1 𝑥𝑥2 +𝑓𝑓2(𝑥𝑥1) +𝑓𝑓3(𝑥𝑥4) +𝑓𝑓4(𝑥𝑥5) rank and select vertices
𝑣𝑣0
𝑣𝑣1
𝑣𝑣2 𝑣𝑣4 𝑣𝑣5 𝑣𝑣3
(f) Ranking filtering
𝑓𝑓1ℊ1𝑥𝑥 +𝑓𝑓2(ℊ2𝑥𝑥) +𝑓𝑓3(ℊ3𝑥𝑥)
encode Gaussian vectors
𝒩𝒩(𝜇𝜇𝑐𝑐,𝑤𝑤10𝑖𝑖Σ𝑐𝑐) edge-induced
𝑣𝑣0
𝑣𝑣5 𝑣𝑣4 𝑣𝑣3 𝑣𝑣2 𝑣𝑣1
(g) Gaussian-induced filter-ing
𝑥𝑥
1𝑥𝑥
2𝑥𝑥
3𝑥𝑥
8𝑥𝑥
0𝑥𝑥
4𝑥𝑥
7𝑥𝑥
6𝑥𝑥
5 𝑓𝑓0 𝑥𝑥0 +⋯+𝑓𝑓8(𝑥𝑥8)(h)3×3regular filtering
Figure 1: Different filters operations on graph vertices. Examples of one-hop subgraphs are given in (a)-(d), wherev0is the
reference vertex and each vertex is assigned to a signal. The tied filtering (e) summarizes all neighbor vertices, and generates the same responses to (a) and (b) under the filterf, i.e.,f(P
g
w0ixi) =f(1.9), although the two graphs are completely different in
structures. The ranking filtering (f) sorts/prunes neighbor vertices and then performs different filtering on them. It might result into the same responsesf1(1) +f2(3) +f3(1) +f4(4)to different graphs such as (b) and (c), where the digits in red boxes
denote the ranked indices and the vertex of dashed box in (b) is pruned. Moreover, the vertex ranking is uncertain/non-unique for equal connections in (d).To address these problems, we derive edge-induced GMM to coordinate subgraphs as shown in (g). Each of Gaussian model can be viewed as one variation component (or direction) of subgraph. Like the standard convolution (h), the Gaussian encoding is sensitive to different subgraphs, e.g., (a)-(d) will have different responses. Notef, fiare linear
filters, and the non-linear activation functions are put on their responses.
sentations1 through our Gaussian encoding in Fig. 1g. To make the network inference forward, we transform Gaus-sian components of each subgraph into the gradient space of multivariate Gaussian parameters, instead of employing the sophisticated EM algorithm. Then the filters (or transform functions) are performed on different Gaussian components like latticed kernels on different directions in Fig. 1h. Fur-ther, we derive a vertex-induced Gaussian mixture model (VI-GMM) to favor dynamic coarsening of graph. We also theoretically analyze the approximate equivalency of VI-GMM to weighted graph cut (Dhillon, Guan, and Kulis 2007). Finally, EI-GMM and VI-GMM can be alternately stacked into an end-to-end optimization network.
In summary, our main contributions are four folds: i) pro-pose an end-to-end Gaussian-induced convolutional neural network for graph representation; ii) propose edge-induced GMM to encode variations of different subgraphs; iii) de-rive vertex-induced GMM to perform dynamic coarsening of graphs, which is an approximation to the weighted graph cut; iv) verify the effectiveness of our method and report state-of-the-art results on several graph datasets.
1Suppose three Gaussian models are N(0,1),N(0,2) and
N(0,3), then we can compute the responses on (a)-(d) respectively as f1([0.49,−0.93]) + f2([0.17,−0.65]) + f3([0.07,−0.44]), f1([0.35,−0.73]) + f2([0.15,−0.58]) + f3([0.10,−0.64], f1([0.35,−0.71]) + f2([0.15,−0.39]) + f3([0.10,−0.43]), f1([0.46,−0.99]) + f2([0.18,−0.62]) + f3([0.08,−0.42]).
Please refer to incoming section.
Related Work
edge-induced GMM
vertex-induced
GMM FC + Softmax
edge-induced GMM
vertex-induced GMM
convolution coarsening convolution coarsening
... ...
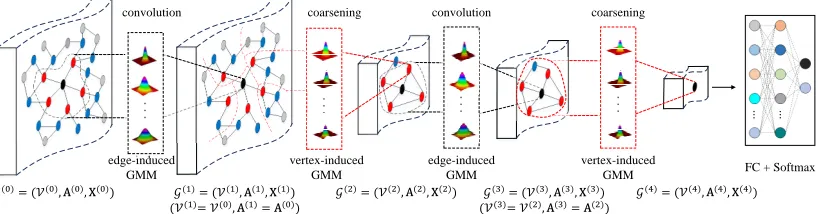
Figure 2: The GIC network architecture. The GIC main contains two module: convolution layer (EI-GMM) and coarsening layer (VI-GMM). The GIC stacks several convolution and coarsening layers alternatively and iteratively. More details can be found in incoming section.
et al. 2018) attempts to aggregate walk fields defined by ran-dom walks into Gaussian mixture models. Zhao (Zhao et al. 2018) attempts to define a standard network with dif-ferent graph convolutions. Besides, some variants (Hamil-ton, Ying, and Leskovec 2017; Duran and Niepert 2017; Zhang et al. 2018) employ the aggregation or propagation of local neighbor nodes. Different from these tied filtering or ranking filtering methods, we use Gaussian models to en-code local variations of graph. Also different from the re-cent mixture models (Monti et al. 2017), which uses GMM to only learn the importance of adjacent nodes, our method uses weighted GMM to encode the distributions of local graph structures.
The GIC Network
Attribute Graph
Here we consider an undirected attribute graph G = (V,A,X) of m vertices (or nodes), whereV = {vi}mi=1
is the set of vertices,A is a (weighted) adjacency matrix, andXis a matrix of graph attributes (or signals). The adja-cency matrixA∈Rm×mrecords the connections between vertices. Ifvi, vjare not connected, thenA(vi, vj) = 0,
oth-erwiseA(vi, vj) = 06 . We sometimes abbreviate A(vi, vj)
asAij. The attribute matrixX ∈ Rm×dis associated with the vertex setV, whosei-th rowXi (orXvi) denotes ad
-dimension attribute of thei-th node (i.e.,vi).
The graph Laplacian matrixLis defined asL=D−A, whereD∈Rm×mis the diagonal degree matrix withDii=
P
jAij. The normalized version is written as Lnorm = D−1/2LD−1/2=I−D−1/2AD−1/2. whereIis the iden-tity matrix. Unless otherwise specified, we use the latter. We give the definition of subgraph used in the following.
Definition 1. Given an attribute graphG= (V,A,X), the attribute graphG0 = (V0,A0,X0)is a subgraph ofG,
de-notedG0 ⊆ G, if (i)V0 ⊆ V, (ii)A0 is the submatrix ofA w.r.t. the subsetV0, and (iii)X0=X
V0.
Overview
The GIC network architecture is shown in Fig. 2. Given an attribute graphG(0) = (V(0),A(0),X(0)), where the
super-script denotes the layer number, we construct multi-scale
re-ceptive fields for each vertex based on the adjacency matrix
A(0). Each receptive field records k-hop neighborhood re-lationships around the reference vertex, and forms a local centralized subgraph. To encode the centralized subgraph, we project it into edge-induced Gaussian models, each of which defines one variation “direction” of the subgraph. We perform different filtering operations on different Gaussian components and aggregate all responses as the convolutional output. After the convolutional filtering, the input graphG(0)
is transformed into a new graphG(1) = (V(1),A(1),X(1)),
whereV(1) = V(0) andA(1) = A(0). To further abstract
graphs, we next stack a coarsening layer on the graphG(1).
The proposed vertex-induced GMM is used to downsam-ple the graph G(1) into the low-resolution graph G(2) = (V(2),A(2),X(2)). Taking the convolution and coarsening
modules, we may alternately stack them into a multi-layer GIC network, With the increase of layers, the receptive field size of filters will become larger, so the higher layer can ex-tract more global graph information. In the supervised case of graph classification, we finally concatenate with a fully connected layer followed by a softmax loss layer.
Multi-Scale Receptive Fields
In the standard CNN, receptive fields may be conveniently defined as latticed spatial regions. Thus convolution kernels on grid-shaped structures are accessible. However, the con-struction of convolutional kernels on graphs are intractable due to coordinate-free graphs, e.g., unordered vertices, un-fixed number of adjacent edges/vertices. To address this problem, we resort to the adjacent matrix A, which ex-presses connections between vertices. Since Ak exactly
records the k-step reachable vertices, we may construct a
k-neighbor receptive field by using thek-order polynomial ofA, denoted asψk(A). Taking the simplest case,ψk(A) = Ak reflects the k-hop neighborhood relationships. In
or-der to remove the scale effect, we may normalize ψk(A)
as ψk(A)diag(ψk(A)1)−1, which describes the reachable
possibility in ak-hop walking. Formally, we define thek-th scale receptive field as a subgraph.
Definition 2. The k-th scale receptive field around a ref-erence vertex vi is a subgraph Gvki = (V
0,A0,X0)of the
0} ∪ {vi},A0is the submatrix ofAe w.r.t.V0, andX0=XV0.
Convolution: Edge-Induced GMM
Given a reference vertexvi, we can construct the centralized
subgraphGk
vi of thek-th scale. To coordinate the subgraph,
we introduce Gaussian mixture models (GMMs), each of which may be understood as one principal direction of its variations. To encode the variations accurately, we jointly formulate attributes of vertices and connections of edges into Gaussian models. The edge weightA0(vi, vj)indicates the
relevance ofvj to the central vertex vi. The higher weight
is, the stronger impact onvi is. So the weights can be
in-corporated into a Gaussian model by observingA0(vi, vj)
times. As the likelihood function, it is equivalent to raise the power A0(vi, vj) on Gaussian function, which is
pro-portional toN(X0v j, µ,
1
A0(v
i,vj)Σ). Formally, we estimate
the probability density of the subgraph Gk
vi from the C1
-component GMM,
pvi(X
0
vj;Θ1, A
0
ij) = C1
X
c=1
πcN(X0vj;µc, 1
A0ijΣc),
s.t.πc>0, C1
X
c=1
πc= 1, (1)
where Θ1 = {π1,· · · , πC1, µ1,· · ·, µC1,Σ1,· · ·,ΣC1}
are the mixture parameters, {πc} are the mixture
coeffi-cients,{µc,Σc}are the parameters of thek-th component,
andA0
ij >02. Intuitively, edge weightA0ij is, the stronger
impact of the nodevjw.r.t. the reference vertexviis. We will
refer to the model in Eqn. (1) as theedge-induced Gaussian mixture model(EI-GMM).
In what follows, we assume all attributes of nodes are independent on each other, which is often used in signal processing. That means, the covariance matrix Σc is
di-agonal, so we denote it as diag(σc2). To avoid the explicit
constraints forπc in Eqn. (1), we adopt the soft-max
nor-malization with the re-parameterization variable αc, i.e.,
πc = exp(αc)/P C1
k=1exp(αk). Thus, the entire subgraph
log-likelihood can be written as
ζ(Gk vi) =
m
X
j=1
lnpvi(X
0
vj;Θ1,A
0) = m X j=1 ln C1 X c=1
πcN(X0vj;µc, 1
A0ijΣc), (2)
To infer forward, instead of the expectation-maximization (EM) algorithm, we use the gradients of the subgraph with regard to the parameters of the EI-GMM modelΘ1,
moti-vated by the recent Fisher vector work (Sanchez et al. 2013), which has been proven to be effective in representation.
For a convenient calculation, we simplify the notations, Njc=N(X0vj, µc,
1
A0
ijσ 2
c)andQjc=
πcNjc PC1
k=1πkNjk
, then we
2
In practice, we normalizeA0into a non-negative matrix.
can derive the gradients of model parameters from Eqn. (2) as follows
∂ζ(Gk vi)
∂µc =
m
X
j=1
A0ijQjc(X0vj −µc)
σ2
c
,
∂ζ(Gk vi)
∂σc =
m
X
j=1
Qjc(A0ij(X0vj −µc) 2−σ2
c)
σ3
c
, (3)
where the division of vectors means a term-by-term opera-tion. Note we do not use∂ζ(Gk
vi)/∂αc due to no
improve-ment in our experience. The gradients describe the contribu-tion of the corresponding parameters to the generative pro-cess. The subgraph variations are adaptively allocated toC1
Gaussian models. Finally, we ensemble all gradients w.r.t. Gaussian model (i.e., directions of graph) to analogize the collection of local square receptive field on image. Formally, for thek-scale receptive fieldGk
viaround the vertexvi, the
at-tributes produced from Gaussian models are filtered respec-tively and then concatenated,
F(Gk
vi,Θ1, f) =ReLU( C1
X
c=1
fi(Cat[
∂ζ(Gk vi)
∂µc
,∂ζ(G
k vi)
∂σc ]),
(4)
where Cat[·,·]is a concatenation operator,fi is a linear
fil-tering function (i.e., a convolution function) and ReLU is the rectified linear unit. Therefore we can produce the fea-ture vectors that have same dimensionality depending on the number of Gaussian models for different subgraphs. If the soft assignment distributionQjcis sharply peaked on a
sin-gle value of one certain Gaussian for the vertexvj, the vertex
will be only projected onto one Gaussian direction.
Coarsening: Vertex-Induced GMM
Like the standard pooling in CNNs, we need to downsample graphs so as to abstract them as well as reduce the com-putational cost. However, the pooling on images are tai-lored for latticed structures, and cannot be used for irreg-ular graphs. One solution is to use some clustering algo-rithms to partition vertices to several clusters, and then pro-duce a new vertex from each cluster. However, we expect that two vertices should not fall into the same cluster with a larger possibility if there is a high transfer difficulty between them. To this end, we derive vertex-induced Gaussian mix-ture models (VI-GMM) to weight each vertex. To utilize the edge information, we construct a latent observation φ(vi)
w.r.t. each vertex vi from the graph Laplacian (or adjacent
matrix if semi-positive definite), i.e., the kernel calculation hφ(vi), φ(vj)i=Lij. Moreover, for each vertexvi, we
de-fine an influence factorwi for Gaussian models. Formally,
givenC2Gaussian models, VI-GMM is written as
p(φ(vi);Θ2, wi) = C2
X
c=1
πcN(φ(vi);µc, 1
wi Σc),
s.t.wi=h(Xvi)>0, (5)
identity matrix. Then we have
p(φ(vi);Θ2, wi) = C2
X
c=1
πc (2π
wi) d/2exp
−wi2kφ(vi)−µck2, (6)
Given a graph withmvertices, the objective is to maximize the following log-likelihood:
arg max
Θ2
ζ(Θ2) =
m
X
i=1 ln
C2
X
c=1
πcN(φ(vi);µc, 1
wi
I)). (7)
To solve above model in Eqn. (7), we use the iterative ex-pectation maximization algorithm, which has closed-form solution at each step. Meanwhile, the algorithm may au-tomatically conduct the required constraints. The graphical clustering process is summarized as follows:
(1) E-Step: the posteriors, i.e., the i-th vertex for thec -th cluster, are updated wi-th pic = PCπcp(φ(vi);θc,wi)
k=1πkp(φ(vi);θk,wi),
where θc is the c-th Gaussian parameters, and Θ2 =
{θ1,· · ·, θC2}.
(2) M-Step: we optimize Gaussian parametersπ, µ. The parameter estimatation is given byπc = m1 Pmi=1ric, µc =
P
vi∈Gcwiφ(vi) P
vi∈Gcwi
. πc indicates the energy summation of all
vertices assigned to the clusterc, andµcmay be understood
as a doubly weighted (wi, ric) average on the clusterc.
After several iterations of the two steps, we perform hard quantification. Thei-th vertex is assigned as the class with the maximum possibility, formally, ric = 1 if c = arg maxkpik, otherwise 0. Thus we can obtain the cluster
matrixP ∈ {0,1}m×C2, whereP
ic = 1 if thei-th vertex
falls into the clusterc. During coarsening, we take maximal responses of each cluster as the attributes of new vertex, and derive a new adjacency matrix by usingP|AP.
It is worth noting that we need not compute the con-creteφduring the clustering process. The main calculation kφ(vi)−µck2in EM can be reduced to the kernel version:
Kii−
2P
vj∈GcwjKij P
vj∈Gcwj +
P
vj ,vk∈GcwjwkKjk (P
vj∈Gcwj)
2 , whereKij =
hφ(vi), φ(vj)i. In practice, we can use the graph Laplacian L as the kernel. In this case, we can easily reach the fol-lowing proposition, which is relevant to graph cut (Dhillon, Guan, and Kulis 2007).
Proposition 1. In EM, if the kernel matrix takes the weight-regularized graph Laplacian, i.e.,K =diag(w)Ldiag(w), then VI-GMM is equal to an approximate optimiza-tion of graph cut, i.e., minPC
c=1
links(Vc,V\Vc)
w(Vc) , where links(A,B) =P
vi∈A,vj∈BAij, andw(Vc) =
P
j∈Vcwj.
Experiments
Graph Classification
For graph classification, each graph is annotated with one label. We use two types of datasets: Bioinfor-matics and Network datasets. The former contains MUTAG (Debnath et al. 1991), PTC (Toivonen et al. 2003), NCI1 and NCI109 (Wale, Watson, and Karypis 2008), ENZYMES (Borgwardt et al. 2005)
and PROTEINS (Borgwardt et al. 2005). The lat-ter has COLLAB (Leskovec, Kleinberg, and Faloutsos 2005), BINARY, MULTI-5K, REDDIT-MULTI-12K, IMDB-BINARY and IMDB-MULTI.
Experiment Settings We verify our GIC on the above bioinformatics and social network datasets. In default, GIC mainly consists of three graph convolution layers, each of which is followed by a graph coarsening layer, and one fully connected layer with a final softmax layer as shown in Fig 2. Its configuration can simply be set as C(64)-P(0.25)-C(128)-P(0.25)-C(256)-P-FC(256), where C, P and FC denote the convolution, coarsening and fully connected layers respec-tively. The choices of hyperparameters are mainly inspired from the classic VGG net. For example, the coarsening fac-tor is 0.25 (w.r.t. 0.5×0.5 in VGG), the attribute dimen-sions at three conv. layers are 64-128-256 (w.r.t. the chan-nel numbers of conv1-3 in VGG). The scale of respective field and the number of Gaussian components are both set to 7. We train GIC network with stochastic gradient descent for roughly 300 epochs with a batch size of 100, where the learning rate is 0.1 and the momentum is 0.95.
In the bioinformatics datasets, we exploit labels and de-grees of the vertices to generate initial attributes of each vertex. In the social network datasets, we use degrees of vertices. We closely follow the experimental setup in PSCN (Niepert, Ahmed, and Kutzkov 2016). We perform 10-fold cross-validation, 9-fold for training and 1-fold for testing. The experiments are repeated 10 times and the aver-age accuracies are reported.
Comparisons with the State-of-the-arts We compare our GIC with several state-of-the-arts, which contain graph con-volution networks (PSCN (Niepert, Ahmed, and Kutzkov 2016), DCNN (Atwood and Towsley 2016), Ngram-CNN (Luo et al. 2017)), neural networks (SAEN (Orsini, Baracchi, and Frasconi 2017)), feature based algorithms (DyF (Gomez, Chiem, and Delvenne 2017), FB (Bruna et al. 2014)), random walks based methods (RW (G¨artner, Flach, and Wrobel 2003)), graph kernel approaches (GK (Sher-vashidze et al. 2009), DGK (Yanardag and Vishwanathan 2015), WL (Morris, Kersting, and Mutzel 2017)). We present the comparisons with the state-of-the-arts, as shown in Table 1. All results come from the related literatures. We have the following observations.
Deep learning based methods on graphs (including DCNN, PSCN, NgramCNN, SAEN and ours) are superior to those conventional methods in most cases. The conventional kernel methods usually require the calculation on graph ker-nels with high-computational complexity. In contrast, these graph neural networks attempt to learn more abstract high-level features by performing inference-forward, which need relatively low computation cost.
Compared with recent graph convolution methods, ours can achieve better performance on most datasets, such as PTC, NCI1, NCI109, ENZYMES and PROTEINS. The main reason should be that local variations of subgraphs are accurately described with Gaussian component analysis.
bioin-Table 1: Comparisons with state-of-the-art methods.
DATASET PSCN DCNN NGRAMCNN FB DYF WL GK DGK RW SAEN GIC
MUTAG 92.63 66.98 94.99 84.66 88.00 78.3 81.66 82.66 83.72 84.99 94.44
±4.21 – ±5.63 ±2.01 ±2.37 ±1.9 ±2.11 ±1.45 ±1.50 ±1.82 ±4.30
PTC 60.00 56.60 68.57 55.58 57.15 – 57.26 57.32 57.85 57.04 77.64
±4.82 – ±1.72 2.30 ±1.47 – ±1.41 ±1.13 ±1.30 ±1.30 ±6.98
NCI1 78.59 62.61 – 62.90 68.27 83.1 62.28 62.48 48.15 77.80 84.08
±1.89 – – ±0.96 ±0.34 ±0.2 ±0.29 ±0.25 ±0.50 ±0.42 ±1.77
NCI109 – 62.86 – 62.43 66.72 85.2 62.60 62.69 49.75 – 82.86
– – – ±1.13 ±0.20 ±0.2 ±0.19 ±0.23 ±0.60 – ±2.37
ENZYMES – 18.10 – 29.00 33.21 53.4 26.61 27.08 24.16 – 62.50
– – – ±1.16 ±1.20 ±1.4 ±0.99 ±0.79 ±1.64 – ±5.12
PROTEINS 75.89 – 75.96 69.97 75.04 73.7 71.67 71.68 74.22 75.31 77.65
±2.76 – ±2.98 ±1.34 ±0.65 ±0.5 ±0.55 ±0.50 ±0.42 ±0.70 ±3.21
COLLAB 72.60 – – 76.35 80.61 – 72.84 73.09 69.01 75.63 81.24
±2.15 – – 1.64 ±1.60 – ±0.28 ±0.25 ±0.09 ±0.31 ±1.44
REDDIT-B 86.30 – – 88.98 89.51 75.3 77.34 78.04 67.63 86.08 88.45
±1.58 – – ±2.26 ±1.96 ±0.3 ±0.18 ±0.39 ±1.01 ±0.53 ±1.60
REDDIT-5K 49.10 – – 50.83 50.31 – 41.01 41.27 – 52.24 51.58
±0.70 – – 1.83 ±1.92 – ±0.17 ±0.18 – ±0.38 ±1.68
REDDIT-12K 41.32 – – 42.37 40.30 – 31.82 32.22 – 46.72 42.98
±0.42 – – 1.27 ±1.41 – ±0.08 ±0.10 – ±0.23 ±0.87
IMDB-B 71.00 – 71.66 72.02 72.87 72.4 65.87 66.96 64.54 71.26 76.70
±2.29 – ±2.71 ±4.71 ±4.05 ±0.5 ±0.98 ±0.56 ±1.22 ±0.74 ±3.25
IMDB-M 45.23 – 50.66 47.34 48.12 – 43.89 44.55 34.54 49.11 51.66
±2.84 – ±4.10 3.56 ±3.56 – ±0.38 ±0.52 ±0.76 ±0.64 ±3.40
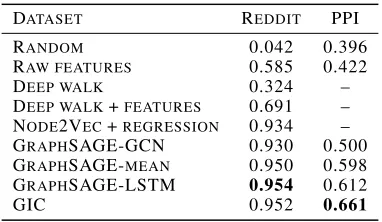
Table 2: Node label prediction on Reddit and PPI data (micro-averaged F1 score).
DATASET REDDIT PPI
RANDOM 0.042 0.396
RAW FEATURES 0.585 0.422
DEEP WALK 0.324 –
DEEP WALK+FEATURES 0.691 – NODE2VEC+REGRESSION 0.934 – GRAPHSAGE-GCN 0.930 0.500 GRAPHSAGE-MEAN 0.950 0.598 GRAPHSAGE-LSTM 0.954 0.612
GIC 0.952 0.661
formatics datasets and some social network datasets in-cluding PTC, NCI1, ENZYMES, PROTEINS, COLLAB, IMDB-BINARY and IMDB-MULTI. Although Ngram-CNN, DyF, WL and SEAN approaches have obtained the best performance on MUTAG, REDDIT-BINARY, NCI109, REDDIT-MULTI-5K and REDDIT-MULTI-12K respec-tively, our method is fully comparable to them.
Node Classification
For node classification, one node is assigned one/multiple labels. It is challenging if the label set is large. During train-ing, we only use a fraction of nodes and their labels. The task is to predict the labels for the remaining nodes. Fol-lowing the setting in (Hamilton, Ying, and Leskovec 2017),
we conduct the experiments on Reddit data and PPI data. For a fair comparison to graphSAGE (Hamilton, Ying, and Leskovec 2017), we use the same initial graph data, mini-batch iterators, supervised loss function and neighborhood sample. The other network parameters are similar to graph classification except removing the coarsening layer.
Tabel 2 summarizes the comparison results. Our GIC can obtain the best performance 0.661 on PPI data and a comparable result 0.952 on Reddit data. The raw fea-tures provide an important initial information for node multi-label classification. Based on the raw features, deep walk (Perozzi, Al-Rfou, and Skiena 2014) improves about 0.36 (micro-F1 scores) on Reddit data. Meanwhile, we con-duct an experiment of node2vec and use regression model to classification. Our method gains better performance than node2vec (Grover and Leskovec 2016). Comparing differ-ent aggregation methods like GCN (Kipf and Welling 2017), mean and LSTM, our GIC has a significant improvement about 0.16 on PPI data and gains a competitive performance on Reddit data. The results demonstrate our approach is ro-bust to infer unknown labels of partial graphs.
Model Analysis
Table 3: The verification of our convolution and coarsening.
DATASET CHEBNET GCN GIC GIC
W/ VI-GMM W/ VI-GMM W/OVI-GMM
MUTAG 89.44±6.30 92.22±5.66 93.33±4.84 94.44±4.30
PTC 68.23±6.28 71.47±4.75 68.23±4.11 77.64±6.98
NCI1 73.96±1.87 76.39±1.08 79.17±1.63 84.08±1.77
NCI109 72.88±1.85 74.92±1.70 77.81±1.88 82.86±2.37
ENZYMES 52.83±7.34 51.50±5.50 52.00±4.76 62.50±5.12
PROTEINS 78.10±3.37 80.09±3.20 78.19±2.04 77.65±3.21
Table 4: Comparisons onKandC1.
DATASET K, C1= 1 K, C1= 3 K, C1= 5 K, C1= 7
MUTAG 67.77±11.05 83.88±5.80 90.55±6.11 94.44±4.30
PTC 72.05±8.02 77.05±4.11 76.47±5.58 77.64±6.98
NCI1 71.21±1.94 83.26±1.17 84.47±1.64 84.08±1.77 NCI109 70.02±1.57 81.74±1.56 83.39±1.65 82.86±2.37 ENZYMES 33.83±4.21 64.00±4.42 63.66±3.85 62.50±5.12 PROTEINS 75.49±4.00 77.47±3.37 78.10±2.96 77.65±3.21
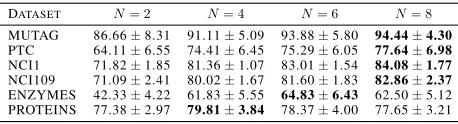
Table 5: Comparisons on the layer number.
DATASET N= 2 N= 4 N= 6 N= 8
MUTAG 86.66±8.31 91.11±5.09 93.88±5.80 94.44±4.30
PTC 64.11±6.55 74.41±6.45 75.29±6.05 77.64±6.98
NCI1 71.82±1.85 81.36±1.07 83.01±1.54 84.08±1.77
NCI109 71.09±2.41 80.02±1.67 81.60±1.83 82.86±2.37
ENZYMES 42.33±4.22 61.83±5.55 64.83±6.43 62.50±5.12 PROTEINS 77.38±2.97 79.81±3.84 78.37±4.00 77.65±3.21
ChebNet+VI-GMM and GCN+VI-GMM. It indicates EI-GMM can indeed encode the variations of subgraphs more effectively. On the other hand, we remove the coarsening layer from our GIC. For different size graphs, we pad new zero vertices into a fixed size and then concatenate attributes of all vertices for classification. As shown in this table, the performance of GIC still outperforms GIC without VI-GMM coarsening, which verifies the effectiveness of the coarsening layer VI-GMM.
KandC1: The kernel sizeKand the number of
Gaus-sian componentsC1are the most crucial parameters.
Gen-erally, the C1 is proportional to theK. The reason is that
the larger receptive field usually contains more vertices (i.e., a relative large subgraph). Thus we simply take the equal values for them, K = C1 = {1,3,5,7}. The
experimen-tal results are shown in Table 4. With the increase ofK, C1,
the performance improves at most cases. The reasons are two folds: i) with increasing receptive field size, the con-volution will cover the farther hopping neighbors; ii) with the increase ofC1, the variations of subgraphs are encoded
more accurately. But for the larger values ofKandC1will
increase the computational burden. Moreover, the overfit-ting phenomenon might occur with the increase of model complexity. Take the example of NCI109, in the first con-volution layer, the encoded attributes (in Eqn. (4)) will be
2×39×7 = 546for each scale of receptive field, where39
is the dimension of attributes (w.r.t the number of node la-bels) and7is the number of Gaussian components. Thus, for 7 scales of receptive field, the final encoded attributes will be
546×7 = 3822dimensions, which will be mapping to 64 dimensions by the functionf = [f1,· · · , fC1]in Eqn. (4).
Thus the model parameter is3822×64 = 244608in the first
layer. Similarly, if the number of node label is 2, the model parameter will sharply decrease into18816. Besides, the pa-rameter complexity is related to the number of classes and nodes. The comparison results in Table 4 demonstrate the trend of the parametersKandC1in our GIC framework.
Number of stacked layers: Here we test on the number of stacked network layers withN = 2,4,6,8. WhenN = 2, only one fully connected layer and one softmax layer are preserved. When N = 4, we add two layers: the convo-lution layer and the coarsening layer. When continuing to stack both, the depth of network will be 6 and 8. The results are shown in Table 5. Deeper networks can gain better per-formance in most cases, because the larger receptive field is observed and more abstract structures will be extracted in the topper layer. Of course, there is an extra risk of overfit-ting due to the increase of model complexity.
An analysis of computation complexity: In the convo-lution layer, the computational costs of receptive fields and Gaussian encoding are aboutO(Km2)andO(C
1md2)
re-spectively, wherem, dare number of nodes and the feature dimensionality. Generally,K=C1d < m. In the
coars-ening layer, the time complexity is about O(pm2+md), wherepis iteration number of the EM algorithm. In all, sup-pose the whole GIC alternatively stacksnconvolution and coarsening layers, the entire time complexity isO(n(K+
p)m2+nC
1md2+nmd).
Conclusion
In this paper, we proposed a novel Gaussian-induced convo-lution network to handle with general irregular graph data. Considering the previous spectral and spatial methods do not well characterize local variations of graph, we derived edge-induced GMM to adaptively encode subgraph structures by projecting them into several Gaussian components and then performing different filtering operations on each Gaussian direction like the standard CNN filters on images. Mean-while, we formulated graph coarsening into vertex-induced GMM to dynamically partition a graph, which was also proven to be equal to graph cut. Extensive experiments in two graphic tasks (i.e. graph and node classification) demon-strated the effectiveness and superiority of our GIC com-pared with those baselines and state-of-the-art methods. In the future, we would like to extend our method into more applications to irregular data.
Acknowledgments
The authors would like to thank the Chairs and the anony-mous reviewers for their critical and constructive com-ments and suggestions. This work was supported by the Na-tional Science Fund of China under Grant Nos. 61602244, 61772276, U1713208 and 61472187 and Program for Changjiang Scholars.
References
Borgwardt, K. M.; Ong, C. S.; Sch¨onauer, S.; Vishwanathan, S.; Smola, A. J.; and Kriegel, H.-P. 2005. Protein function prediction via graph kernels.Bioinformatics21(suppl 1):i47–i56.
Bruna, J.; Zaremba, W.; Szlam, A.; and LeCun, Y. 2014. Spectral networks and locally connected networks on graphs.ICLR. Cui, Z.; Xu, C.; Zheng, W.; and Yang, J. 2018. Context-dependent diffusion network for visual relationship detection. InMM, 1475– 1482. ACM.
Cui, Z.; Yang, J.; et al. 2017. Spectral filter tracking.arXiv preprint arXiv:1707.05553.
Debnath, A. K.; Lopez de Compadre, R. L.; Debnath, G.; Shuster-man, A. J.; and Hansch, C. 1991. Structure-activity relationship of mutagenic aromatic and heteroaromatic nitro compounds. correla-tion with molecular orbital energies and hydrophobicity. Journal of medicinal chemistry34(2):786–797.
Defferrard, M.; Bresson, X.; and Vandergheynst, P. 2016. Con-volutional neural networks on graphs with fast localized spectral filtering. InNIPS, 3844–3852.
Dhillon, I. S.; Guan, Y.; and Kulis, B. 2007. Weighted graph cuts without eigenvectors a multilevel approach.TPAMI29(11). Duran, A. G., and Niepert, M. 2017. Learning graph representa-tions with embedding propagation. InNIPS, 5119–5130.
G¨artner, T.; Flach, P.; and Wrobel, S. 2003. On graph kernels: Hardness results and efficient alternatives. Learning Theory and Kernel Machines129–143.
Gomez, L. G.; Chiem, B.; and Delvenne, J.-C. 2017. Dy-namics based features for graph classification. arXiv preprint arXiv:1705.10817.
Grover, A., and Leskovec, J. 2016. node2vec: Scalable feature learning for networks. InSIGKDD, 855–864. ACM.
Hamilton, W.; Ying, Z.; and Leskovec, J. 2017. Inductive repre-sentation learning on large graphs. InNIPS, 1025–1035.
Haussler, D. 1999. Convolution kernels on discrete structures. Technical report, Technical report, Department of Computer Sci-ence, University of California at Santa Cruz.
Henaff, M.; Bruna, J.; and LeCun, Y. 2015. Deep con-volutional networks on graph-structured data. arXiv preprint arXiv:1506.05163.
Jiang, J.; Cui, Z.; Xu, C.; Li, C.; and Yang, J. 2018. Walk-steered convolution for graph classification. arXiv preprint arXiv:1804.05837.
Kipf, T. N., and Welling, M. 2017. Semi-supervised classification with graph convolutional networks.ICLR.
LeCun, Y.; Bengio, Y.; and Hinton, G. 2015. Deep learning.Nature
521(7553):436–444.
Leskovec, J.; Kleinberg, J.; and Faloutsos, C. 2005. Graphs over time: densification laws, shrinking diameters and possible explana-tions. InSIGKDD, 177–187. ACM.
Li, Y.; Tarlow, D.; Brockschmidt, M.; and Zemel, R. 2016. Gated graph sequence neural networks.ICLR.
Li, C.; Cui, Z.; Zheng, W.; Xu, C.; Ji, R.; and Yang, J. 2018a. Action-attending graphic neural network.TIP27(7):3657–3670. Li, C.; Cui, Z.; Zheng, W.; Xu, C.; and Yang, J. 2018b. Spatio-temporal graph convolution for skeleton based action recognition.
AAAI.
Luo, Z.; Liu, L.; Yin, J.; Li, Y.; and Wu, Z. 2017. Deep learn-ing of graphs with ngram convolutional neural networks. TKDE
29(10):2125–2139.
Marino, K.; Salakhutdinov, R.; and Gupta, A. 2016. The more you know: Using knowledge graphs for image classification.arXiv preprint arXiv:1612.04844.
Monti, F.; Boscaini, D.; Masci, J.; Rodola, E.; Svoboda, J.; and Bronstein, M. M. 2017. Geometric deep learning on graphs and manifolds using mixture model cnns. InProc. CVPR, volume 1, 3. Morris, C.; Kersting, K.; and Mutzel, P. 2017. Glocalized weisfeiler-lehman graph kernels: Global-local feature maps of graphs. InICDM, 327–336. IEEE.
Niepert, M.; Ahmed, M.; and Kutzkov, K. 2016. Learning convo-lutional neural networks for graphs. InICML, 2014–2023. Orsini, F.; Baracchi, D.; and Frasconi, P. 2017. Shift aggregate extract networks.arXiv preprint arXiv:1703.05537.
Perozzi, B.; Al-Rfou, R.; and Skiena, S. 2014. Deepwalk: Online learning of social representations. InSIGKDD, 701–710. ACM. Sanchez, J.; Perronnin, F.; Mensink, T.; and Verbeek, J. 2013. Im-age classification with the fisher vector: Theory and practice.IJCV
105(3):222–245.
Scarselli, F.; Gori, M.; Tsoi, A. C.; Hagenbuchner, M.; and Monfar-dini, G. 2009. The graph neural network model.TNN20(1):61–80. Sch¨olkopf, B.; Weston, J.; Eskin, E.; Leslie, C.; and Noble, W. S. 2002. A kernel approach for learning from almost orthogonal pat-terns. InECML, 511–528. Springer.
Shervashidze, N.; Vishwanathan, S.; Petri, T.; Mehlhorn, K.; and Borgwardt, K. 2009. Efficient graphlet kernels for large graph comparison. InArtificial Intelligence and Statistics, 488–495. Song, T.; Zheng, W.; Song, P.; and Cui, Z. 2018. Eeg emotion recognition using dynamical graph convolutional neural networks.
IEEE Transactions on Affective Computing.
Such, F. P.; Sah, S.; Dominguez, M. A.; Pillai, S.; Zhang, C.; Michael, A.; Cahill, N. D.; and Ptucha, R. 2017. Robust spatial filtering with graph convolutional neural networks. IEEE Journal of Selected Topics in Signal Processing11(6):884–896.
Toivonen, H.; Srinivasan, A.; King, R. D.; Kramer, S.; and Helma, C. 2003. Statistical evaluation of the predictive toxicology chal-lenge 2000–2001.Bioinformatics19(10):1183–1193.
Velickovic, P.; Cucurull, G.; Casanova, A.; Romero, A.; Lio, P.; and Bengio, Y. 2018. Graph attention networks.ICLR.
Wale, N.; Watson, I. A.; and Karypis, G. 2008. Comparison of de-scriptor spaces for chemical compound retrieval and classification.
Knowledge and Information Systems14(3):347–375.
Yanardag, P., and Vishwanathan, S. 2015. Deep graph kernels. In
SIGKDD, 1365–1374. ACM.