Purchased by Agricultural Research Service U.S. Department of Agriculture, for ofacal use.
Som SCIENCE Vol. 106, No. 8
Copyright © 1968 by The Williams & Wilkins Co. Printed in U.S.A.
DETERMINING WATER CONTENT OF DIFFERENT SOILS BY THE NEUTRON METHOD
R. E. LUEBS, M. J. BROWN AND A. E. LAAG
United States Department of Agriculture and University of California, Riverside)
Received for publication September 28, 1967 The neutron scattering method for
measur-ing soil water content has been used extensively in soil water studies. Its wide acceptance re-sults from the greater precision and rapidity of measurement than is possible with the gravimetric method. Additional major ad-vantages of the neutron method over other methods include measurement in a relatively large volume of soil and over the full range of soil water.
As the neutron method developed, universal-ity of the calibration curve was frequently stated or implied (6, 8). As a consequence, much use of the method has been based on acceptance of one calibration curve for all mineral soils. However, a few published results indicate that the calibration for neutron depth probes may be significantly affected by the soil apart from its water content (2, 3, 5). The basis for the development of the method is the interaction of fast neutrons in the soil with hydrogen of the water molecules. Although this interaction ac-counts for the preponderance of neutron inter-actions in moist soil, the relationsip of count rate to water content can be affected by non-water hydrogen and certain chemical elements which either scatter or capture slow neutrons to some degree.
A major disadvantage of the depth probe used in the neutron method has been its re-ported unsuitability for measurements near the surface. Fast neutrons escape into the at-mosphere resulting in a reduced sensitivity of the measurement.
Inasmuch as the neutron method is primarily used to determine soil water content in situ a
field study was undertaken (1) to ascertain
1 Soil and Water Conservation Research Divi-sion, Agricultural Research Service, U.S.DA., and the California Agricultural Experiment Sta-tion, Riverside. Present address of M. J. Brown is Snake River Conservation Research Center,
Kimberly, Idaho.
the relationship between count rate and water content for soils differing in texture and bulk density and (2), to evaluate calibration at shal-low depths.
MATERIALS AND METHODS
A Nuclear-Chicago P-192 depth probe with a 3.97-mc., Ra-Be source was calibrated in five field soils. Counting rates were obtained from a Nuclear-Chicago 2800-A2 portable scaler. Three of the selected soils were of the Hanford series and were located within a radius of one kilo-meter. The textures of these soils were loamy sand, sandy loam, and very fine sandy loam with bulk densities of 1.44, 1.50, and 1.32 g/cc., respectively. The remaining soils were an Arlington sandy loam with a bulk density of 1.63 g/cc. and a Ducor clay with a bulk den-sity of 1.61 g/cc. Seven aluminum access tubes were installed to a depth of 90 cm. on a 6 m. X 6 m. area of nearly level soil at each site. Tub-ing had an outside diameter of 4.45 cm. and a wall thickness of .147 cm. Soils were wetted to at least 60 cm. below the depth of measurement. Data for calibrations were obtained at inter-vals under a drying regime for a rainless sum-mer period of six weeks. Each set of readings on a subsequent date required using a different access tube at a soil site. Care was taken to level the soil around access tube and to main-tain the same length of tube above the soil sur-face for each set of readings. Soil water con-tent was determined by the gravimetric method. The following procedure was employed each time measurements were made. The probe was placed with the effective center of measurement at 15-cm. depth intervals beginning at 7.5 cm., and 1-minute counts were made. Immediately following the operation soil samples were taken
2 Trade names and company names are included for the benefit of the reader and do not imply any endorsement of the equipment by the U.S.D A.
Arlington sandy loam BD=1.63 g/cc
/ Hanford sandy loam BD= \i//
g/cc
Hanford very fine sandy loam BD=1.32 g/cc
Hanford loamy sand BD=1.44 g/cc
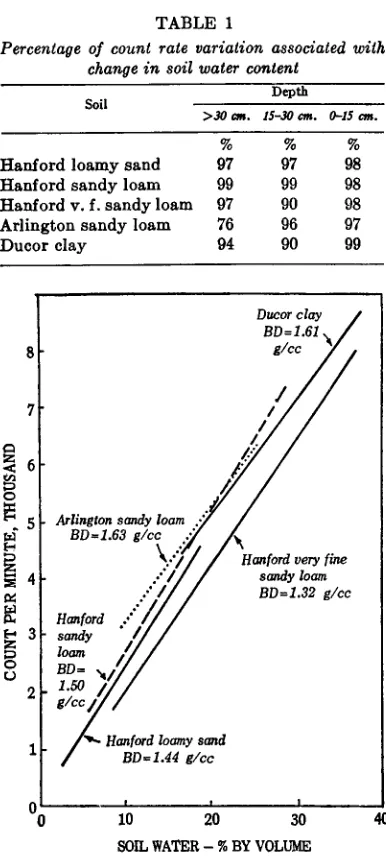
TABLE 1
Percentage of count rate variation associated with change in soil water content
Depth Soil
>30 an. 15-30 cm. 0-15 cm.
Hanford loamy sand 97 97 98
Hanford sandy loam 99 99 98
Hanford v. f. sandy loam 97 90 98
Arlington sandy loam 76 96 97
Ducor clay 94 90 99
Ducor clay BD=1.61
g/cc
were 0.03, 0.03, 0.02, 0.06, and 0.05 g/cc. for the Hanford very find sandy loam, Hanford sandy loam, Hanford loamy sand, Arlington sandy loam, and the Ducor clay, respectively. Six 1-minute standard shield counts were made immediately before and after counts were made for the soil. These shield counts were made 61 times over the 5-week study period. The standard deviation of the averages of the sets of 6 counts was 78 counts per minute. Because of this low variability in instrument performance, actual counts in the soil were not related to shield counts for calibration but were directly plotted against soil water content. Regression equations were calculated for the 0-15, 15-30, and >30-cm. soil depths.
8
RESULTS
Count rate was closely associated with volu-metric water content for each soil and depth (table 1). A good linear fit between count rate and water content was obtained for the shal-lower depths as well as for the combined deeper increments. With one exception change in soil water content accounted for 90 per cent or more of the change in count rate. A very high correla-tion between count rate and water content throughout was obtained for the two coarsest textured Hanford soils. The finer textured Han-ford very fine sandy loam and Ducor clay showed slightly lower correlations at the 15- to 30-cm. depth.
7
.4 6
5
4
E. 3 O
2
1
o
o 10 20 30
SOIL WATER – % BY VOLUME
Flo. 1. Neutron calibration curves for different soils at depths greater than 30 centimeters.
in 15-cm. depth increments, weighed and dried to constant weight at 105°C. Six samples per increment were taken in a circular pattern with-in 15 cm. of the tube and the water data were averaged. Soil bulk density in 15-cm. increments to a depth of 45 cm. was determined with a volume sampler for each soil at each sampling date. Bulk density measurements for increments between 45 and 75 cm. were obtained once for each soil. Standard deviations for all bulk den-sity determinations below the 30-cm. depth
Soil effects
The relationship between count rate and soil water content at depths below 30-cm. varied
40 among the soils studied (fig. 1 and table 2).
For example a much lower count rate was ob-tained with the neutron method for a given water content in the Hanford very fine sandy loam than in the other soils. This difference was significant at the 5 per cent level of probability. Assuming a rate of 5000 CPM and the maximum difference among calibra-tions for the soils used in this study, the error would be 4.4 per cent water by volume or ap-proximately 0.8 surface cm. for a 15-cm. depth increment. This error would be markedly in-creased as data, for several depth increments are summed to determine the water content of a rooting or storage zone.
SOIL WATER BY THE NEUTRON METHOD 209 TABLE 2
Count rate (CPM) as determined from calculated regression on volumetric water content, P, , for three soil depths
Soil
Depth
>30 cm. 15-30 cm. 0-15 cm.
Hanford loamy sand 144 + 237P, 410 + 183P, 21 + 129P.
Hanford sandy loam 322 + 244P, 143 + 246P, 15 + 130P.
Hanford v. f. sandy loam —104 + 220P, 724 + 203P, —260 + 161P,
Arlington sandy loam 1244 + 200P, —427 + 259P, 253 + 116Pv
Ducor clay 1188 + 198P, 380 + 219P, —2043 + 211P.
content encountered in the field. Therefore, the count rate at zero water content was not deter-mined. If the curves obtained are extrapolated some will not show a zero count rate for zero moisture content. Laboratory calibration curves obtained at low soil water contents by Marais and Smit (3) suggest that such relationships can be expected. Results of field studies by Holmes (1) indicate negative intercepts if curves relating count rate and equivalent water con-tent are extrapolated.
Slopes of regression lines relating count and per cent water by volume below 30 cm. were similar for the different soils. Regression coeffi-cients ranged between 198 and 244 and were not significantly different at the 5 per cent level (table 2). A common slope for the regres-sions indicates that one calibration curve would have been satisfactory for estimating net changes in water content, which occur over an interval of time in the field. At the 15- to 30-cm. depth there was no statistically significant difference among soils either in slope or intercept of the regression lines.
A common calibration curve also would have been satisfactory for measuring soil water con-tent in the 0- to 15-cm. layer of the three coarser textured soils (fig. 2 and table 2). Statistical analysis showed the Hanford loamy sand, Hanford sandy loam, and Arlington sandy loam to be of the same population with respect to water content as determined from their calibration curves. However, the slopes of the two finer textured soils, Hanford very fine sandy loam and Ducor clay, were each of a different population and separate calibration curves are necessary for these two soils.
Depth effects
As would be expected from the escape of fast neutrons into the atmosphere, the change in
10 20 30 40
SOIL WATER - % BY VOLUME
Fro. 2. Neutron calibration curves for dif-ferent soils at the 0-15 cm. depth.
count rate with change in moisture content was much less in the 0- to 15-cm. depth than for greater depths. Calibration curves obtained at greater depths are obviously not satisfactory for determining soil water in the surface 15 cm. The average regression coefficient for the loamy sand and the sandy loams at the 0- to 15-cm. depth was 55 per cent of that calculated for below the 30-cm. depth. With finer texture and greater moisture-holding capacity this dif-ference decreased, and for Ducor clay regres-sion coefficients at all depths were similar.
o Arlington sl
4 Ducor c
o Hanford sl • Hanford Is
x Hanford vfsl
2
L.
x
•
0
A
6
5
4
1.3 1.4 1.5 1.6
BULK DENSITY g/cc
Fro. 3. Change in count rate with bulk den-sity of the soil at 20 per cent water by volume.
statistically different from the coefficients for other soils although the magnitude of difference was relatively small. Therefore, net changes in water content in the 15- to 30-cm. depth could have been measured satisfactorily using the calibration curves for below 30 cm. Intercepts of the regression lines for the 15- to 30-cm. layer, however, were markedly different from greater depths for the three intermediate tex-tured soils. The error in the amount of water measured would therefore be large if only a single calibration curve was used for depths greater than 15 cm. in each of these soils.
Bulk density effects
Calibration curves for soils at depths greater than 30 cm. show a higher count rate for soils with higher bulk density at a given water con-tent (fig. 1). The apparent effect of bulk den-sity is to change the amount of water indi-cated without markedly changing the slope of the calibration curve. Statistical analysis of the regression equations was previously dis-cussed. Inasmuch as the calibration curves for a sandy loam and a clay were similar but mark-edly different from the calibration curve for a very fine sandy loam, it appears that texture
per .5e had no effect below the 30-cm. depth. The relationship between count rate and
bulk density for these different soils suggests that the effect of bulk density on count rate is dependent on other soil characteristics (fig. 3). The count rates for the Arlington and Ducor soils which have much higher bulk densities were equivalent to that for the Hanford sandy loam. Among the closely related soils of the Han-ford series bulk density apparently is the chief factor affecting soil water measurement by the neutron method (fig. 3). A change of 0.1 g/cc. in bulk density was equivalent to a count change of 500 per minute at 20 per cent water by vol-ume. Non-water hydrogen and certain other soil elements with a relatively high cross section for scatter of slow neutrons would increase the counting rate. Marais and Smit (4) showed that hydrogen present in organic matter in-creases the count rate for a given water con-tent. Some soil elements, notably boron, have a high cross section for capture of slow neutrons thereby decreasing the counting rate. By adding boron to soil Holmes and Jenkinson (2) changed the calibration curves for the neutron meter. The observed effect of the different groups of effective soil constituents depends on their relative contents. On a volume basis these contents are bulk density dependent. In-creasing the bulk density of material high in non-water hydrogen was shown by Marais and Smit to markedly increase the counting rate at the same water content.
Bulk density of soil may change with depth in the profile. The effect of such a change is illus-trated in fig. 4. The regression line for the 15- to 30-cm. depth where bulk density was higher shows a higher count rate. The difference while not great is statistically significant. It suggests that a single calibration curve may not be ade-quate for moisture measurements even in a soil at depths where escape of neutrons is not a factor.
DISCUSSION
calibra-SOIL WATER BY THE NEUTRON METHOD 211
tion curve for different bulk densities appears feasible and such adjusted curves may be suffi-ciently accurate for other soils of the same series as shown by these results. However, if widely different soils are involved in soil water measurements with the neutron method, a cali-bration curve would be required for each soil. In this respect, our results agree with those recently reported by Holmes (1). His data also show a marked effect of the soil on count rate change with water content. For many field ex-periments, especially those where repeated measurements are made, the neutron method is the most satisfactory for determining soil water even though an on-site calibration is necessary.
Our results, like those of Marais and Smit (4), show that the calibration curve has more universality for determining changes in soil moisture content than in determining the amount of water per se. The paucity of pub-lished calibration data on different soils pre-cludes drawing any far-reaching conclusions from this observation, however.
A high linear correlation between count rate and soil water content can be obtained for sur-face layers above 15 cm., provided the geometry of the surface and bulk density remains con-stant. A uniformly level soil surface was main-tained for measurements in this study. A similar condition is required when using a surface probe (7). Usually a significant loss in sensitivity of measurement occurs with the neutron source at the 7.5-cm. depth. Soil texture largely deter-mines the magnitude of this effect. Whereas for coarse-textured soil the method was found to be one-half as sensitive at the 0- to 15-cm. depth increment as at increments below 30 cm., there was little difference for clay at the field water contents observed.
The necessity for developing a separate cali-bration curve for the 15- to 30-cm. depth will usually depend on physical characteristics of the soil. The surface effect on count rate extends deeper in coarse-textured soil with its lower water content. Another limitation to including this depth with greater depths for calibration may be the changed bulk density resulting from previous tillage effects.
Inasmuch as bulk density may vary signifi-cantly within a soil profile, calibration of the neutron method at more than a single bulk den-sity for a given soil may be necessary for
ac-10 20 30 40
SOIL WATER — % BY VOLUME
Fm. 4. Effect of bulk density on counting rate at a soil sampling site.
curate water content measurements. Most satis-factory use of the neutron method in agronomic experiments will depend on the selection of soil areas which are as uniform as possible.
SUMMARY
The relationship between count rate obtained with the neutron method and soil water con-tent below the 30-cm. depth differed for several soils. The maximum difference observed was equivalent to 4.4 per cent water by volume or approximately 0.8 surface cm. for a 15-cm. depth increment. Curve slopes were similar for the soils investigated. Higher count rates were associated with a higher bulk density of the soil. Soils for which the counting rate difference was the greatest, differed 0.3 g./cc. in bulk den-sity. Counting rates for soils of the same series were closely related to bulk density in con-trast to the lack of a relationship among series. The most accurate soil water determinations, by the neutron method, require calibration for the soil in question including the consideration of bulk density changes in the profile.
A high linear correlation between count rate and soil water content was obtained for the 0-to 15-cm. layer. Repeated field determinations of soil water content in the undisturbed 0- to 15-1
1
t
cm. layer can be satisfactorily obtained by calibrating for the particular soil and carefully controlling depth of measurement.
REFERENCES
Holmes, J. W. 1966 Influence of bulk den-sity of the soil on neutron moisture meter calibration. Soil Sci. 102: 355-360.
Holmes, J. W. and Jenkinson, A. F. 1959 Techniques for using the neutron moisture meter. J. Agr. Eng. Res. 4, 100-109.
Marais, P. G. and W. B. de V. Smit. 1960 Laboratory calibration of the neutron moisture meter. S. African J. of Agr. Sci. 3: 581-599.
Marais, P. G. and W. B. de V. Smit. 1962 Effect of bulk density and of hydrogen in
forms other than free water on the cali-bration curve of the neutron moisture meter. S. African J. of Agr. Sci. 5: 225-238. (5) Mortier, P. and DeBoodt, M. 1956
Deter-mination of soil moisture by neutron scat-tering. Netherlands J. Agr. Sci. 4, 111-113. (6) Stolzy, L. H. and G. A. Cahoon. 1957 A
field-calibrated portable neutron rate meter for measuring soil moisture in citrus orchards. Soil Sci. Soc. of Am. Proc. 21: 571-575.
(7) Van Bavel, C. H. M. 1961 Neutron meas-urement of surface soil moisture. J. Geo-phys. Res. 66: 4193-4198.