525
Copyright © 2011-15. Vandana Publications. All Rights Reserved.
Volume-5, Issue-3, June-2015
International Journal of Engineering and Management Research
Page Number: 525-530
Performance Based Design: Case Study
Yernagula.Pratap1, P.V S. Neelima2 1
M. Tech, Civil Engineering Department, Gitam University, Andhrapradesh, INDIA 2
Assistant Professor, Civil Engineering Department, Gitam University, Andhrapradesh, INDIA
ABSTRACT
Earthquakes are inevitable in many parts of the world. The existing research on Indian subcontinent shows that more than 60% of the country’s land is vulnerable to all kinds of earthquakes. Past experience with earthquakes and the eventual damage to the structures suggests that the seismic risk in urban areas is more and the infrastructure facility is far from socio-economically acceptable levels. It is an evident fact that these earthquakes caused large destruction to the infrastructure and buildings in the past. In this scenario, designing an earthquake resistant building/structure is the greatest challenge for a design engineer. Designing a building for earthquake resistance according to the present standard code of practice revealed its insufficiency in providing complete resistance during earthquakes. Performance based design, comparatively a new technology over strength based design suggested in standard Indian code, is a design procedure followed to achieve realistic behavior of the building/structure and eventually resulting in a reliably accurate earthquake resistant design. The performance based design utilizes “static nonlinear pushover analysis” as a tool to estimate the nonlinear capacity of the building/structure.
In the present study, an attempt is made to understand the procedure and methodology adopted in performance based design and its implications to achieve an earthquake resistant design. A G+4 storey commercial building, assumed to be situated in seismic zone IV (according to IS: 1893(part1)-2002), is considered for the case study. Static nonlinear pushover analysis is performed to estimate the capacity of the building represented in the form of a pushover curve. Five performance levels, based on the criteria for earthquake resistant design, are defined for the building. The hinge mechanism obtained in each step of the pushover, is studied to obtain a desired performance level.
Keywords---- Strength based design (SBD), Performance based design (PBD), Static Non-linear Pushover analysis, Capacity curve, Demand curve, Hinge mechanism
I.
INTRODUCTION
Earthquakes are the most unpredictable and devastating of all the natural disasters known till date. According to the existing standard code of practice IS: 1893(part-1)-2002, more than 60% of existing land is vulnerable to different kinds of earthquakes. Earthquake loads are required to be carefully modeled so as to assess the real behavior of structures with a clear understanding that damage is expected but it should be regulated. Seismic performance defines a structure’s ability to sustain it main functions, such as its safety and serviceability, at and after a particular earthquake is exposure. Basic concepts of the earthquake engineering is implemented in major building codes, assume that a building should be survive a rare, severe earthquake by sustaining significant damage but without globally collapse. On the other hand, it should remains operational for more frequent, but less severe seismic events. A structure is normally considered safe if it does not endanger the lives and well-being of those in or around it by partially or completely collapsing. A structure may be considered be serviceable if it is able to fulfill its operational functions for which it was designed. Engineers need to know quantified level of the actual or anticipated seismic performance associated with the direct damage to an individual building subject to a specified ground shaking. Such an assessment may be perform either experimentally or analytically. Indian buildings over past two decades are seismically deficient because of lack of awareness regarding seismic behavior of structures. Performance based design is a new tool in the seismic design philosophy. Performance-based methods require reasonable estimates of inelastic deformation or damage in structures which are better quantities to assess damage than stress or forces.
526
Copyright © 2011-15. Vandana Publications. All Rights Reserved.
the buildings designed for earthquake proof get damagedeven during the rare but strong earthquake, such building will be too robust and also too expensive. On the other hand, those buildings designed for earthquake resistance get damaged as controlled by the designer but prevented against collapse. In a way, the ductility of the structural members can be utilized in their nonlinear state to resist the sudden impulses induced due to earthquake. The strength based design for providing earthquake resistance as adopted in Indian standard code converts the nonlinear behavior of the structural member to linear with the help of nonlinear parameters when subjected to earthquake forces. Though this procedure gives a reliable design for the building to resist earthquakes, the actual nonlinear properties of the building are not taken into consideration. Hence a more reliable technique to understand the behavior of the building in the nonlinear state is required to be adopted in the design procedure for accurate results.
II. SBD vs. PBD
Strength based design and performance based design are two methods to design a building such that the building is able to resist the impulsive forces caused by the earthquake. SBD for “life safety” performance level always prevails under all hazard levels. This basic approach of earthquake resistant design is based on lateral strength as well as deformability and ductility capacity of structure with limited damage but no collapse. Strength based design does not design the building for its changing behaviour when it enters into nonlinear state when subjected to earthquakes. Performance based is an elastic design methodology done on the probable performance of the building under input ground motions [1]. PBD explicitly is the evaluation of how a building is likely to perform, given the potential hazard and uncertainties in assessment of the actual building response. It is mainly about identifying and assessing the performance capability of a building. Moreover, PBD understands the behavior of the building when it enters into nonlinear state during its lateral deformation.
Rehan (2014) performed performance based design on a five storey symmetrical building using SAP 2000. He used pushover to estimate the capacity and inelastic design spectrum as the demand and the graphical intersection of the two curves approximates the performance point of the structure. The building is subjected to three earthquakes of different PGA levels and a parametric study is carried out. The base shears and storey displacements are compared in all the three. It is observed that in all the three analysis, with increase in PGA the rod displacement increases. By studying the effect of reinforcement in columns, it is observed that with the increase in reinforcement increases the base shear and decreases the roof displacement [2]. Sejal et al. (2011) has done a state of art literature review on performance based
seismic design procedure and its implications in practical applications. He also describes the improvements of PBSD as performance based plastic design (PBPD) for the application into standard codes of practice. He suggests that it is important to note that in the PBPD method, control of drift & yielding is built into the design process from the very start, eliminating or minimize the need for lengthy iterations to arrive at the final design [3].
III. Description of Structure
The considered structure is a G+4 storey commercial RC framed building designed for gravity loads according to IS: 456-2000 and is assumed to be located in zone IV. Material properties is assumed to be as M20 grade of concrete and Fe415 for yield strength for longitudinal and transverse reinforcement. The other details of the structure are shown in the Table 1 and the architectural plan is shown in Figure 1. For simplicity in modeling and analysis, a single 2D frame is considered from the 3D structure and analysis is carried out and is as shown in figure 2.
Table 1 Details of the structure
DESCRIPTION
Seismic zone IV Zone factor 0.24 Number of storey G+4 Floor height 3.0m Base floor height 3.0m
Wall thickness external -230mm internal -230mm Size of beams
Size of columns
527
Copyright © 2011-15. Vandana Publications. All Rights Reserved.
Figure 1 Architectural plan of the building consideredFigure 2 2D frame of the structure considered for analysis
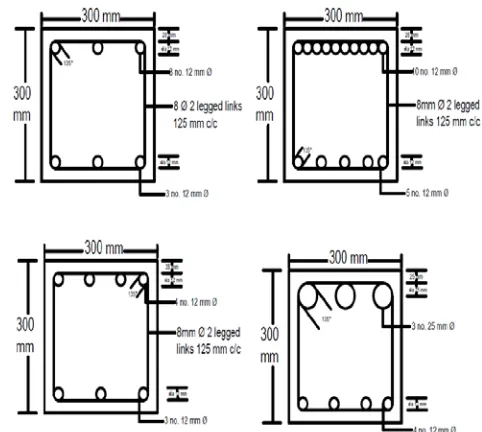
The structure is designed for gravity loads applied on IS: 875 using standard software Staad Pro v8i and the typical beams and columns designed are obtained and are as shown in figure 3 and figure 4.
Figure 3 Typical beams designed for gravity loads
Figure 4 Typical columns designed for gravity loads
528
Copyright © 2011-15. Vandana Publications. All Rights Reserved.
Figure 5 Flowchart describing the sequence of steps inPBD
IV. CAPACITY CURVE
In Nonlinear analysis the hinge mechanism will be used. The Nonlinear material behavior which is only used to develop the moment rotation or response curves for hinges. Hinges have a rigid plastic behavior placing in hinges a model composed of framed elements should not be alter elastic stiffness of the model. The effective strength of the hinges is used for the deformation controlled. The Pushover analysis is carried out either user defined non-linear hinge properties or default hinge properties is available in sap2000 software based on FEMA 356 and ATC 40 codes. The uses needs to be careful of hinge properties may leads to unreasonable displacement capacities for structures. SAP2000 provides hinge properties as P-M hinges for columns and M3 hinges for beams.
Calculation of Hinges on Beams and Columns:
Lp =0.5H (or) Lp=0.08L+0.022 fy dbl ≥ 0.044 fye dbl
( & ( = relative hinge locations on beams & columns
( = relative hinges lengths in beams and columns
where, LP =Plastic hinge length fy =Yield strength of steel
dbl =Diameter of longitudinal reinforcement
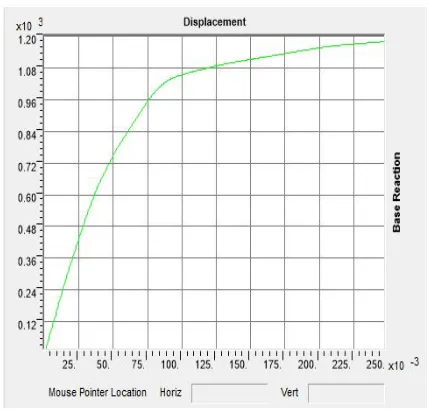
Applying the lateral target displacement monotonically in several steps resulted in a pushover curve and is shown in Figure 6.
Figure 6 Pushover curve for gravity designed building
V. DEMAND CURVE
Elastic designed spectrum given in Indian standard code for earthquake resistant design is considered as demand spectrum corresponding to seismic zone IV.
VI. PERFORMANCE POINT
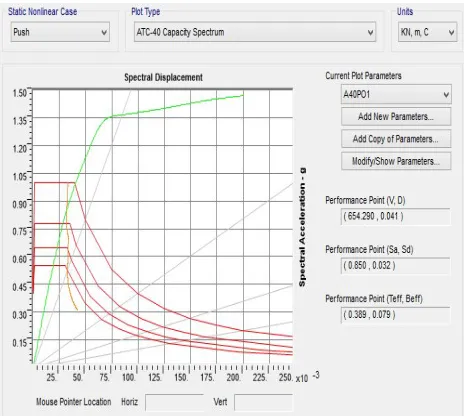
The capacity curve and the demand curve are graphically plotted in a single graph in Acceleration Displacement Response Spectrum (ADRS) to obtain the performance point. The ADRS format of capacity and demand curve is shown in figure 7. The plastic hinge formation at the end of the pushover analysis is shown in figure 8.
529
Copyright © 2011-15. Vandana Publications. All Rights Reserved.
Plastic hinges formation for the building has beenobtained at the different displacement levels. The hinge formation is plotted at different levels. The plastic hinges formation starts with beam ends and columns of lower stories then it propagates to upper stories and continues with yielding of intermediate columns in upper stories. Building may be economic repair. In 1st iteration process the base column is collapse indicated by color yellow so we have to retrofit the base column. In the 1st storey some beams are under collapse and some beams are in the life safety and immediate occupancy. So we have to retrofit the beams.
Figure 8 Hinge mechanism at the ending of pushover analysis
In 2nd Iteration process the retrofitted the base column, by increasing the reinforcement of bars the base columns are in Between LS &CP so no failure is occurred .In the 1st storey the beam is under collapse so we have to retrofit the failure beams only. Figure 9 and figure 10 show the capacity spectrum representation of 2nd iteration and the hinge mechanism of the 2nd iteration respectively.
Figure 9 Capacity spectrum curve for 2nd iteration in design
Figure 10 Hinge mechanism for 2nd iteration in design
Similarly, the results for the third iteration are shown in figure 11 and figure 12.
Figure 11 Capacity spectrum curve for 3rd iteration in design
Figure 12 Hinge mechanism for 3rd iteration in design
530
Copyright © 2011-15. Vandana Publications. All Rights Reserved.
frame is under good earthquake resistance by usingPerformance based design.
VII. CONCLUSIONS
1. The pushover analysis is a simple way to find out the Non-linear behavior of the building
2. In present study the most of the hinges where developed in the beams and few in columns but with limited damages.
3. Performance increase on increasing reinforcement of columns & beams and it resulting into an appreciable decrease in the roof displacement. 4. The increasing the reinforcement of columns we
find out the maximum increase in base shear. 5. Performance of building decreases when the
sectional size of beams and columns are with same reinforcement.
6. The performance based seismic design obtained by above procedure satisfies the acceptable criteria of Immediate occupancy, life safety of the building under various intensity of earthquake. 7. The performance based seismic design which
leads small reduction in steel reinforcement as compared to code seismic design as per (IS 1893 (Part-1):2002) obtained by Staad pro
REFERENCES
[1] P.Poluraju and S.Naga sujani, “Determination of performance level G+5 building situated in zone III using pushover analysis by SAP 2000”, Journal of Engineering Research and Applications (IJERA) ISSN: 2248-9622 Vol. 2, Issue 2, Mar-Apr 2012, pp.832-837.
[2] Dr. S. N. Tande, "Performance based inelastic seismic analysis of buildings", International journal of latest trends in engineering and technology (IJLTE), Vol. 2, July 2013, ISSN: 2278-621X.
[3] Sofyan. Y. Ahmed, "Seismic Evaluation of Reinforced Concrete Frames Using Pushover Analysis", Journal of Al-Rafidain Engineering, Vol.21, No. 3, June 2013.
[4] Swajit Singh Goud and R Pradeep Kumar, "Rationalizing Response Reduction Factor (R) for better Performance of Reinforced Concrete Framed Buildings" Two Day National Conference on Recent Research Advances In Civil Engineering (RRACE – 2014), 7th – 8th
[7] Mehmet Inel " Effects of plastic hinge properties in nonlinear analysis of reinforced concrete buildings" Engineering Structures, 28 (2006), 1494–1503.
NOVEMBER, 2014.
[5] Sujit Kumar, Dr. Vivek garg ,Dr.Abhay Sharma “ Effect of sloping ground on structural performance of rcc building under seismic load”, International journal of science ,engineering and technology vol. 2, issue. 6, August 2014.
[6] K. Soni Priya, T. Durgabhavani, International Journal of Recent Technology and Engineering (IJRTE) ISSN: 22776-3878, Volume-1, Issue-1, April 2012.