ISSN 0975-928X
Research Article
Evaluation of selection indices for drought tolerance in some bread wheat
genotypes
J.M. Patel*1, A.S. Patel 1, C.R. Patel 1, A.G. Pansuria2, R.M. Patel1 and L.G. Vanapariya2
1
Wheat Research Station,S.D.Agricultural University,Vijapur -382 870, India
2
Wheat Research Station,Junagadh Agricultural University, Junagadh
E-mail: [email protected]
(Received: 27 April 2017; Revised: 08 Aug 2017; Accepted: 17 Aug 2017)
Abstract
This study was undertaken to evaluate various selection indices of moisture stress and their applicability in identifying drought stress tolerant wheat genotypes which can acclimatize to various moisture stressed environments in different wheat growing agro climatic zones of Gujarat. Advance lines of wheat genotypes were tested under moisture stress condition of different irrigation regimes. Two sets of irrigation regime i.e one set as irrigated and second as limited irrigation. Ten wheat advance lines along with five check varieties were tested for water stress tolerance at two locations representing North Gujarat and Saurashtra region. Stress intensity at both the locations was markedly differed which indicates differences in soil type, properties and environmental conditions. On the basis of this study, it can be concluded that along with SI, the use of stress indices follows the order of DSI, STI, MP and GMP for selection of drought tolerant genotypes under stress conditions and they may be used to screen wheat varieties tolerant to moisture stress conditions. On the basis of findings of these indices wheat varieties GW 487, GW 488 anf GW 173 were found having higher stress tolerance and with better yield potential under both normal and restricted irrigation conditions. The irrigation criteria under stress condition at Junaghadh location may be revised.
Key words
Stress intensity, Grain yield, Moisture stress indices,Wheat
Introduction
Wheat is a foremost staple food crop of India and plays a vital role for stability of country’s economy and people’s food requirement.. It has been grown in a wide range of arid and semi-arid areas, where drought occurs frequently because of rainfall fluctuations in rain-fed regions and water scarcity in irrigated regions. Drought stress tolerance is a complex trait that is obstructed by low heritability and deficiency of successful selection approaches. Therefore, selection of wheat genotypes should be adapted to drought stress. In addition, drought tolerance mechanism should be identified during the development of new cultivars in order to increase the productivity. Shortage of water has remained a consistent problem for the farmers over past few years and different agronomic techniques have been introduced into the limelight. The relative yield performance of genotypes in drought-stressed and favourable environments seems to be a common starting point for the identification of desirable genotypes for unpredictable rainfed conditions (Mohammadi et al.(2011). Evaluating performance of bread wheat lines and predicting drought tolerance is an essential part of the breeding process. The ability of wheat varieties to execute reasonably well under variable water stress is an important trait for production stability under water stress conditions. Several drought stress indices, such as stress tolerance (TOL) (Rosielle and Hamblin 1981), mean productivity (MP) (Mc Caig and Clarke,(1982), geometric mean productivity (GMP) (Ramirez and Kelly,(1998), drought
susceptibility index (DSI) (Fischer and Maurer,(1978), stress tolerance index (STI) (Fernandez, G.C.J.(1992), have been suggested to identify varieties with better stress tolerance. These indices are efficient in identifying high yielding genotypes under moisture stress conditions (Talebi
et. al., 2009) and are identified as reliable criteria to select varieties for terminal drought stress condition. Huang (2000) established mathematical relationship between stress tolerance (TOL) and stress indices (MP, SSI, GMP and STI) under various water stress regimes. It has been suggested that a larger value of TOL and SSI show relatively more sensitivity to stress, therefore, a smaller values of TOL and DSI should be favoured while selecting stress tolerant varieties. Varieties with an SSI of less than a unit are drought resistant, since their yield reduction under drought condition is smaller than mean yield reduction of other varieties Stability of grain yield for each genotype is estimated by the drought susceptibility index (DSI), derived from the yield difference between stress and non stress environments. The present study was undertaken with the objective to compare and evaluate various selection indices of moisture stress tolerance and to identify the high yielding wheat varieties having higher ability to tolerate under drought stress conditions than that of normal conditions.
Materials and Methods
Electronic Journal of Plant Breeding, 8(3): 834-841 (September 2017)
ISSN 0975-928X DOI: 10.5958/0975-928X.2017.00133.8
research station, Junagadh representing Saurastra region. Both the locations are indicative of erratic and low rainfall during kharif season. The agro-climate of the location is characterized by semi arid conditions with hot dry summer (March-June), wet monsoon season (July-October) and cool dry winters (November-February).
The crop season received no rainfall at both the locations. The soil texture of experimental field was loamy sand with pH value 7.43 and EC 0.29 ds m-1 at Vijapur and vertisol, shallow land at Junagadh. Existing cropping pattern is cotton/groundnut-wheat rotation
The experiment was conducted in Randomised Complete Block Design with three replications using fifteen genotypes. Different irrigation levels
i.e., normal and restricted irrigations were arranged in two different sets. Under normal irrigation treatment five irrigations were provided as per standard recommendations (crown root initiation stage, late tillering stage, late jointing stage, flowering stage, and dough stage). Under restricted irrigation treatment only two irrigations, first at crown root initiation stage (21-25 DAS) and second at boot leaf stage (50-55 DAS), were given. Fifteen genotypes were included in the study material in which genotype GW 173 is drought and heat tolerant and used as check for drought and heat tolerant screening nurseries whereas, genotype GW 11 is a released variety for restricted irrigation conditions. The rows of 6-m length were spaced 20- cm apart. Recommended dose of fertilizers (120:60:00 kg N:P2O5:K2O ha
-1
) were applied. Full dose of phosphorus and 1/2 dose of nitrogen were applied as basal and remaining 1/2 nitrogen was applied with second irrigation. Data were recorded for different parameters according to standard procedures. Yield was taken from 10 m2 plot (5.0 m length and 2.0 m width). Grain samples were randomly taken from each set and 1000 grains were counted with Contador seed counter and weighed. Different stress tolerance indices namely, STI, MP, TOL GMP and DSI were calculated as per the formula mentioned below:
(1)SI (stress intensity) = [1-(Ysi/Ypi)]
(Fischer and Maurer, 1978)
Where, Ysi= Total mean (overall mean across
genotypes) yield under stress condition; Ypi= Total mean (overall mean across
genotypes) yield under normal condition
(2) DSI (drought stress index)= DSI=[1-(Yd/Yw)/D] (Fischer and Maurer, 1978)
where Yd=mean yield under drought, Yw=mean yield under well-watered conditions and D=environmental stress intensity=1-(mean yield of all genotypes under
drought/mean yield of all genotypes under well-watered conditions).
(3) STI (stress tolerance index) = (Ypi*Ysi)/Yp2
(Fernandez, G.C.J. 1992)
(4) MP(Mean Productivity) = (Ypi+Ysi)/2 (Mc Caig and Clarke, 1982)
(5) TOL (stress tolerance) = Ypi-Ysi (Rosielle and
Hamblin, 1981)
(6) GMP (geometric mean productivity)= √Ys*Yp
(Ramirez and Kelly, 1998)
Statistical calculations and calculation of quantitative index of drought sensitivity and simple correlation was done by SAS software (Version 9.2).
Results and Discussion
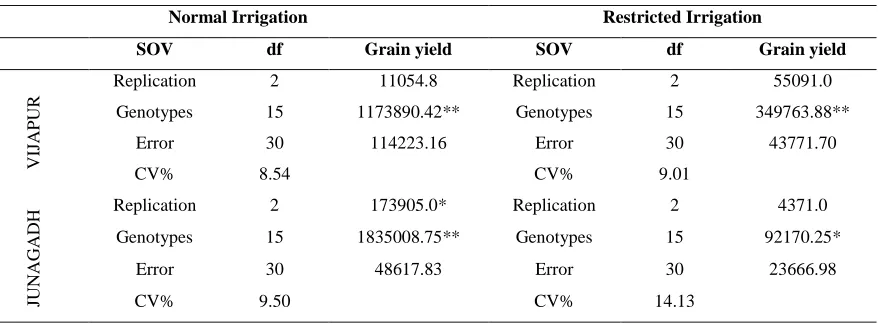
Results revealed that there was considerable variability among varieties for water stress tolerance under both water stressed and normal moisture conditions. The ANOVA showed significant difference for yield under non-stress (Ypi) and stress (Ysi) conditions (Table 1), which indicates that genotypes are differing for stress tolerance.
Stress Intensity: At Vijapur location the yield reduction was almost half of the irrigated condition as it stress intensity was measured as 0.42, whereas at Junagadh stress intensity was 0.73 which implies that yield reduction under stress condition was two third as compared to irrigated conditions. This is due to effect of soil type which is calcareous and shallow land which requires frequent but light irrigation. Generally on an average nearly 15 irrigations are applied under well irrigated conditions whereas we applied only three irrigations under limited regime condition. Thus more yield gap was observed at Junagadh location. The stress intensity index can take value between 0 and 1. The larger value of stress intensity (SI) indicates more severe stress conditions. Mean yield of genotypes under normal irrigated condition(Ypi) was 40.69 q-ha at Junagadh and 39.70 q-ha at Vijapur location, whereas under stress condition(Ysi) it was 19.79 q-ha and 22.97 q
-ha respectively.
ISSN 0975-928X
Stress Tolerance (TOL): A larger value of TOL show more sensitivity to stress, thus a smaller value of TOL is favored. At vijapur location,the lowest TOL values were recorded for varieties GW 477 (5.03), GW 487 (6.76) and GW 173 (7.58). The higher TOL values were obtained in variety GW- 485 (25.63), GW 480 (24.23) and GW 322 (22.45) (Table 2). On comparison value wise same trend was observed more or less at Junagadh location also. Larger the TOL value, larger the yield loss under stress conditions and higher sensitivity to drought. Selection of genotypes based on TOL favours genotypes with low yield potential and higher yield under stress conditions . GW 477, GW 487, and GW 173 genotypes were the smallest TOL, so were the best cultivars based on this index. Similar findings were observed by Meena et al.(2015) (Fig. 1)
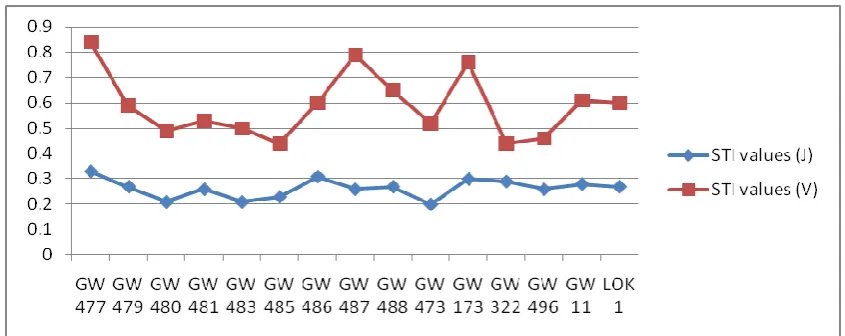
Stress Tolerance Index (STI): The higher STI values caused higher stress tolerance and yield potential. The highest values of STI was obtained for genotypes GW 477(0.84) followed by GW 487 (0.79) GW 173 (0.76) and GW 11 (0.61) at Vijapur location. (Fig.2). The STI values were also reflected due to shallow land at Junagadh location , so lower values of STI were observed in which highest values were recorded by GW 477 (0.33) followed by GW 486(0.31) and GW 173(0.30) so were selected by this index (Table 2). Generally, STI and GMP help in identification of genotype which yields well under both stress and non stress condition.
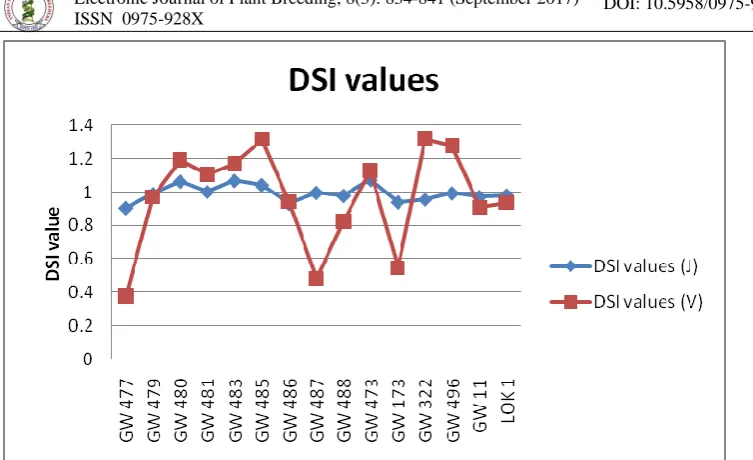
Drought Susceptibility Index (DSI): The drought susceptibility index helps in identifying the genotype, which has less reduction in grain yield under stress conditions compared to normal condition. Genotypes with low DSI values (less than 1) can be considered to be drought resistant (Bruckner and Frohberg,(1987), because they exhibited smaller yield reductions under water stress compared with well-watered conditions than the mean of all genotypes Location wise GW 173 had the lowest reduction in yield at Vijapur location. Among the genotypes tested at two locations overall GW 477 had the smallest DSI index (0.63) followed by GW 173(0.74), GW 487 (0.74), so these were the selected genotypes by this index (Table 2 and fig. 3). These findings were in accordance with other workers who explained that varieties with an DSI of less than 1 unit are drought resistant (Hasan Killic et al.(2010).The mean RY values under imposed well-watered and water stress treatments were 0.81 and 0.74 at Junagadh and 0.82 and 0.82 at Vijapur location respectively .
Mean Productivity (MP): Mean Productivity
favours higher yield potential and lower stress tolerance. Therefore, selection based on MP may not be providing genotypes with increased yield in
stress conditions. Value for GW 479 was the highest (34.24) and significantly more than all other varieties followed by variety GW 480 (33.31) (Table 2 and fig. 4). Hence, these were the best genotypes based on this index. MP is based on the arithmetic means and therefore, it may have an upward bias due to a relatively larger difference between Ypi and Ysi. Generally higher MP value is indicator of genotypes with higher yield potential. Whereas the geometric mean (GMP) is less sensitive to extreme values. GMP values recorded were highest in variety GW 479 (49.6) followed by GW 483 (34.08) and GW 480(34.02) at Vijapur location where as at Junagadh location GW 322(26.51) recorded higher values of GMP followed by LOK 1(24.79) and GW 479(24.69). Table 2 and fig. 5)
Significantly positive correlation of Ypi and Ysi (r=0.69 p<0.05) was found which indicates that high yield performance under favourable condition resulted in relatively high yield under stress conditions. The observed relationships in our wheat genotypes were consistent with those reported by Ali et al. (2016). It was interesting to note positive correlation between STI and Ypi (0.69 & 0.66, p<0.001) indicating that STI was positively correlated with non-stressed yield. This finding suggested that some traits that contribute to yield potential may act to increase tolerance to stress. Positive correlation between, Ypi and MP (0.91 & 0.95, p<0.001) Ysi and MP (0.91 & 0.84, p<0.001), Ypi and GMP (0.89 & 0.88, p<0.001) and Ysi and GMP (0.93 & 0.92, p<0.001) were obtained during the course of study (Table 3). Positive correlation of TOL with MP (0.94 & 0.63, p<0.001), TOL and DSI (0.76 & 0.95, p<0.001) was observed in this study. Positive correlation of MP with GMP (0.99 & 0.91, p<0.001) were observed (Table 3).
Electronic Journal of Plant Breeding, 8(3): 834-841 (September 2017)
ISSN 0975-928X DOI: 10.5958/0975-928X.2017.00133.8
GW 477 could be consider as superior wheat genotypes with higher stress resistance and comparatively better yield potential under both irrigated and stress conditions.
References
Ali M.B. and El-Sadek A.N. 2016 Evaluation of drought tolerance indices for wheat (Triticum aestivum L.) under irrigated and rainfed conditions.
Communications in Biometry and Crop Science,
11: 77–89.
Bruckner, P.L. and Frohberg, R.C. 1987. Stress tolerance and adaptation in spring wheat. Crop Sci., 27: 31-36.
Fernandez, G.C.J. 1992. Effective selection criteria for assessing plant stress tolerance. In: Kuo C.G. (Ed.), Proceedings of the International Symposium on Adaptation of Vegetables and Other Food Crops in Temperature and Water Stress, Publication, Tainan, Taiwan.
Fischer, R.A. and Maurer, R. 1978. Drought resistance in spring wheat cultivars: 1. Grain yield response. Aust J Agric Res.,29: 897-912. Huang, B. 2000. Role of root morphological and
physiological characteristics in drought resistance of plants. In: Wilkinson, R. E. (ed.). Plant-Environment Interactions. Marcel Dekker Inc., New York, pp. 39-64
Kiliç, H. and Yağbasanlar, T. 2010. The Effect of Drought Stress on Grain Yield, Yield Components and some Quality Traits of Durum Wheat (Triticum turgidum ssp. durum) Cultivars/ Not. Bot. Hort. Agrobot. Cluj.,38(1): 164-170
Mardeh, A.S., A. Ahmadi, K. Poustini and V. Mohammadi. 2006. Evaluation of drought resistance indices under various environmental conditions. Field Crop Research, 98: 222-229. McCaig, T.N. and Clarke, J.M. 1982. Seasonal changes
in nonstructural carbohydrate levels of wheat and oats grown in semiarid environment. Crop Science, 22: 963-970
Meena, R.P., Tripathi, S.C., Chander, S., Chookar, Msamrutha R.S.A. Verma and Sharma, R.K. 2015. Identifying drought tolerant wheat varieties using different indices SAARC J. Agri.,
13(1):148-161
Mohammadi, R., Davood Sadeghzadeh E., Mohammad, A. and Ahmed, A. 2011. Evaluation of durum wheat experimental lines under different climate and water regime conditions of Iran. Crop & Pasture Sci.62: 137–151
Ramirez, P. and Kelly, J.D. 1998. Traits related to drought resistance in common bean. Euphytica,
99: 127-136
Rosielle, A.A. and Hamblin, J. 1981. Theoretical aspects of selection for yield in stress and non-stress environments. Crop Science,21: 943-946 Talebi, R., Fayaz, F. and Naji, A.M. 2009. Effective
selection criteria for assessing drought stress tolerance in durum wheat (Triticum durum).
ISSN 0975-928X
Table 1.
ANOVA for grain yield under normal and restricted irrigation
Normal Irrigation Restricted Irrigation
SOV df Grain yield SOV df Grain yield
VIJ
APUR
Replication 2 11054.8 Replication 2 55091.0
Genotypes 15 1173890.42** Genotypes 15 349763.88**
Error 30 114223.16 Error 30 43771.70
CV% 8.54 CV% 9.01
JUNAGADH
Replication 2 173905.0* Replication 2 4371.0
Genotypes 15 1835008.75** Genotypes 15 92170.25*
Error 30 48617.83 Error 30 23666.98
Electronic Journal of Plant Breeding, 8(3): 834-841 (September 2017)
ISSN 0975-928X DOI: 10.5958/0975-928X.2017.00133.8
Table 2. Stress tolerance indices in wheat varieties for crop season 2015-16
Ypi: Yield under Normal Conditions TOL: Stress Tolerance SSI: Stress Susceptibility Index MP: Mean Productivity; STI: Stress Tolerance Index Ysi: Yield under Stress Conditions GMP: Geometric Mean Productivity V; Vijapur J: Junagadh
Varieties Ypi (q ha
-1) Ysi (q ha-1) TOL STI SSI MP GMP
V J P V J P V J P V J P V J P V J P V J P
GW 477 31.53 33.20 32.37 26.50 11.08 18.79 5.03 22.12 13.58 0.84 0.33 0.59 0.38 0.91 0.64 29.02 22.14 25.58 31.53 33.20 32.37
GW 479 48.23 47.35 47.79 28.50 12.88 20.69 19.73 34.47 27.10 0.59 0.27 0.43 0.97 0.99 0.98 38.37 30.12 34.24 48.23 47.35 47.79
GW 480 48.23 50.13 49.18 24.00 10.88 17.44 24.23 39.25 31.74 0.50 0.22 0.36 1.19 1.07 1.13 36.12 30.51 33.31 48.23 50.13 49.18
GW 481 42.13 46.36 44.25 22.50 12.18 17.34 19.63 34.18 26.91 0.53 0.26 0.40 1.11 1.00 1.05 32.32 29.27 30.79 42.13 46.36 44.25
GW 483 47.80 48.50 48.15 24.30 10.36 17.33 23.5 38.14 30.82 0.51 0.21 0.36 1.17 1.07 1.12 36.05 29.43 32.74 47.80 48.50 48.15
GW 485 46.33 41.83 44.08 20.70 9.73 15.22 25.63 32.10 28.87 0.45 0.23 0.34 1.31 1.04 1.18 33.52 25.78 29.65 46.33 41.83 44.08
GW 486 40.97 29.10 35.04 24.70 9.15 16.93 16.27 19.95 18.11 0.60 0.31 0.46 0.94 0.93 0.94 32.84 19.13 25.98 40.97 29.10 35.04
GW 487 33.06 31.67 32.37 26.30 8.44 17.37 6.76 23.23 15.00 0.80 0.27 0.53 0.49 1.00 0.74 29.68 20.06 24.87 33.06 31.67 32.37
GW 488 38.33 31.47 34.90 25.00 8.80 16.90 13.33 22.67 18.00 0.65 0.28 0.47 0.83 0.98 0.90 31.67 20.14 25.90 38.33 31.47 34.90
GW 473 43.30 47.71 45.51 22.70 10.00 16.35 20.6 37.71 29.16 0.52 0.21 0.37 1.13 1.08 1.10 33.00 28.86 30.93 43.30 47.71 45.51
GW 173 32.78 31.44 32.11 25.20 9.69 17.45 7.58 21.75 14.67 0.77 0.31 0.54 0.55 0.94 0.74 28.99 20.57 24.78 32.78 31.44 32.11
GW 322 40.45 48.67 44.56 18.00 14.45 16.23 22.45 34.22 28.34 0.44 0.30 0.37 1.32 0.96 1.14 29.23 31.56 30.39 40.45 48.67 44.56
GW 496 43.30 43.32 43.31 20.00 11.65 15.83 23.3 31.67 27.49 0.46 0.27 0.37 1.28 0.99 1.14 31.65 27.49 29.57 43.30 43.32 43.31
GW 11 31.11 32.66 31.89 19.20 9.30 14.25 11.91 23.36 17.64 0.62 0.28 0.45 0.91 0.97 0.94 25.16 20.98 23.07 31.11 32.66 31.89
ISSN 0975-928X
Table 3. Correlation between various stress tolerance parameters
Ypi Ysi STI MP TOL GMP
Ysi J 0.696** 1.000
V 0.217
STI J -0.696** 0.095 1.000
V 0.699** 0.538**
MP J 0.991** 0.787** -0.533** 1.000
V 0.918** 0.586** -0.362
TOL J 0.983** 0.553** -0.769** 0.949** 1.000 V 0.882** -0.269 -0.950** 0.623**
GMP J 1.000** 0.696** -0.641** 0.991** 0.983** 1.000 V 1.000** 0.217 -0.699** 0.918** 0.882**
DSI J 0.639** -0.099 -1.000** 0.530** 0.767** 0.639** V 0.699** -0.538* -1.000** 0.362 0.950** 0.699** J = JUNAGADH V= VIJAPUR * PEARSON CORRELATION COEFFICIENTS *=0.05 *=0.001*
Fig. 1. TOL values of different genotypes at two locations
Electronic Journal of Plant Breeding, 8(3): 834-841 (September 2017)
ISSN 0975-928X DOI: 10.5958/0975-928X.2017.00133.8
Fig. 3. DSI values of different genotypes at two locations
Fig. 4 MP values of different genotypes at two locations