Evaluation of using digital gravity field models for zoning map
creation
Dmitry Loginov
aa Moscow State University of Geodesy and Cartography (MIIGAiK), Moscow, Russian Federation; [email protected]
Abstract: At the present time the digital cartographic models of geophysical fields are taking a special significance into geo-physical mapping. One of the important directions to their application is the creation of zoning maps, which allow taking into account the morphology of geophysical field in the implementation automated choice of contour intervals. The purpose of this work is the comparative evaluation of various digital models in the creation of integrated gravity field zoning map. For comparison were chosen the digital model of gravity field of Russia, created by the analog map with scale of 1:2 500 000, and the open global model of gravity field of the Earth – WGM2012. As a result of experimental works the four integrated gravity field zoning maps were obtained with using raw and pro-cessed data on each gravity field model. The study demonstrates the possibility of open data use to create integrated zoning maps with the condition to eliminate noise component of model by processing in specialized software systems. In this case, for solving problem of contour intervals automated choice the open digital models aren’t inferior to regional models of gravity field, created for individual countries. This fact allows asserting about universality and independence of integrated zoning maps creation regardless of detail of a digital cartographic model of geo-physical fields.
Keywords: Zoning maps, Gravity field, WGM, Digital geophysical models, Integrated map
1.
Introduction
The digital cartographic models of geophysical fields are one of the main sources of information for geophysical maps creation, development of GIS projects and GIS atlases, etc. The matrix format of data allows the use it for many purposes of geophysical mapping, including the creation of zoning maps, which allow taking into account the morphology of geophysical field in the implementation of contour intervals automated choice. The problem of contour intervals choice is one of the main issues of modern geophysical mapping (Loginov, Krylov, 2015). If precision and scale of survey are the main factors influencing to choice of interval between isolines for large-scale maps, then for medium and small-scale maps the need for reliable transmission of field character and preservation its distinctive features and morphology comes to the fore. Therefore, contour interval is often selected based on specialists’ experience, thus the majority of small-scale geophysical maps are characterized by unjustified individuality of style. The accounting of field character, which can define with zoning maps, may help to solve this problem.
In previous research author was proved the usefulness of zoning maps application to solve problem with creating of integrated zoning maps, where the certain value of isolines interval, more optimal for displaying of isolines con-figuration within the region, is assigned for each of detected regions with depends from its morphological features (Loginov, 2016). The similar type of presentation as integrated zoning map allows can uniquely apply the recommendations on the optimum value for each region. However, the creation of such integrated zoning maps
free access, to obtain reliable information on the distribution of field at mapping area.
The purpose of this work is the comparative evaluation of various digital models in the creation of integrated gravity field zoning map. For comparison next data were chosen:
1)The digital model of gravity field of Russia (further in text – RGM). This model was compiled from analog map of gravity field of USSR with scale of 1:2 500 000. The data was processed with special techniques, corrected with Bouguer reduction and interpolated to nodes of regular matrix 2 х 2 km (Erinchek, Litvinova, 2010).
2)The World Gravity Map WGM2012 (further in text – WGM). This global model of gravity field of Earth include high resolution grids and maps of the Earth's gravity anomalies (Bouguer, isostatic and surface free-air), computed from the available Earth global gravity models EGM2008 and ETOPO1 model and include 1'x1' resolution terrain corrections (Bonvalot, S., Balmino, G., et al, 2012). The model of Bouguer gravity anomalies with 2'x2' resolution was used in this study.
composing its geological structures that ensure the maximum of possible number of areas in zoning map.
2.
Experimental works
The experimental works are needed to compare results of digital gravity field models usage in solution of problem of creation an integrated zoning maps for contour interval selection. The general scheme of stages includes a zoning of mapped territory and creation of integrated zoning map. The main characteristics of zoning are the intensity and variability of gravity field. Field intensity characterizes morphometric properties of field surface, namely absolute values. The account of it in the formation of color scales for mid and small-scale geophysical maps causes a gradual increase in the intervals between isolines with an increase in the value fields. Field variability characterizes sharp changes of intensity, which are expressed in isolines compression (Loginov, Krylov, 2016). Showing of such sites usually causes the greatest difficulties in preparation of geophysical maps, so this criterion should be considered in the implementation of zoning.
2.1 Assessment of source data
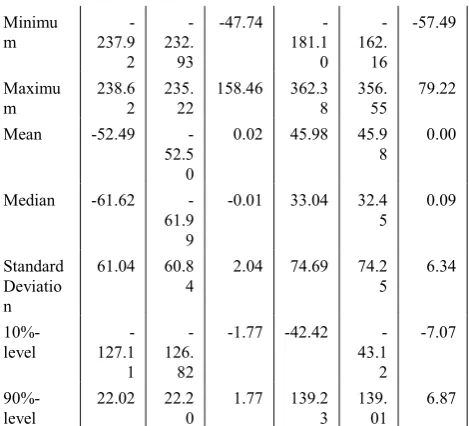
Both factors are directly depend on detail data, because the intensity is determined by absolute values of field, and variability is calculated as standard deviation of field. Therefore, at a preliminary stage we compared the main statistical characteristics of RGM and WGM within territory of Russian Federation (Table 1). Table 1 shows significant differences in minimum and maximum values, and when rendering of gravity field intensity of WGM the noise component is clearly observed, which is to be removed for further research.
The pre-processing of data was to filter data of RGM and WGM with use of specialized software system Certain-ty by Pangea Inc., which is designed to solve various geological and geophysical purposes, including conversion of raw data (Lurie, Kolesov, 2004). The filtering is set by two parameters – Window size (defined how many points will be involved in the averaging, the value is 15) and Power (coefficient, which is included in an exponential weighting function of accounting points along the border of window, the value is 3%). An array of processed data RGM and WGM models was prepared by filtering; its statistical characteristics are shown in Table 1. The filtering is mostly impacted on range of values of intensity WGM: so, the minimum values are becoming higher by 9 mGal, while the RGM minimums are becoming higher by only 5 mGal. In addition, a range of effective values of local components (10% – 90% level) indicates a high degree of noise in WGM model: about 14 units WGM against 3 units RGM.
Statistic al characte ristics
Russian Gravity Model
(RGM) World Gravity Map (WGM) Unfilt
ered Filtered Local compo nent
Unfilt
ered Filtered Local compo nent Count 90592
84 9059284 9059284 9059284 9059284 9059284
Minimu
m 237.9
-2 -232. 93
-47.74 -181.1 0
-162. 16
-57.49
Maximu
m 238.62 235.22 158.46 362.38 356.55 79.22
Mean -52.49
-52.5 0
0.02 45.98 45.9
8 0.00
Median -61.62 -61.9 9
-0.01 33.04 32.4
5 0.09
Standard Deviatio n
61.04 60.8
4 2.04 74.69 74.25 6.34
10%-level 127.1 -1
-126. 82
-1.77 -42.42 -43.1 2
-7.07
90%-level 22.02 22.20 1.77 139.23 139.01 6.87
Table 1. The comparing of statistical characteristics of unfiltered (raw) and filtered (processed) input models
This comparison of input parameters of two gravity field models leads to conclusion in necessary processing WGM model, but to understand how the results of filtering affect the zoning, raw and processed data of RGM and WGM are used in further work.
2.2 Comparison of digital models for zoning of gravity field
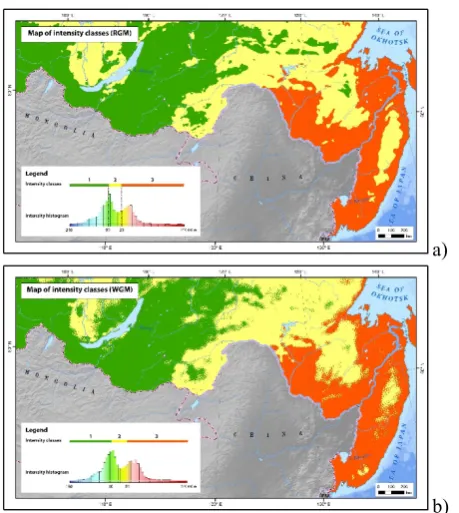
Differences of models are offset by the nature of its use in solving problem. The maps of intensity and variability classes are created for zoning in preliminary step. Further examples of zoning map creation are presented for raw data of RGM and WGM.
a)
b) Fig. 1. Maps of intensity classes with using gravity field models based on: a) raw RGM; b) raw WGM
The creation of variability classes’ map is performed otherwise than the map of intensity classes. The standard deviation, which characterizes the dispersion (degree of diffusion) of field in window (taken window size is 25), was adopted as mathematical analogue of this criterion. In geological studies based on the probabilistic model, the dispersion is the main indicator of variability of objects measured properties. These values have been divided in accordance with the statistical distribution parameters. Thus, values close to the median were selected like upper limit of first range, and lower limit of third range was chosen like sum of median and standard deviation. The result is a map of variability classes (Fig. 2). Figure 2 shows that the classes of variability in raw RGM expressed more brightly then classes of variability on raw WGM, despite the fact that the form of histogram, and the quantitative values of class boundaries generally coincide with the raw WGM. Higher differentiation of class №3, corresponding to high values of variability, that observed on the map (Fig. 2a), allows to allocate more precisely the boundaries of most abrupt transitions of gravity gradient, which is important when choosing a contour interval.
a)
b) Fig. 2. Maps of variability classes with using gravity field models based on: a) raw RGM; b) raw WGM
The maps of intensity classes and variability classes were involved in joint overlay analysis, whose result is the primary zoning maps (class maps) of gravity field. The spatial position of allocated areas was formed at this stage. As a result, the primary zoning map identified nine possible combinations of intensity and variability of the gravity field. However such number of classes is redundant for contour intervals selection, therefore, four regions were identified according to the properties of these classes (Figure 3), and their characteristics were presented in Table 2.
a)
Regions Symbology
Number s of classes
in regions
Intensity Variability
Moderately differentiated negative field
1, 4 Low Low,
Medium
Miscellaneou s
differentiated low negative field
2, 5, 7 Low,
Medium Medium, Low, Hard
Miscellaneou s
differentiated positive field
3, 6, 8 Medium
, High Medium, Low, Hard
Highly differentiated positive field
9 High High
2.3 Creation of integrated zoning maps
In accordance with appointment the grid of nomenclature sheets scale 1: 200 000 (as a base during the geological and geophysical surveys of small and medium scale) was imposed on zoning maps. Analysis of zoning regions distribution was held in each cell. If the region area exceeds total area of other regions more than doubled (that is, a certain dominance of morphological type of gravity field was observed in the mapped area), the number of this region is assigned to entire cell. In the case of presence of multiple regions at mapped area is allowed to carry out additional isolines with retaining of interval which adopted to display dominating type of field. Ambiguous of predominance of one of the classes (less than 70% of cell square) is displayed at integrated zoning map with dashed fill, where background color corresponds to dominant region, dash color – the second largest region. As a result of experimental studies based on each model of gravity field the integrated zoning maps were prepared using unfiltered and filtered data (Figure 4).
a)
b)
c)
d) Fig. 4. Integrated zoning maps based on: a) unfiltered RGM; b) filtered RGM; c) unfiltered WGM; d) filtered WGM
3.
The analysis of results
The results are analyzed in accordance with the following objectives:
− To determine the need for pre-processing of data using specialized software systems
− To identify the use opportunity of global gravity field models in creation of zoning maps
nature of these differences too. Table 3 shows the results of comparing of cell values character differences presented in Figures 4a and 4b, 4c and 4d.
Differenc
es Description Graphic example
Number of cells, changing the
value from raw data to
processed data
RGM WGM
Significan
t The value of cell is replaced from one of the dominant class to another 2 (3.4% ) 12 (16.2 %)
Clarifying The ambiguo us cell value is replaced to dominant value 17 (29.3 %) 31 (41.9 %) Declassin
g The dominant cell value is replaced to ambiguo us value 22 (38.0 %) 20 (27.0 %) Insignifica
nt Inside a cell with a ambiguo us value changes leading class or number of second class 17 (29.3 %) 11 (14.9 %)
Total 58
(9% of all cells) 74 (12% of all cells)
Table 3. Comparing the differences between raw and processed data in two models
Comparisons of results allowed determine the high degree effect of WGM local component on final version of integrated scheme. About 12% of cells changed its values from Fig. 4c to Fig. 4d, and 16.2% of these differences are significant when the dominant class №2 is replaced by class №1. Almost half of differences (41.9%) are clarifying then ambiguous cell value (at map based on raw data) is replaced by dominant value (at map based on processed data). For example such clarifying differences account only for 29.3%, if we using filtrated RGM. This
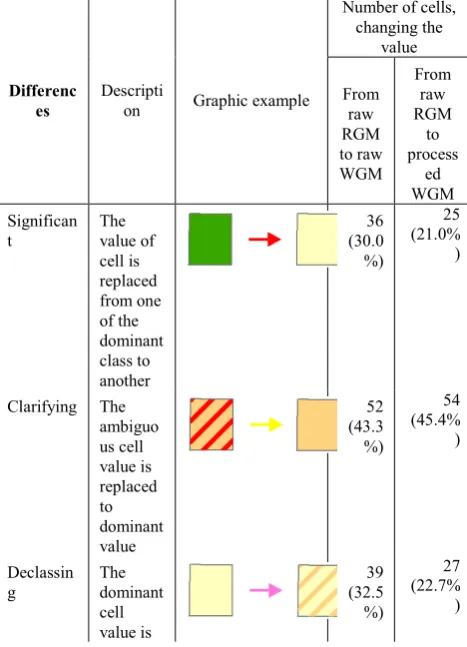
result con-firms the conclusion about necessity of WGM pre-processing with elimination of its local component. In contrast, when using the RGM there are minimal differences, indicating that universality of region models. To implement the second objective integrated zoning maps, based on raw RGM (Fig. 4a) and filtered WGM (Fig. 4d) should be compared. The analysis will determine whether the result depends on whether the map is made on a regional or global gravity field models. As a result, it found about 19% of cells where the values of two maps are different among themselves (Table 4). Among them 21% are significant, and different pairs of classes involved in the differences. The most widely present the clarifying differences (45.4%), when cells value becomes from ambiguous value (at Fig. 4a) to dominant value (at Fig. 4d). This fact is largely due to the fact that ranges of basic statistical characteristics of two models (Table 1) do not match each other, as a result of numerical values of class boundaries are differ between themselves. However, this fact does not fundamentally violates the spatial position of regions, which speaks in favor of chosen technology create zoning maps.
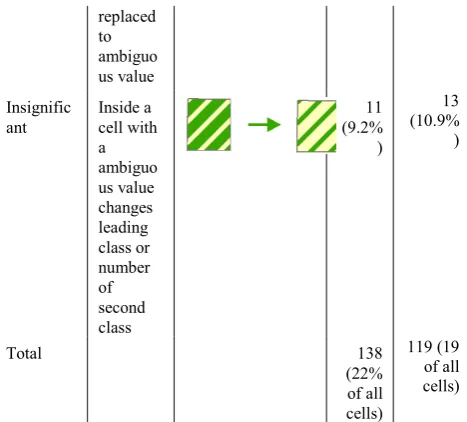
An additional argument in favor of using the processed model WGM stands out when comparing the number and character of differences between the integrated zoning maps, created with raw RGM and raw WGM. Table 4 shows that the use of WGM processed data are significantly reduces the amount of principal differences (9%) along with declassing (9.8%), and the amount of clarifying and insignificant differences increases by a small amount of about 1.5%.
Differenc
es Description Graphic example
Number of cells, changing the value From raw RGM to raw WGM From raw RGM to process ed WGM Significan
t The value of cell is replaced from one of the dominant class to another 36 (30.0 %) 25 (21.0% )
Clarifying The ambiguo us cell value is replaced to dominant value 52 (43.3 %) 54 (45.4% ) Declassin
replaced to ambiguo us value Insignific
ant Inside a cell with a ambiguo us value changes leading class or number of second class
11 (9.2%
)
13 (10.9%
)
Total 138
(22% of all cells)
119 (19 of all cells)
Table 4. Comparing the differences between RGM and WGM Visualization of cells spatial position, values of which are different in two integrated zoning maps Fig. 4a and Fig. 4d, allowed finding a relatively regular distribution of majority differences within the areas inland rift systems and the East Sikhote-Alin volcano-plutonic belt (Figure 5). These areas are geologically most active, which is reflected in values of gravity field, so the quality of integrated zoning maps also depend from the actuality of used digital mod-el. Also the map of differences allows concluding about small degree of difference for most of identified regions – less than a quarter of differences are significant, when different values are assigned to one cell at two maps.
Fig. 5. Map of spatial position of differences between integrated zoning maps based on raw RGM and processed WGM. Grey con-tours – boundaries of geological structures according to Tectonic map scale 1:2 500 000, 2008 (Atlas of geological maps of Central Asia and adjacent areas)
4.
Conclusions
This study demonstrates the possibility of open data use to create integrated zoning maps of gravity field with the proviso to eliminate a noise component of field by processing in specialized software systems. To solve the problem of automated choice of contour intervals the filtered open WGM data can be use to the same extent as regional gravity field models, created for individual countries. This allows us to assert about universality and
independence creation integrated zoning maps from detail of digital model of geophysical field. The presented results of study make it possible to analyze the use of global and regional models of gravity field on other areas, as well as to analyze the use of digital models of other geophysical fields.
5.
References
Bonvalot, S., Balmino, G., Briais, A., M. Kuhn, Peyrefitte, A., Vales N., Biancale, R., Gabalda, G., Reinquin, F., Sarrailh, M. (2012). World Gravity Map. Commission for the Geological Map of the World. Eds. BGI-CGMW-CNES-IRD, Paris DOI
10.1007/s00190-011-0533-4
http://bgi.omp.obs-mip.fr/content/download/1043/7111/file/2011_Balmino _JOGEOD.pdf. Accessed 10 January 2016.
Erinchek Yu.M., Litvinova T.P. (2010). Develop the principles and technology of integral small-scale digital mapping of geophysical fields and create the updated digital cartographic models of the anomalous magnetic and gravity fields of Russia at 1 : 2 500 000 scale. Proceedings of VSEGEI. 2010 year. Vol. 10 (58). – SPb.: VSEGEI Press, 2013. – 272 p. (Rosnedra, VSEGEI).
Loginov D.S., Krylov S.A. (2015). Problems, ways to solution and prospects of geophysical mapping. The Proceedings of the 27th International Cartographic Conference ICC 2015, August 2015, Rio de Janeiro, Brazil. http://www.icc2015.org/trabalhos/32/582/T32-582_1428500757.doc. Accessed 10 January 2016. Loginov D.S., Krylov S.A. (2016). The method of gravity
and magnetic fields zone maps creation as an approach to the choice of iso-line intervals. The Proceedings of 18th Science and Applied Research Conference on Oil and Gas Geological Exploration and De-velopment «Geomodel 2016», 12 - 15 September 2016, Gelendzhik, Russia. DOI: 10.3997/2214-4609.201602183
Loginov D.S. (2016). Verification of regional approach to selection of isolines intervals for gravity field maps. In: Izvestia Vuzov. Geodesy and aerophotosurveying, 2016, vol. 60, #5, pp. 31–36
Lurie M.B., Kolesov V.V. (2004). Metodika postrojeniya strukturnyh kart po dannym bureniaya i kartam geofizicheskih atributov. In: Geofizika, 2004, special,
pp. 15–