The study of life-history theory is of fundamental impor-tance to the analysis of population performance and thus to both theoretical ecology and resource management. Life-history theory is based on the concept of trade-off constraints between alternative energy-consuming func-tions,and the resulting balance between life history traits tends to maximize fitness (i.e. total reproductive output) (e.g. Beverton 1963, Roff 1992, Stearns 1992, Charnov 1993). When various life-history parameters (e.g. growth, maturation and mortality) are plotted against each other for a large number of fish species, clear patterns emerge (e.g. Pauly 1998a, Froese and Pauly 1998). Thus, for in-stance, tropical fishes are smaller, attain their asymptotic sizes faster, have for any given asymptotic size higher natu-ral mortality, and have higher trophic levels than their colder counterparts (Pauly 1998a). Several empirical stud-ies on fishes have shown that some of the emerging pat-terns are consistent with the trade-off concept (e.g. nega-tive correlations between current reproduction and some
component of fitness, usually survival of offspring, mortal-ity and growth: Adams 1980, Pauly 1980, Gunderson and Dygert 1988, Wootton 1990, Jennings and Beverton 1991, Stearns 1992, Roff 1992, Pauly 1998a).
Stergiou et al. (1997)reviewed the available quantita-tive information on the physics, chemistry, biology and fisheries of the Hellenic Seas. The available data clearly in-dicate the highly oligotrophic nature of the subtropical Hellenic waters, with large areas being directly compara-ble, in terms of trophic potential, to open oceans. Since temperature and the quality and quantity of food are among the most important factors affecting phenotypic responses in fishes (e.g. Wootton 1990, Jennings and Bev-erton 1991, Roff 1992), one may predict, based on life-history theory (e.g. Adams 1980, Stearns 1992, Roff 1992, Charnov 1993, Pauly 1998a, Froese and Pauly 1998), that the fish stocks and/or species inhabiting Hellenic waters will be generally smaller in size, have lower longevity, ma-ture at an earlier age and size, and probably suffer higher Web Ecology 1: 1–10.
Life-history patterns of fishes in the Hellenic Seas
Konstantinos I. Stergiou
Stergiou, K.I. 2000. Life-history patterns of fishes in the Hellenic Seas. - Web Ecology 1: 1–10.
The available quantitative information (age, growth, maturation and mortality) for 103 fish stocks in Hellenic Seas was analysed here in the context of life-history theory and compared with similar information from other areas of the world.
The results showed that the fish species and stocks inhabiting Hellenic waters are gener-ally small in size, have low longevity, mature at an early age and size, and probably suffer high adult mortality rates. Such a pattern most probably is an adaptation to the syner-getic combination of highly oligotrophic conditions and high subtropical temperatures prevailing in Hellenic waters and is consistent with life-history theory.
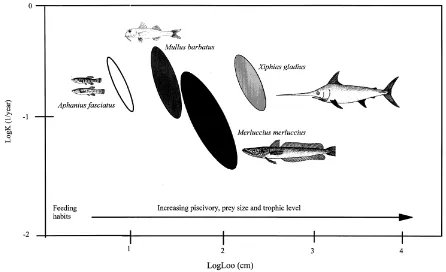
Finally, the auximetric grid was used to compare the growth of four species, each repre-sented by more than six stocks. The results revealed that the growth spaces occupied by the four species reflect their strikingly different feeding habits, especially with respect to the size of prey and the relative importance of fish prey to their diet.
adult mortality rate than their counterparts in other areas of the world.
Fisheries research in Hellenic waters has been conduct-ed on a systematic basis (i.e. properly designconduct-ed seasonal surveys) since the early 1980s within the framework of var-ious projects financed either by National or European Un-ion sources. Stergiou et al. (1997) also reviewed the availa-ble quantitative information on the age, growth, maturity and longevity for 103 fish stocks in the Hellenic Seas. Such information was used here to test the above-mentioned predictions, being compared with similar information from other areas of the world that was used as background.
Material and methods
Data were obtained for the following life-history param-eters for 103 Hellenic fish stocks:
(a) The maximum reported length and age, Lmax and Tmax, in cm and yr respectively.
(b) The female length-at-maturity, Lmat, in cm. (c) The female age-at-maturity, Tmat, in yr.
(d) The von Bertalanffy (1938) growth parameters K, Loo and to, in yr-1, cm and yr, respectively.
(e) The natural and total (i.e. natural plus fishing) mortality rates, M and Z, respectively, in yr-1.
The 103 fish stocks belonged to 40 species, 20 families and 7 orders:
Clupeiformes: 1 stock, 1 species; Lophiiformes: 4 stocks, 2 species; Cyprinodontiformes: 7 stocks, 1 species; Gadiformes: 20 stocks, 7 species; Pleuronectiformes: 8 stocks, 4 species; Scorpaeniformes: 6 stocks, 5 species; and
Perciformes: 57 stocks, 20 species) (see Appendix for species names).
The word “stock” is used here to indicate sets of param-eters corresponding to different sexes, years and areas. The above mentioned parameters were consequently used for the estimation of the relationships between K and Loo, K and Tmax, Lmat and Loo, and Z and Tmax, as well as for the estimation of the Lmat/Loo, and Lmax/Loo ratios. All these rela-tionships and ratios are important in the context of life-history theory (e.g. Beverton and Holt 1959, Longhurst and Pauly 1987, Jennings and Beverton 1991, Stearns 1992, Roff 1992, Charnov 1993, Pauly 1994, 1997, 1998a,b, Froese and Pauly 1998).
The estimation of the parameters reviewed herein has been mainly based on field data derived from experimental seasonal surveys (see Stergiou et al. 1997, for a detailed description). Age and growth have been studied either from readings of various hard elements (i.e., otoliths, scales, and spines) or from length-frequency analysis. Body
length measurements refer mainly to total length (59 stocks) and fork length (35 stocks; standard length was used for 9 stocks only).
Growth in length has been described using the von Ber-talanffy (1938) growth equation, based either on observed or back-calculated length-at-ages. The von Bertalanffy (1938) growth equation is:
Lt=Loo(1-e(-K(t-to)),
where Lt is the length of fish at age t, Loo is the asymptotic length (i.e., the length a fish would reach if it was to grow indefinitely according to the model), K is the growth coef-ficient (the curvature index), showing how fast a fish ap-proaches its Loo, and to is a small negative or positive number representing the age a fish would have at zero length.
Natural mortality rates (M) have been estimated using the empirical formula of Pauly (1980) and Z rates using mainly the length-converted catch-curve (Pauly 1983). Tmat was estimated by the present author from the Lmat val-ues and the corresponding von Bertalanffy parameters. Data on Loo, K, female Lmat, and female Lmat/Loo for a wide variety of fish species from other areas of the world were also extracted from FishBase 98 (The PopGrowth table: Binohlan and Pauly 1998; The Maturity table: Binohlan 1998), the largest computerised encyclopaedia of fishes. Such data are documented in FishBase tables via a link to the reference from which the parameter values were ex-tracted (Froese and Pauly 1998) and are very useful in life-history studies (Pauly 1998a, Pauly et al. 1998).
confidence area of a cluster of Loo -K pairs are estimated. In the present study, ellipses and asymptotic surfaces, Soo, were obtained through resampling and plotted using AUXIM (Pauly et al. 1996) for four species only (Aphanius fasciatus, Mullus barbatus, Merluccius merluccius and Xiphi-as gladius), each represented by more than six stocks. Over-lap between growth spaces was quantified in the form of an overlap index between pairs of ellipses (Pauly et al. 1996). The values of the overlap index range from 0, when the two ellipses are completely separated, to 1, when the small-er of two ellipses is contained completely within the largsmall-er one.
Results
Table 1 summarises the statistical properties of the various life history parameters for the 103 fish stocks in Hellenic waters. Lmax (Fig. 1a) ranged between 5.8 cm, for Aphanius fasciatus, and 225 cm, for Xiphias gladius, and Tmax (Fig. 1b) between 3 yr, for Liza aurata, and 13 yr, for Merlangius merlangus euxinus and Pagellus erythrinus. Female Lmat (Fig. 1c) was available for 36 stocks only and ranged from 8.9 cm, for Spicara smaris, to 43 cm, for Merluccius merluccius. The von Bertalanffy growth parameters were available for 99 stocks only. K values (Fig. 2a) ranged from 0.062 yr -1, for M. merluccius, to 3.066 yr-1, for S. smaris, L
oo values (Fig. 2b) from 7.6 cm, for A. fasciatus, to 244 cm, for X. gladius, and to values (Fig. 2c) from -3.95 yr, for Spicara flexuosa, to 2.83 yr, for Pagrus pagrus.
A negative relationship between LogLoo and LogK was identified for five species only (Mullus barbatus, Mullus surmuletus, Trisopterus minutus capelanus, X. gladius, and A. fasciatus), represented by four or more stocks (Table 2). The values of the slopes were significantly different from 0 (P<0.05) and ranged between 0.18 and 0.60 (Table 2). In contrast, a negative but not significant relationship was found between LogLoo and LogK for the different stocks of
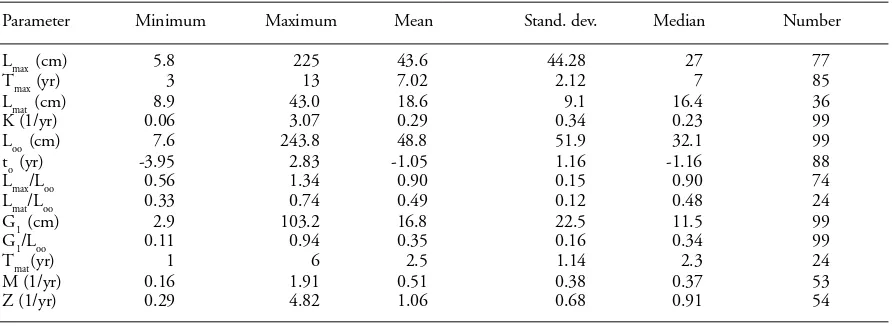
Table 1. Statistical analysis of various available life-history parameters of marine fishes in Hellenic waters. For symbols see material and methods. Original data set from Stergiou et al. (1997).
Parameter Minimum Maximum Mean Stand. dev. Median Number
Lmax (cm) 5.8 225 43.6 44.28 27 77
Tmax (yr) 3 13 7.02 2.12 7 85
Lmat (cm) 8.9 43.0 18.6 9.1 16.4 36
K (1/yr) 0.06 3.07 0.29 0.34 0.23 99
Loo (cm) 7.6 243.8 48.8 51.9 32.1 99
to (yr) -3.95 2.83 -1.05 1.16 -1.16 88
Lmax/Loo 0.56 1.34 0.90 0.15 0.90 74
Lmat/Loo 0.33 0.74 0.49 0.12 0.48 24
G1 (cm) 2.9 103.2 16.8 22.5 11.5 99
G1/Loo 0.11 0.94 0.35 0.16 0.34 99
Tmat (yr) 1 6 2.5 1.14 2.3 24
M (1/yr) 0.16 1.91 0.51 0.38 0.37 53
Z (1/yr) 0.29 4.82 1.06 0.68 0.91 54
M. merluccius 0.59, n=9, P>0.05) and S. smaris (r=-0.37, n=6, P>0.05). All remaining species were represented by less than four stocks. When stocks were grouped by family, a negative relationship was identified for Mullidae (LogLoo=1.18-0.34LogK, SE-slope=0.08, r=-0.77, n=15, P<0.01). In contrast, a negative but not significant rela-tionship was found for Centracanthidae (r=-0.14, n=8, P>0.05), Mugilidae 0.66, n=8, P>0.05), Triglidae (r=-0.34, n=6, P>0.05), Lophiidae (r=0.89, n=4, P>0.5), Sparidae (r=-0.34, n=7, P>0.05), Merluccidae (same as for M. merluccius) and Gadidae (r=-0.33, n=11, P>0.05).
Sim-ilarly when species were grouped by order, a negative rela-tionship was found only for Cyprinodontiformes (same as A. fasciatus) and Gadiformes (LogLoo=1.12-0.67LogK, SE-slope=0.13, r=-0.77, n=20, P<0.001). In contrast, a nega-tive, but not significant relationship was found for Perci-formes 0.26, n=53, P>0.05), PleuronectiPerci-formes (r=-0.68, n=8, P>0.05) and Scorpaeniformes (r=-0.34, n=6, P>0.05). Finally, for all species and stocks combined the following relationship was established: LogLoo =1.34-0.32LogK (SE-slope=0.12, r=-0.25, n=99, P<0.05) (Fig. 3).
The slope of the LogLoo-LogK relationship for all the available stocks in Hellenic waters was significantly (AN-COVA, P<0.05) smaller than that for all species so far in-cluded in FishBase 98 and for which von Bertalanffy esti-mates are available: LogLoo=1.36-0.57LogK (SE-slope = 0.008, r=-0.71, n=4830, P<0.001; Fig. 4). From Figure 4 it is also evident that for Hellenic waters fish stocks were characterised, for the same K values, by smaller Loo values (i.e. the vast majority of the points are positioned below the “global” FishBase regression line). The only notable exceptions were the X. gladius stocks (Fig. 4). It must be stressed that the removal of the X. gladius stocks did not affect the slope of the “Hellenic” regression line (i.e. LogLoo=1.29-0.30LogK, SE-slope=0.09, r=-0.32, n=92, P<0.05).
The Lmax/Loo ratio (Fig. 5a) ranged between 0.56, for M. merluccius, and 1.34, for Lepidorhombus boscii, with a mean and median value of 0.90 for both (Table 1).
Female Tmat was estimated for 24 stocks only and ranged from 1 yr, for M. barbatus, M. surmuletus and Pagellus acarne, to 6 yr, for Pagrus pagrus, with a mean and median value of 2.5 and 2.3 yr, respectively (Table 1).
The Lmat/Loo ratio (Fig. 5b) ranged from 0.33, for M. surmuletus, to 0.74, for Seranus cabrilla, with a mean and median value of 0.49 and 0.48, respectively (Table 1). Lmat increased with an increase in Loo and the slope of the rela-tionship was equal to 1 and did not differ significantly (ANCOVA, P>0.05) from the slope of the same relation-ship for the stocks so far recorded in FishBase 98 (=0.901; Fig. 6).
The Soo values and the centre Loo, K and ϕ’ values of the four species studied are shown in Table 3 and their growth spaces in figure 7. The overlap index between pairs of
el-Table 2. Regression equations between the von Bertalanffy (1938) growth parameters K and Loo, for five fish species in Hellenic waters. SE(b) is the standard error of the slope, r is the correlation coefficient, and n is the number of stocks per species. For all regressions, P<0.05.
Species Regression SE(b) r N
Mullus barbatus LogLoo=1.28-0.18LogK 0.07 -0.66 11
Mullus surmuletus LogLoo=1.05-0.56LogK 0.07 -0.99 4
Trisopterus minutus capelanus LogLoo=1.07-0.60LogK 0.04 -0.99 4
Xiphias gladius LogLoo=2.17-0.26LogK 0.07 -0.86 7
Aphanius fasciatus LogLoo=0.59-0.47LogK 0.07 -0.94 7
lipses was 0 for all pairs of species, a fact indicating a strong dissimilarity in their growth performances, or in other words that the four species do not share similar growth spaces.
Natural mortality rates were available for 53 stocks only and ranged between 0.16 yr-1, for M. merluccius, and 1.92 yr-1, for A. fasciatus, with a mean and median value of 0.51 and 0.37 yr-1 and a mode at 0.3-0.4 yr-1 (Fig. 8a). The nat-ural mortality rates presented here refer to an average for post-juvenile stages whereas natural mortality rates for ear-lier life-history stages will be much higher (Caddy 1989). Since natural mortality rates have been estimated from the empirical formula of Pauly (1980), such estimates are not
independent from the K and Loo values. Thus, there is not any meaning in identifying the relationship between K and M. However, the Tmax estimates are independent of the Z estimates, which ranged between 0.29 and 4.82 yr-1 (Fig. 8b, Table 1). Both LogK (Fig. 9) and LogZ (Fig. 10) de-creased with an increase in LogTmax.
Discussion
In the present study, significant relationships were estab-lished between the life-history parameters K and Loo, K and Tmax, Lmat and Loo, and Z and Tmax, for a variety of fish
Fig. 3. Relationship between the von Bertalanffy K and Loo pa-rameters for a variety of fish stocks in Hellenic waters.
stocks in the Hellenic waters. Such relationships can be used for estimating one variable from the other for various fish stocks in that region. It must be pointed out, however, that because the data used were biased towards the larger, commercial species (84 commercial out of 103 stocks), the relationships and interpretations presented here must be considered with caution, and the data set must be ex-panded to include more stocks and species.It must also be stressed that the observed patterns might be a consequence of common ancestry. Yet, given the high diversity of species analysed here (40 species belonging to 20 families) this is likely not a problem.
It is generally well known that within a closely related group of fish stocks (e.g. order, family, genus, species), the LogLoo and LogK values are negatively correlated (e.g. Bev-erton and Holt 1959, Adams 1980, Munro and Pauly 1983, Pauly and Munro 1984, Wootton 1990, Pauly 1980, Roff 1992, Charnov 1993, Froese and Pauly 1998, Pauly 1998a). In other words, the von Bertalanffy parame-ters are linked by the relation Loo=DK-h, with the dimen-sionless exponent h, known as the Beverton-Holt invari-ant, generally ranging between 0.27 and 0.80 (Charnov 1993). Such a relationship shows that the faster a species approaches its Loo, the smaller it is as an old adult (often termed as growth trade-off ). In Hellenic waters, the value of the dimensionless number h ranged between 0.18 and 0.67, when Gadiformes are taken into account, whereas for all fish stocks considered together it was 0.32. The lat-ter is much smaller than that for the 4830 populations so far registered in FishBase 98, which equals 0.57 (Fig. 4). From figure 4 becomes also apparent that the stocks and/ or species inhabiting Hellenic waters are smaller than those inhabiting other areas since, as mentioned earlier, the ma-jority of the points are located below the FishBase “global” regression line. The most notable exception was X. gladius, for which all seven stocks formed a clear, tight cluster to the right part of the graph and above the “global” regres-sion line (Fig. 4). We shall return to this point later.
It is worthy to mention here that the small size of the fish species inhabiting Hellenic waters is also indicated, beyond any doubt, from the results of experimental trawl fishing, according to which the average weight per individ-ual caught in the codends is very small when compared with other regions (e.g. as small as 20 g: Stergiou 1999a).
It is also known that in fishes the Lmat/Loo ratio is rela-tively constant within most families, being generally small-er for large-sized species and largsmall-er for small-sized ones (e.g. 0.75 for clupeids and 0.55 for cod; Beverton and Holt
Fig. 5. The ratios of (a) maximum length over the von Bertalanffy Loo and (b) length-at-maturity over Loo for a variety of female fish stocks in Hellenic waters.
1959, Beverton 1963, Longhurst and Pauly 1987, Char-nov 1993, Pauly 1994, Binohlan 1998). The Lmat/Loo ratio is another invariant representing the outcome of life-histo-ry symmetries (Charnov 1993). The constancy in the Lmat/ Loo ratio has been attributed to the “reproductive drain concept”, according to which fish grow fast until they reach Lmat and then their growth declines because most of the energy previously used for body growth is now chan-nelled to reproduction. An alternative hypothesis, that is nowadays gaining ground, however, is that is the slow down of growth that triggers reproduction (for a discus-sion see: Pauly 1994, 1998a, Binohlan 1998). The female Lmat/Loo ratio of the 165 stocks registered in FishBase 98 ranges from 0.18 to 0.97, with a mean and median value of 0.56 and 0.54, respectively (Table 4). Those values are somewhat larger than those of the Hellenic stocks (Table 1) and may indicate that the relative length at maturity of the Hellenic fishes is lower. The relationship between Lmat
and Loo for both the Hellenic fishes and those included in FishBase 98 (Fig. 6) was linear with unit slope for the former ones that did not differ from the latter one. This makes Lmat/Loo a constant equal to 0.47 for the Hellenic stocks, i.e. close to their mean Lmat/Loo ratio (Table 1), and equal to 0.77 for those included in FishBase.
Winemiller and Rose (1992) analysed the life-history patterns of 216 North American marine and freshwater fish species, belonging to 57 families. Their data set was also biased towards the larger, commercial species, with the marine ones belonging to similar orders with those of the Hellenic stocks (i.e. Perciformes, Scorpaeniformes, Pleu-ronectiformes, Clupeiformes; the only exception was Sal-moniformes, which was not represented in Hellenic wa-ters). Thus, one may hypothesise that both data sets repre-sent “ecologically” equivalent species arrays. As a group, the Hellenic fishes were smaller (mean = 43.6 cm), had shorter life spans (mean = 7.02 yr) and matured earlier
Table 3. Asymptotic surfaces Soo and center Loo, K and ϕ’ values for four fish species in the Hellenic waters. The original sets of Loo and K values for each stock per species are from Stergiou et al. (1997).
Number of Center values of
Species stocks Loo (cm) K (1/yr) ϕ’ Soo (log unit2)
Aphanius fasciatus 7 8.8 0.181 1.147 0.0409
Mullus barbatus 11 25.3 0.199 2.103 0.1496
Merluccius merluccius 9 76.4 0.095 2.743 0.2825
Xiphias gladius 7 217.5 0.211 4.000 0.0631
(mean = 18.6 cm and 2.5 yr) (Table 1) than their North American marine counterparts (mean = 55.1 cm, 13 yr, 32 cm and 3.4 yr, respectively). The mean Lmat of the Hellenic stocks (Table 1) was also smaller than that of the FishBase stocks used for the estimation of the Lmat-Loo relationship (Table 4).
The M rates for the Hellenic waters were estimated from the empirical equation of Pauly (1980), which was based on data from 175 fish stocks (in this data set the Hellenic stocks were largely underrepresented). The M rates of 175 fish stocks range from 0.1 to 7.8 yr-1 and mo-dal natural mortality is 0.2-0.3 yr-1. The latter is lower than that in the Hellenic waters (Table 1, Fig. 8a), a fact possibly indicating that Hellenic stocks generally suffer from high post-juvenile mortality rates.
To sum up, the fish stocks and/or species inhabiting the Hellenic waters are generally small in size, have low longev-ity, mature at an early age and size, and probably suffer high adult mortality rates. Such a pattern most probably is an adaptation to the synergetic combination of highly oli-gotrophic conditions and high subtropical temperatures prevailing in Hellenic waters (Stergiou 1993, 1999b, Ster-giou et al. 1997) and is consistent with life-history theory. Thus, low trophic potential combined with relatively high temperatures lead to low growth rates. This most probably implies small body sizes, thus increasing both the time spent and the intensity of different size-related predatory fields (for a discussion on the relationship between M and temperature see also: Pauly 1980, 1998a,b, Pauly and Binohlan 1998). Life-history theory predicts that, under conditions of age- or size-specific mortality rates and when adult survival is low and uncertain, the individuals of a population may increase their fitness by decreasing their length-at-maturity when compared with those from an environment characterised by a higher adult survival (e.g. Wootton 1990, Stearns 1992, Roff 1992). The benefit of early maturation springs from the fact that early maturing individuals have a higher probability of surviving to matu-rity (Bell 1980). Now we may return to the exception of Xiphias gladius, which is a highly migratory species, and because of such a habit its growth is less affected from local environmental (i.e. food, temperature) conditions.
Various empirical studies also reveal that M and K are positively related (e.g. Beverton and Holt 1959, Pauly 1980, 1994, 1998a,b, Roff 1992, Pauly and Binohlan 1998), with the M/K ratio representing another life-histo-ry invariant (Charnov 1993; but see Pauly 1998b). As mentioned earlier, the M estimates of the Hellenic stocks are not independent from their K and Loo values. Thus, in the present study the relationship between K and M as well as the M/K ratio were not estimated. The negative rela-tionship between K and Tmax (Fig. 9) is a reflection of the negative relationship between M and Tmax (and between Z and Tmax: Fig. 10). Tmax is a well-behaved statistic for large samples and 1/Tmax approximates M (e.g. Beverton 1963,
Fig. 8. (a) Natural and (b) total mortality rates for a variety of fish stocks in Hellenic waters.
Fig. 9. Relationship between maximum age and the von Berta-lanffy K parameter for a variety of fish stocks in Hellenic waters.
Hoenig 1983, Charnov 1993). Hence, M and K both show how quickly a species “reaches” its death.
In the present work, the auximetric grid was used for comparing the growth of four species, each represented by more than six stocks. Growth performance in fishes strongly depends, among other things, on the quality and quantity of food consumed (e.g. Wootton 1990) and gen-erally a fish diet is superior to a benthic or plankton one (e.g. Martin 1966). Indeed, the growth spaces occupied by the four species seem to reflect their strikingly different feeding habits, especially with respect to the size of prey and the relative importance of fish prey to their diet (Fig. 7). Hence, growth potential as well as ?’ values were all lower for A. fasciatus, a lagoonal, small-sized species feed-ing on vegetal material, detritus and small invertebrates (Whitehead et al. 1986), and much higher for X. gladius. (Fig. 7, Table 3). The latter is a large pelagic, primary pisci-vore species (sensu Keast 1985), feeding exclusively upon medium-sized pelagic fishes (e.g. Scomber spp., Trachurus spp., Caranx spp.) and squids (Whitehead et al. 1986). The growth potential of X. gladius is followed by that of M. merluccius, a large-sized demersal species, which feeds upon crustaceans and small-sized fishes when smaller than 20 cm total length, and almost exclusively upon small-to-medium sized fishes when larger than 20 cm (e.g. Argenti-na sphyraeArgenti-na, Sardina pilchardus, Engraulis encrasicolus, Spicara spp., Trachurus spp., Gadiculus argenteus argenteus, Gobius spp., Serranus hepatus) (Papaconstaninou and Ster-giou 1995). The growth space between A. fasciatus and M. merluccius is occupied by M. barbatus, which is a medium-sized benthic species feeding mainly upon benthic inverte-brates, such as amphipods, decapods, polychaetes, gastro-pods and bivalves, and to a much lesser extent upon small-sized fishes such as Gobius spp. and Gaidropsarus mediter-raneus (Caragitsou and Tsimenides 1982, Vassilopoulou and Papaconstantinou 1993, Lambropoulou 1997).
References
Adams, P. B. 1980. Life history patterns in marine fishes and their consequences for fisheries management. - Fish. Bull. U.S. 78: 1-12.
Bell, G. 1980. The costs of reproduction and their consequences. - Am. Nat. 116: 45-76.
von Bertalanffy, L. 1938. A quantitative theory of organic growth (Inquires on growth laws. II). – Hum. Biol. 10: 181-213.
Binohlan, C. 1998. The maturity table. – In: Froese, R. and Pau-ly, D. (eds.), FishBase 98: Concepts, design and data sources. Manila: ICLARM, pp. 176-179.
Binohlan, C. and Pauly, D. 1998. The PopGrowth table. – In: Froese, R. and Pauly, D. (eds.), FishBase 98: concepts and design data sources. Manila: ICLARM, pp. 124-129. Beverton, R. J. H. 1963. Maturation, growth and mortality of
clupeid and engraulid stocks in relation to fishing. Rap. P. -V. Reun. Cons. Int. Expl. Mer 154: 44-67.
Beverton, R. J. H. and Holt, S. J. 1959. A review of the lifespans and mortality rates of fish in nature, and their relation to growth and other physiological characteristics. – In: Wohstenholme, G. E. and O’Conner, M. (eds.), CIBA Foundation Colloquia on ageing. Vol. 5. The lifespan of an-imals. Churcill, London, pp. 142-180.
Caddy, J. F. 1989. A note for fishery workers in the Eastern Med-iterranean on the estimation of values for M. - FAO Fish. Rep. 412: 199-200.
Caragitsou, E. and Tsimenides, N. 1982. Seasonal changes and comparative analysis of the food of the red mullet (Mullus barbatus) in the gulfs of Saronikos and Thermaikos. - Tha-lassographica 5: 41-61.
Charnov, E. 1993. Life history invariants. - Oxford Series in Ecology and Evolution. Oxford: Oxford University Press.
Francis, R. I. C. C. 1996.Do herring grow faster than orange
roughy? - Fish. Bull. (U.S.) 94: 783-786.
Froese, R. and Pauly, D. (eds.). 1998. FishBase 98: Concepts, design and data sources. -Manila: ICLARM.
Gunderson, D. R. and Dygert, P. H. 1988. Reproductive effort as a predictor of natural mortality rate. - J. Cons. Int. Explor.
Mer44: 200-209.
Hoenig, J. M. 1983. Empirical use of longevity data to estimate mortality rates. - Fish. Bull. (U.S.) 81: 898-903.
Jennings, S. and Beverton, R. J. H. 1991. Intraspecific variation in the life history tactics of Atlantic herring (Clupea harengus
L.) stocks. - ICES J. Mar. Sci. 48: 117-126.
Keast, A. 1985. The piscivore feeding guild of fishes in small freshwater ecosystems. – Env. Biol. Fish 12: 119-129. Labropoulou, M. 1997. The feeding ecology of two sympatric
Mullus species in Iraklion Bay. - Proc. 5th Hellenic Symp.
Oceanog. Fish. 5: 67-70.
Longhurst, A. and Pauly, D. 1987. Ecology of tropical oceans. -San Diego: Academic Press.
Martin, N. V. 1966. The significance of food habits in the biolo-gy, exploitation, and management of Algonquin Park, On-tario, Lake trout. - Trans. Amer. Fish. Soc. 95: 415-422. Moreau, J., Bambino, C. and Pauly, D. 1986. A comparison of
four indices of overall fish growth performance, based on 100 tilapia populations (Fam. Cichlidae). – In: Maclean, J. L., Dizon, L. B. and Hosillos, L. V (eds.), The First Asian Fisheries Forum. Asian Fisheries Society, Manila, Philip-pines, pp. 201-206.
Table 4. Statistical analysis of the female length-at-maturity (Lmat) and of the ratio of Lmat over the von Bertalanffy Loo for the stocks included in FishBase 98.
Parameter Minimum Maximum Mean Stand. dev. Median Number
Lmat 1.12 257 39.7 42.03 29.3 165
Munro, J. L. and Pauly, D. 1983. A simple method for compar-ing the growth of fishes and invertebrates. - Fishbyte 1(1): 5-6.
Papaconstantinou, C. and Stergiou, K. I. 1995. Biology and fish-eries of hake, Merlucciusmerluccius L., 1758, in the eastern Mediterranean. - In: Alheit, J. and Pitcher, T. J. (eds.), Hake, fisheries products and markets. Fish and Fisheries Series 15. London: Chapman & Hall, pp. 149-180.
Pauly, D. 1980. On the interrelationships between natural mor-tality, growth parameters and mean environmental tempera-ture in 175 fish stocks. – J. Cons. Int. Explor. Mer 39: 175-192.
Pauly, D. 1983. Length-converted catch curves: a powerful tool for fisheries research in the tropics (Part I). - Fishbyte 1(2): 9-13.
Pauly, D. 1994. On the sex of fish and the gender of scientists: a collection of essays in fisheries science. - Fish and Fisheries Series 14. London: Chapman and Hall.
Pauly, D. 1997. Geometrical constraints on body size. – Tr. Ecol. Evol. 12: 442-443.
Pauly, D. 1998a. Tropical fishes: patterns and propensities. - J. Fish Biol. 53 (Suppl.): 1-17.
Pauly, D. 1998b. The natural mortality of fishes. - In: Froese, R. and Pauly, D. (eds.), FishBase 98: Concepts, design and data sources. Manila: ICLARM, pp. 138.
Pauly, D. and Munro, J. L. 1984. Once more on growth compar-ison in fish and invertebrates. - Fishbyte 2(1): 21. Pauly, D. and Binohlan, C. 1998. Natural mortality. – In: Froese,
R. and Pauly, D. (eds.), FishBase 98: Concepts, design and data sources. Manila: ICLARM, pp. 137-140.
Pauly, D., Moreau, J. and Gayanilo, F. Jr. 1996. A new method for comparing the growth performance of fishes applied to wild and farmed tilapias. – In: Pullin, R. S. V., Lazard, J., Legendre, M., Amon Kothias, J. B. and Pauly, D. (eds.), The Third International Symposium on Tilapia in aquaculture. ICLARM Conf. Proc. 41: 433-441.
Pauly, D., Christensen, V., Dalsgaard, J., Froese, R. and Torres, F. C. 1998. Fishing down marine food webs. - Science 279: 860-863.
Roff, D. A. 1992. The evolution of life histories: theory and anal-ysis. - London: Chapman and Hall.
Stearns, S. C. 1992. The evolution of life histories. - Oxford: Oxford University Press.
Stergiou, K. I. 1993. Nutrient-dependent variation in growth
and longevity of the red bandfish, Cepola macrophthalma
(L.), in the Aegean Sea. - J. Fish Biol. 42: 633-644. Stergiou, K. I. 1999a. Effects of changes in the size and shape of
codend on catch of Aegean Sea fishes. - ICES J. Mar. Sci. 56:
96-102.
Stergiou, K. I. 1999b. Intraspecific variations in size- and age-at-maturity for red bandfish, Cepola macrophthalma. – Env. Biol. Fishes 54: 151-160.
Stergiou, K. I., Christou, E. D., Georgopoulos, D., Zenetos, A. and Souvermezoglou, C. 1997. The Hellenic seas: physics, chemistry, biology and fisheries. - Oceanog. Mar. Biol. Ann. Rev. 35: 415-538.
Vakily, J. M. 1992. Determination and comparison of bivalve growth, with emphasis on Thailand and other tropical areas. - ICLARM Tech. Rep. 36: 1-125.
Vassilopoulou, V. and Papaconstantinou, C. 1993. Feeding hab-its of red mullet (Mullus barbatus) in the North Aegean Sea. -Proc. 4th Hellenic Symp. Oceanog. Fish. 4: 491-492 (in Hellenic, English abstract).
Whitehead, P. J. P., Bauchot, M. L., Hureau, J. C., Nielsen, J. and Tortonese, E. (eds). 1986. Fishes of the North-eastern Atlan-tic and the Mediterranean. - Volumes I, II and III. Paris: UNESCO.
Winemiller, K. O. and Rose, K. A. 1992. Patterns of life history diversification in North American fishes: implications for population regulation. - Can. J. Fish. Aquat. Sci. 49: 2196-2218.
Wootton, R. J. 1990. Ecology of teleost fishes. - Fish and Fisher-ies SerFisher-ies1, London: Chapman and Hall.
Appendix: List of species per family used in the analysis (from Stergiou et al. 1997; species names according to Whitehead et al. 1986).
Carangidae: Trachurus mediterraneus, Trachurus trachurus; Centracanthidae: Spicara smaris, Spicara flexuosa; Cepolidae: Cepola macrophthalma; Citharidae: Citharus linguatula; Clupeidae: Sardina pilchardus; Cynoglossidae: Symphurus ligulatus;
Cyprinodontidae: Aphanius fasciatus; Gadidae: Gadiculus argenteus argenteus, Merlangius merlangus euxinus, Micromesistius poutassou,
Gaidropsarus mediterraneus, Phycis blennoides, Trisopterus minutus capelanus; Lophiidae: Lophius budegassa, Lophius piscatorius; Merluccidae: Merlucius merluccius; Mugilidae: Chelon labrosus, Liza aurata, Liza ramada, Liza saliens; Mullidae: Mullus barbatus,
Mullus surmuletus; Scaridae: Sparisoma cretense; Scombridae: Thunnus alalunga; Scophthalmidae: Lepidorhombus boscii; Serranidae: