V
OLUMEN
O.
7
(2017),
I
SSUEN
O.
07
(J
ULY)
ISSN
2231-5756
A Monthly Double-Blind Peer Reviewed (Refereed/Juried) Open Access International e-Journal - Included in the International Serial Directories Indexed & Listed at:
Ulrich's Periodicals Directory ©, ProQuest, U.S.A., EBSCO Publishing, U.S.A., Cabell’s Directories of Publishing Opportunities, U.S.A., Google Scholar, Open J-Gage, India [link of the same is duly available at Inflibnet of University Grants Commission (U.G.C.)],
Index Copernicus Publishers Panel, Poland with IC Value of 5.09 & number of libraries all around the world.
V
OLUMEN
O.
7
(2017),
I
SSUEN
O.
07
(J
ULY)
ISSN
2231-5756
INTERNATIONAL JOURNAL OF RESEARCH IN COMMERCE, IT & MANAGEMENT
CONTENTS
Sr.
No.
TITLE & NAME OF THE AUTHOR (S)
Page
No.
1
.
COMPREHENDING AND IMPLEMENTING BEST PRACTICES OF QUALITY MANAGEMENT ACROSS INDUSTRIESBALAJI GOPALAN & DR. REVATHI IYER
1
2
.
INVENTIVE USE OF INFORMATION AND COMMUNICATION TECHNOLOGY IN THE OPEN AND DISTANCE LEARNING SYSTEM: AN EMPIRICAL STUDYB. RUPINI
6
3
.
A STUDY ON PROBLEM FACED BY VEGETABLE PRODUCING FARMERS IN NILIGIRI - DISTRICTDR. S. NAMASIVAYAM & K. ARTHI
12
4
.
STUDY ON CONSUMER BEHAVIOUR TOWARDS FROZEN FOOD IN JAMMU CITY OF J & K STATETAVLEEN KAUR, JYOTI KACHROO & NAVEED HAMID
16
5
.
OPINION DIFFERENCE OF TEACHERS ON EXISTING PERFORMANCE APPRAISAL PRACTICES IN PRIVATE ENGINEERING INSTITUTIONSCHANDRA MOHAN SINGH, DR. ASHOK CHANDRA & DR. SANJAY SHARMA
22
6
.
COOPERATIVE INDUSTRIAL ESTATES: THE GOLDEN PLATFORM FOR SMALL SCALE INDUSTRIESDR. ARVIND CHAUDHARI
35
7
.
ECONOMIC GROWTH, EDUCATION EXPENDITURE AND INCOME INEQUALITY IN INDIAANIRUDDHA KAYET & DEBASISH MONDAL
38
8
.
LEADER MEMBER EXCHANGE QUALITY INFLUENCING COMMITMENT AND TRUST AMONG EMPLOYEESOWAIS AHMED & DR. MUSHTAQ AHMED SIDDIQI
44
9
.
EFFECTIVENESS OF TECHNOLOGY ENABLED LEARNING (TEL) IN LEARNING SCIENCE AT D.T.Ed. LEVELP. JAYANTHI NIRMALA & DR. K. S. PREMILA
47
10
.
ROLE OF FIXED ASSETS MANAGEMENTRAMESH VANKADOTH
50
11
.
A REVIEW OF LITERATURE ON THE INTER-LINKAGES OF STOCK MARKET DEVELOPMENT WITH ECONOMIC GROWTHTANUJ NANDAN & NIVEDITA SRIVASTAVA
52
12
.
A STUDY ON EMPLOYEE ATTRITION AND RETENTION IN BPO SECTORDR. SHAMSHER SINGH & RAVEENA RANA
60
13
.
A STUDY ON THE INFLUENCE OF ATTITUDINAL AND ENVIRONMENTAL FACTORS ON ENTREPRENEURIAL INTENTIONDR. JOHNEY JOHNSON & DR. SONIA KATHERIN MATHEW
64
14
.
E-GOVERNANCE: A BOON OR BLISS TO SOCIETY: A RESEARCHDR. SHALINI SRIVASTAV, DR. SUMIT AGARWAL & DR. GARIMA BHARDWAJ
68
15
.
BREXIT-AN END IN ITSELF OR THE BEGINNING OF A NEW ERADEEPA SHARMA
71
16
.
ROLE OF BUYER CHARACTERISTICS IN ONLINE SHOPPINGDR. ADIL RASOOL
79
17
.
FOREIGN INSTITUTIONAL INVESTORS (FIIs) FLOWS AND VOLATILITY IN STOCK MARKETS OF INDIA DURING SUB-PRIME CRISIS AND POST FPI ACTRAJNISH KLER
87
18
.
ASSESSMENT OF KNOWLEDGE LEVEL, NEED AND IMPACT OF ICTS AMONG FARMERS IN DIFFERENT ASPECTS OF AGRICULTURE ATTALERA BLOCK OF BUNDI DISTRICT IN RAJASTHAN
DR. SUSMIT JAIN & NEERAJ KUMAR PRAJAPATI
92
19
.
ESSENTIAL FACTORS FOR TRAINING TRANSFER: A STUDY OF PHARMACEUTICAL REPRESENTATIVES IN LUCKNOW AREAANA RIZVI & DR. SURENDRA KUMAR
104
20
.
EXPLORING PSYCHOLOGICAL CAPITAL IN INDIAN CONTEXT AMONG MSME ENTREPRENEURSMARIA TRESITA PAUL V. & DR. N. UMA DEVI
108
21
.
FRUIT PROCESSING INDUSTRY IN MURSHIDABAD DISTRICT OF WEST BENGAL - PRESENT STATUS AND FUTURE PROSPECTSMADHAB KUMAR BISWAS & DR. SUDIPTA SARKAR
113
22
.
A COMPARATIVE STUDY ON REPORTING OF MERGERS AND ACQUISITIONS ACTIVITIES UNDER IGAAP AND IND ASNARAYAN KAFLE
117
23
.
CULTURAL INTELLIGENCE: AN INTEGRAL PART OF CROSS CULTURAL ORGANISATIONSJASLEEN KAUR ANEJA, VAISHALI JOSHI & PRIYANKA MARWA
120
24
.
BILATERAL RELATION BETWEEN INDIA AND THAILANDDR. SHEETAL ARUN KHANDRE
122
25
.
AN EVALUATION OF THE STATUS OF HIGHER EDUCATION IN INDIADR. YOGESH H S & DR. KIRAN S P
127
26
.
STOCK PERFORMANCE OF AMERICA’S LARGEST BANKS AFTER MERGERS & ACQUISITIONSSAL VILLEGAS
131
27
.
CORPORATE SOCIAL RESPONSIBILITY (CSR) AND CUSTOMER’S PERSPECTIVE OF INDIAN BANKSPUNEET KAUR
139
28
.
WIRELESS ROUTING PROTOCOLS AND ITS SECURITY ISSUES IN AD HOC NETWORKNEHA CHUGH
147
29
.
POLICY SUPPORT TO AUGMENT THE AGRIBUSINESS POTENTIAL OF KARNATAKANAGARAJA K.
150
30
.
WORK-LIFE BALANCE: ITS CORRELATION WITH JOB SATISFACTION, LIFE SATISFACTION AND STRESS LEVEL AMONGST EXECUTIVES OF PUBLIC SECTOR BANKS IN PUNJABJASPREET KAUR
154
V
OLUMEN
O.
7
(2017),
I
SSUEN
O.
07
(J
ULY)
ISSN
2231-5756
INTERNATIONAL JOURNAL OF RESEARCH IN COMMERCE, IT & MANAGEMENT
CHIEF PATRON
Prof. (Dr.) K. K. AGGARWAL
Chairman, Malaviya National Institute of Technology, Jaipur
(An institute of National Importance & fully funded by Ministry of Human Resource Development, Government of India)
Chancellor, K. R. Mangalam University, Gurgaon
Chancellor, Lingaya’s University, Faridabad
Founder Vice-Chancellor (1998-2008), Guru Gobind Singh Indraprastha University, Delhi
Ex. Pro Vice-Chancellor, Guru Jambheshwar University, Hisar
FOUNDER PATRON
Late Sh. RAM BHAJAN AGGARWAL
Former State Minister for Home & Tourism, Government of Haryana
Former Vice-President, Dadri Education Society, Charkhi Dadri
Former President, Chinar Syntex Ltd. (Textile Mills), Bhiwani
FORMER CO-ORDINATOR
Dr. S. GARG
Faculty, Shree Ram Institute of Business & Management, Urjani
ADVISOR
Prof. S. L. MAHANDRU
Principal (Retd.), Maharaja Agrasen College, Jagadhri
EDITOR
Dr. R. K. SHARMA
Professor & Dean, Bharti Vidyapeeth University Institute of Management & Research, New Delhi
CO-EDITOR
Dr. BHAVET
Faculty, Shree Ram Institute of Engineering & Technology, Urjani
EDITORIAL ADVISORY BOARD
Dr. S. P. TIWARI
Head, Department of Economics & Rural Development, Dr. Ram Manohar Lohia Avadh University, Faizabad
Dr. CHRISTIAN EHIOBUCHE
Professor of Global Business/Management, Larry L Luing School of Business, Berkeley College, USA
Dr. SIKANDER KUMAR
Chairman, Department of Economics, Himachal Pradesh University, Shimla, Himachal Pradesh
Dr. JOSÉ G. VARGAS-HERNÁNDEZ
Research Professor, University Center for Economic & Managerial Sciences, University of Guadalajara,
Gua-dalajara, Mexico
Dr. M. N. SHARMA
Chairman, M.B.A., Haryana College of Technology & Management, Kaithal
Dr. TEGUH WIDODO
Dean, Faculty of Applied Science, Telkom University, Bandung Technoplex, Jl. Telekomunikasi, Indonesia
Dr. M. S. SENAM RAJU
Professor, School of Management Studies, I.G.N.O.U., New Delhi
Dr. CLIFFORD OBIYO OFURUM
Professor of Accounting & Finance, Faculty of Management Sciences, University of Port Harcourt, Nigeria
Dr. KAUP MOHAMED
V
OLUMEN
O.
7
(2017),
I
SSUEN
O.
07
(J
ULY)
ISSN
2231-5756
INTERNATIONAL JOURNAL OF RESEARCH IN COMMERCE, IT & MANAGEMENT
SUNIL KUMAR KARWASRA
Principal, Aakash College of Education, ChanderKalan, Tohana, Fatehabad
Dr. MIKE AMUHAYA IRAVO
Principal, Jomo Kenyatta University of Agriculture & Tech., Westlands Campus, Nairobi-Kenya
Dr. SYED TABASSUM SULTANA
Principal, Matrusri Institute of Post Graduate Studies, Hyderabad
Dr. NEPOMUCENO TIU
Chief Librarian & Professor, Lyceum of the Philippines University, Laguna, Philippines
Dr. SANJIV MITTAL
Professor & Dean, University School of Management Studies, GGS Indraprastha University, Delhi
Dr. ANA ŠTAMBUK
Head of Department of Statistics, Faculty of Economics, University of Rijeka, Rijeka, Croatia
Dr. RAJENDER GUPTA
Convener, Board of Studies in Economics, University of Jammu, Jammu
Dr. SHIB SHANKAR ROY
Professor, Department of Marketing, University of Rajshahi, Rajshahi, Bangladesh
Dr. ANIL K. SAINI
Professor, Guru Gobind Singh Indraprastha University, Delhi
Dr. SRINIVAS MADISHETTI
Professor, School of Business, Mzumbe University, Tanzania
Dr. NAWAB ALI KHAN
Professor & Dean, Faculty of Commerce, Aligarh Muslim University, Aligarh, U.P.
MUDENDA COLLINS
Head, Operations & Supply Chain, School of Business, The Copperbelt University, Zambia
Dr. EGWAKHE A. JOHNSON
Professor & Director, Babcock Centre for Executive Development, Babcock University, Nigeria
Dr. A. SURYANARAYANA
Professor, Department of Business Management, Osmania University, Hyderabad
Dr. MURAT DARÇIN
Associate Dean, Gendarmerie and Coast Guard Academy, Ankara, Turkey
Dr. ABHAY BANSAL
Head, Department of Information Technology, Amity School of Engg. & Tech., Amity University, Noida
Dr. YOUNOS VAKIL ALROAIA
Head of International Center, DOS in Management, Semnan Branch, Islamic Azad University, Semnan, Iran
WILLIAM NKOMO
Asst. Head of the Department, Faculty of Computing, Botho University, Francistown, Botswana
Dr. JAYASHREE SHANTARAM PATIL (DAKE)
Faculty in Economics, KPB Hinduja College of Commerce, Mumbai
SHASHI KHURANA
Associate Professor, S. M. S. Khalsa Lubana Girls College, Barara, Ambala
Dr. SEOW TA WEEA
Associate Professor, Universiti Tun Hussein Onn Malaysia, Parit Raja, Malaysia
Dr. OKAN VELI ŞAFAKLI
Associate Professor, European University of Lefke, Lefke, Cyprus
Dr. MOHENDER KUMAR GUPTA
Associate Professor, Government College, Hodal
Dr. BORIS MILOVIC
V
OLUMEN
O.
7
(2017),
I
SSUEN
O.
07
(J
ULY)
ISSN
2231-5756
INTERNATIONAL JOURNAL OF RESEARCH IN COMMERCE, IT & MANAGEMENT
Dr. MOHAMMAD TALHA
Associate Professor, Department of Accounting & MIS, College of Industrial Management, King Fahd
Uni-versity of Petroleum & Minerals, Dhahran, Saudi Arabia
Dr. V. SELVAM
Associate Professor, SSL, VIT University, Vellore
Dr. IQBAL THONSE HAWALDAR
Associate Professor, College of Business Administration, Kingdom University, Bahrain
Dr. PARDEEP AHLAWAT
Associate Professor, Institute of Management Studies & Research, Maharshi Dayanand University, Rohtak
Dr. ALEXANDER MOSESOV
Associate Professor, Kazakh-British Technical University (KBTU), Almaty, Kazakhstan
Dr. ASHOK KUMAR CHAUHAN
Reader, Department of Economics, Kurukshetra University, Kurukshetra
YU-BING WANG
Faculty, department of Marketing, Feng Chia University, Taichung, Taiwan
SURJEET SINGH
Faculty, Department of Computer Science, G. M. N. (P.G.) College, Ambala Cantt.
Dr. MELAKE TEWOLDE TECLEGHIORGIS
Faculty, College of Business & Economics, Department of Economics, Asmara, Eritrea
Dr. RAJESH MODI
Faculty, Yanbu Industrial College, Kingdom of Saudi Arabia
Dr. SAMBHAVNA
Faculty, I.I.T.M., Delhi
Dr. THAMPOE MANAGALESWARAN
Faculty, Vavuniya Campus, University of Jaffna, Sri Lanka
Dr. SHIVAKUMAR DEENE
Faculty, Dept. of Commerce, School of Business Studies, Central University of Karnataka, Gulbarga
SURAJ GAUDEL
BBA Program Coordinator, LA GRANDEE International College, Simalchaur - 8, Pokhara, Nepal
FORMER TECHNICAL ADVISOR
AMITA
FINANCIAL ADVISORS
DICKEN GOYAL
Advocate & Tax Adviser, Panchkula
NEENA
Investment Consultant, Chambaghat, Solan, Himachal Pradesh
LEGAL ADVISORS
JITENDER S. CHAHAL
Advocate, Punjab & Haryana High Court, Chandigarh U.T.
CHANDER BHUSHAN SHARMA
Advocate & Consultant, District Courts, Yamunanagar at Jagadhri
V
OLUMEN
O.
7
(2017),
I
SSUEN
O.
07
(J
ULY)
ISSN
2231-5756
INTERNATIONAL JOURNAL OF RESEARCH IN COMMERCE, IT & MANAGEMENT
CALL FOR MANUSCRIPTS
We invite unpublished novel, original, empirical and high quality research work pertaining to the recent developments & practices in the areas of Com-puter Science & Applications; Commerce; Business; Finance; Marketing; Human Resource Management; General Management; Banking; Economics; Tourism Administration & Management; Education; Law; Library & Information Science; Defence & Strategic Studies; Electronic Science; Corporate Gov-ernance; Industrial Relations; and emerging paradigms in allied subjects like Accounting; Accounting Information Systems; Accounting Theory & Practice; Auditing; Behavioral Accounting; Behavioral Economics; Corporate Finance; Cost Accounting; Econometrics; Economic Development; Economic History; Financial Institutions & Markets; Financial Services; Fiscal Policy; Government & Non Profit Accounting; Industrial Organization; International Economics & Trade; International Finance; Macro Economics; Micro Economics; Rural Economics; Co-operation; Demography: Development Planning; Development Studies; Applied Economics; Development Economics; Business Economics; Monetary Policy; Public Policy Economics; Real Estate; Regional Economics; Political Science; Continuing Education; Labour Welfare; Philosophy; Psychology; Sociology; Tax Accounting; Advertising & Promotion Management; Management Information Systems (MIS); Business Law; Public Responsibility & Ethics; Communication; Direct Marketing; E-Commerce; Global Business; Health Care Administration; Labour Relations & Human Resource Management; Marketing Research; Marketing Theory & Applications; Non-Profit Or-ganizations; Office Administration/Management; Operations Research/Statistics; Organizational Behavior & Theory; Organizational Development; Pro-duction/Operations; International Relations; Human Rights & Duties; Public Administration; Population Studies; Purchasing/Materials Management; Re-tailing; Sales/Selling; Services; Small Business Entrepreneurship; Strategic Management Policy; Technology/Innovation; Tourism & Hospitality; Transpor-tation Distribution; Algorithms; Artificial Intelligence; Compilers & Translation; Computer Aided Design (CAD); Computer Aided Manufacturing; Computer Graphics; Computer Organization & Architecture; Database Structures & Systems; Discrete Structures; Internet; Management Information Systems; Mod-eling & Simulation; Neural Systems/Neural Networks; Numerical Analysis/Scientific Computing; Object Oriented Programming; Operating Systems; Pro-gramming Languages; Robotics; Symbolic & Formal Logic; Web Design and emerging paradigms in allied subjects.
Anybody can submit the soft copy of unpublished novel; original; empirical and high quality research work/manuscriptanytime in M.S. Word format
after preparing the same as per our GUIDELINES FOR SUBMISSION; at our email address i.e. infoijrcm@gmail.com or online by clicking the link online submission as given on our website (FOR ONLINE SUBMISSION, CLICK HERE).
GUIDELINES FOR SUBMISSION OF MANUSCRIPT
1. COVERING LETTER FOR SUBMISSION:
DATED: _____________
THE EDITOR
IJRCM
Subject: SUBMISSION OF MANUSCRIPT IN THE AREA OF______________________________________________________________.
(e.g. Finance/Mkt./HRM/General Mgt./Engineering/Economics/Computer/IT/ Education/Psychology/Law/Math/other, please specify)
DEAR SIR/MADAM
Please find my submission of manuscript titled ‘___________________________________________’ for likely publication in one of your journals.
I hereby affirm that the contents of this manuscript are original. Furthermore, it has neither been published anywhere in any language fully or partly, nor it is under review for publication elsewhere.
I affirm that all the co-authors of this manuscript have seen the submitted version of the manuscript and have agreed to inclusion of their names as co-authors.
Also, if my/our manuscript is accepted, I agree to comply with the formalities as given on the website of the journal. The Journal has discretion to publish our contribution in any of its journals.
NAME OF CORRESPONDING AUTHOR :
Designation/Post* :
Institution/College/University with full address & Pin Code :
Residential address with Pin Code :
Mobile Number (s) with country ISD code :
Is WhatsApp or Viber active on your above noted Mobile Number (Yes/No) :
Landline Number (s) with country ISD code :
E-mail Address :
Alternate E-mail Address :
Nationality :
* i.e. Alumnus (Male Alumni), Alumna (Female Alumni), Student, Research Scholar (M. Phil), Research Scholar (Ph. D.), JRF, Research Assistant, Assistant
Lecturer, Lecturer, Senior Lecturer, Junior Assistant Professor, Assistant Professor, Senior Assistant Professor, Co-ordinator, Reader, Associate
Profes-sor, ProfesProfes-sor, Head, Vice-Principal, Dy. Director, Principal, Director, Dean, President, Vice Chancellor, Industry Designation etc. The qualification of
V
OLUMEN
O.
7
(2017),
I
SSUEN
O.
07
(J
ULY)
ISSN
2231-5756
INTERNATIONAL JOURNAL OF RESEARCH IN COMMERCE, IT & MANAGEMENT
NOTES:
a) The whole manuscript has to be in ONE MS WORD FILE only, which will start from the covering letter, inside the manuscript. pdf.
version is liable to be rejected without any consideration.
b) The sender is required to mention the following in the SUBJECT COLUMNof the mail:
New Manuscript for Review in the area of (e.g. Finance/Marketing/HRM/General Mgt./Engineering/Economics/Computer/IT/
Education/Psychology/Law/Math/other, please specify)
c) There is no need to give any text in the body of the mail, except the cases where the author wishes to give any specific message
w.r.t. to the manuscript.
d) The total size of the file containing the manuscript is expected to be below 1000 KB.
e) Only the Abstract will not be considered for review and the author is required to submit the complete manuscript in the first
instance.
f) The journal gives acknowledgement w.r.t. the receipt of every email within twenty-four hours and in case of non-receipt of acknowledgment from the journal, w.r.t. the submission of the manuscript, within two days of its submission, the corresponding author is required to demand for the same by sending a separate mail to the journal.
g) The author (s) name or details should not appear anywhere on the body of the manuscript, except on the covering letter and the
cover page of the manuscript, in the manner as mentioned in the guidelines.
2. MANUSCRIPT TITLE: The title of the paper should be typed in bold letters, centeredand fully capitalised.
3. AUTHOR NAME (S) & AFFILIATIONS: Author (s) name, designation, affiliation (s), address, mobile/landline number (s), and email/al-ternate email address should be given underneath the title.
4. ACKNOWLEDGMENTS: Acknowledgements can be given to reviewers, guides, funding institutions, etc., if any.
5. ABSTRACT: Abstract should be in fully Italic printing, ranging between 150 to 300 words. The abstract must be informative and
eluci-dating the background, aims, methods, results & conclusion in a SINGLE PARA. Abbreviations must be mentioned in full.
6. KEYWORDS: Abstract must be followed by a list of keywords, subject to the maximum of five. These should be arranged in alphabetic order separated by commas and full stop at the end. All words of the keywords, including the first one should be in small letters, except special words e.g. name of the Countries, abbreviations etc.
7. JEL CODE: Provide the appropriate Journal of Economic Literature Classification System code (s). JEL codes are available at www.aea-web.org/econlit/jelCodes.php. However, mentioning of JEL Code is not mandatory.
8. MANUSCRIPT: Manuscript must be in BRITISH ENGLISH prepared on a standard A4 size PORTRAIT SETTING PAPER. It should be free
from any errors i.e. grammatical, spelling or punctuation. It must be thoroughly edited at your end.
9. HEADINGS: All the headings must be bold-faced, aligned left and fully capitalised. Leave a blank line before each heading.
10. SUB-HEADINGS: All the sub-headings must be bold-faced, aligned left and fully capitalised.
11. MAIN TEXT:
THE MAIN TEXT SHOULD FOLLOW THE FOLLOWING SEQUENCE: INTRODUCTION
REVIEW OF LITERATURE
NEED/IMPORTANCE OF THE STUDY STATEMENT OF THE PROBLEM OBJECTIVES
HYPOTHESIS (ES)
RESEARCH METHODOLOGY RESULTS & DISCUSSION
FINDINGS
RECOMMENDATIONS/SUGGESTIONS
CONCLUSIONS LIMITATIONS
SCOPE FOR FURTHER RESEARCH
REFERENCES
APPENDIX/ANNEXURE
V
OLUMEN
O.
7
(2017),
I
SSUEN
O.
07
(J
ULY)
ISSN
2231-5756
INTERNATIONAL JOURNAL OF RESEARCH IN COMMERCE, IT & MANAGEMENT
12. FIGURES & TABLES: These should be simple, crystal CLEAR, centered, separately numbered & self-explained, and the titles must be above the table/figure. Sources of data should be mentioned below the table/figure. It should be ensured that the tables/figures are
referred to from the main text.
13. EQUATIONS/FORMULAE: These should be consecutively numbered in parenthesis, left aligned with equation/formulae number placed
at the right. The equation editor provided with standard versions of Microsoft Word may be utilised. If any other equation editor is utilised, author must confirm that these equations may be viewed and edited in versions of Microsoft Office that does not have the editor.
14. ACRONYMS: These should not be used in the abstract. The use of acronyms is elsewhere is acceptable. Acronyms should be defined
on its first use in each section e.g. Reserve Bank of India (RBI). Acronyms should be redefined on first use in subsequent sections.
15. REFERENCES: The list of all references should be alphabetically arranged. The author (s) should mention only the actually utilised references in the preparation of manuscript and they may follow Harvard Style of Referencing. Also check to ensure that everything that you are including in the reference section is duly cited in the paper. The author (s) are supposed to follow the references as per the following:
•
All works cited in the text (including sources for tables and figures) should be listed alphabetically.•
Use (ed.) for one editor, and (ed.s) for multiple editors.•
When listing two or more works by one author, use --- (20xx), such as after Kohl (1997), use --- (2001), etc., in chronologically ascendingorder.
•
Indicate (opening and closing) page numbers for articles in journals and for chapters in books.•
The title of books and journals should be in italic printing. Double quotation marks are used for titles of journal articles, book chapters,dissertations, reports, working papers, unpublished material, etc.
•
For titles in a language other than English, provide an English translation in parenthesis.•
Headers, footers, endnotes and footnotes should not be used in the document. However, you can mention short notes to elucidate some specific point, which may be placed in number orders before the references.PLEASE USE THE FOLLOWING FOR STYLE AND PUNCTUATION IN REFERENCES:
BOOKS
•
Bowersox, Donald J., Closs, David J., (1996), "Logistical Management." Tata McGraw, Hill, New Delhi.•
Hunker, H.L. and A.J. Wright (1963), "Factors of Industrial Location in Ohio" Ohio State University, Nigeria.CONTRIBUTIONS TO BOOKS
•
Sharma T., Kwatra, G. (2008) Effectiveness of Social Advertising: A Study of Selected Campaigns, Corporate Social Responsibility, Editedby David Crowther & Nicholas Capaldi, Ashgate Research Companion to Corporate Social Responsibility, Chapter 15, pp 287-303.
JOURNAL AND OTHER ARTICLES
•
Schemenner, R.W., Huber, J.C. and Cook, R.L. (1987), "Geographic Differences and the Location of New Manufacturing Facilities,"Jour-nal of Urban Economics, Vol. 21, No. 1, pp. 83-104.
CONFERENCE PAPERS
•
Garg, Sambhav (2011): "Business Ethics" Paper presented at the Annual International Conference for the All India ManagementAsso-ciation, New Delhi, India, 19–23
UNPUBLISHED DISSERTATIONS
•
Kumar S. (2011): "Customer Value: A Comparative Study of Rural and Urban Customers," Thesis, Kurukshetra University, Kurukshetra.ONLINE RESOURCES
•
Always indicate the date that the source was accessed, as online resources are frequently updated or removed.WEBSITES
V
OLUMEN
O.
7
(2017),
I
SSUEN
O.
07
(J
ULY)
ISSN
2231-5756
INTERNATIONAL JOURNAL OF RESEARCH IN COMMERCE, IT & MANAGEMENT
STOCK PERFORMANCE OF AMERICA’S LARGEST BANKS AFTER MERGERS & ACQUISITIONS
SAL VILLEGAS
DOCTORAL STUDENT
GEORGE FOX UNIVERSITY
USA
ABSTRACT
Since the dawn of the Great Recession, there has been much discussion and disagreement about the health of the banking system in the United States. Many of the nation’s largest institutions were recipients of governmental funding through The Troubled Asset Relief Program (TARP) during the financial crisis and earned the moniker of too-big-too-fail (TBTF) (Brewer & Jagtiani, 2013). Even as large banks used bailout funds for liquidity purposes, they still managed to grow in size due to mergers and acquisitions of other firms. The research presented here explores the impact that these mergers have had on the stock performance of these large banking institutions when they acquire smaller organizations. By examining the stock price, quarterly dividend payments, and earnings per share (EPS) of ten largest bank in the nation, it is determined, that the overall impact of mergers on stock performance varies based on the variable tested. Stock price is not statisti-cally affected by mergers/acquisitions; however, both dividend and EPS are significantly affected. This study affirms the findings of previous researchers in terms of limited stock price affect, however it also brings to light new information about how bank dividends and EPS are affected within this sample.
KEYWORDS
banks, mergers & acquisitions, stock price, stock performance.
INTRODUCTION
or nearly the past century, for-profit businesses have operated under the legal precedent that the ultimate goal of an organization is to maximize shareholder value (Dodge v Ford, 1919). In the banking industry, the goal is no different. Since the creation of the First Bank of United States in 1791, banking institutions have been entrusted by generations of Americans with the responsibility of properly managing and protecting the deposits of citizens, businesses, and governments alike. As history has shown, in times of economic turmoil, the banking industry becomes the unwilling recipient of strict governmental regulation through quick-fix legislation, which ends up breeding complexity and unintended chaos (Smith & Muñiz-Fraticelli, 2013). Current and past regulation of the Amer-ican banking system was not designed to be detrimental to the industry, but rather put in place specific safeguards to defend the industry and financial wellbeing of the country from undue and costly financial risks (Boyd & De Nicolió, 2005). Even through governmental restriction, banks still have a duty to maximize their shareholder profit.
To manage the financial impact that this regulatory environment creates, some banks have chosen to adopt an aggressive merger and acquisition strategy in hopes of growing their footprint amid economic uncertainty, while generating both new revenue streams and business lines (Kowalik, Davig, Morris, & Regehr, 2015). Some of the nation’s most stable banks were even able to acquire struggling institutions free of charge using governmentally assisted transactions. Additionally, voluntary mergers helped solve the growth management dilemma that many firms faced by utilizing excess cash to help expand in both market share and/or
market capitalization (Higgins, 2012). Presented here is a quantitative research study that seeks to answer the question: how do mergers and acquisitions (M&A)
affect share performance of the nation’s largest banks? Researching the answer to this question is one of potential importance to all consumers of banking services, portfolio managers, and individual investors interested in the performance of a bank’s common stock.
To answer the research question at hand, this paper will examine the past common stock performance of the ten largest American banking institutions to deter-mine if M&A had any statistical impact on stock price, earnings per share, and/or quarterly dividend payouts. This research will focus on exploring both correlation and causality. Recent data has shown that nearly 50% of the national deposit market share is held within these ten banks (Cox, 2015), more accurately presented as 46.94% (FDIC, 2015). Past research on stock performance, both pre- and post-acquisition, has been inconclusive as to the affect that M&A activity has on the stock performance in a publically traded company and requires additional examination. Due to the financial prominence and prowess of the ten largest banks in the United States, it seems prudent that a study examines the direct impact of bank-to-bank mergers on the acquiring firms share performance. The prominence of this subject matter requires additional investigation into past research, relying upon peer-reviewed journal findings and unbiased financial data from reputable sources.
LITERATURE REVIEW
The impact that merger and acquisition (M&A) activity has on share performance of acquiring firms is not a new subject matter, and has been analyzed by re-searchers for decades (Hackbarth & Morellec, 2008; Lee, 2013; Melicher & Harter, 1972; Mortal & Schill, 2015; Nielsen & Melicher, 1973). Within past literature, there have been many insights gained into the impact of premiums paid by companies that were merging (Nielsen & Melicher, 1973), the importance that method of acquisition payment plays on stocks (Chronopoulos, Girardone, & Nankervis, 2013; Mortal & Schill, 2015), and the ability of financially constrained firms to make wise merger decisions (Brune et al., 2015). When a company buys a firm through a purchase acquisition or via a hostile takeover, the financial impact of such reorganization creates a competitive edge for the acquiring company and creates costs for industry competitors (Largay & Zhang, 2009).
Recent reports have shown that the five largest banks operating in the US comprise just over 35% market share of the nation’s deposits (Cox, 2015), while the top ten banks control just under 50% of banking market (Arnold, 2014). This is due in part to bank consolidations, failures, and the need to eliminate work duplication (Brewer & Jagtiani, 2013). Over the past 30 years, the number of banks has fallen to less than half of what it was in the 1980’s (Kowalik et al., 2015), and mergers are allowing for less competition within the banking industry by forming oligopolies (Chehab, 2002). With nearly half of the nation’s deposit housed in just ten of the nation’s 6,273 registered banks (FDIC, 2015), it is of economic importance that the impact of M&A activity on bank stock prices be examined. As a matter of consumer and commercial finance, over 92% of the United States households use some kind of banking service, and thus necessary to further explore a topic that has far-reaching relevance (Burhouse, Chu, Goodstein, Northwood, Osaki, & Sharma, 2014). Research has shown that since the enactment of the Gramm-Leach-Bliley Act (1999), which modernized the longstanding rules set forth in the Glass-Steagall Act of 1933, there have been a plethora bank mega-mergers which have dominated the banking industry (Soper, 2001). These mega-banks have earned the moniker of being too-big-too-fail (TBTF) as they all have assets in excess of $100B (Brewer & Jagtiani, 2013). Some of these banks have merged willingly, while others were part of governmentally assisted transaction to help form these TBTF organizations, and create a competitive edge in the banking marketplace (Largay & Zhang, 2009). It is this idea of competitive edge derived from mergers, which requires exploration of the research question at hand.
The past decade has been a roller coaster ride for the American banking system with unprecedented income gains, large loan losses, and overall financial volatility that led to congressional passage of the Dodd-Frank Wall Street Reform and Consumer Protection Act (2010). The reforms in this act were designed to protect the American economy from being negatively impacted by the systematic financial risks taken by many of the nation’s banking institutions (Smith & Muñiz-Fraticelli, 2013) and put an end the idea that banks were TBTF (Brewer & Jagtiani, 2013). To manage the financial impact that this regulatory environment created, some firms chose to adopt an aggressive merger and acquisition strategy in hopes of growing assets, diversifying their portfolios, and entering into new geographic markets (Daddikar & Shaikh, 2014). This type of approach solved the management dilemma that many firms faced by utilizing excess cash to help expand in both market share and/or market capitalization (Higgins, 2012).
V
OLUMEN
O.
7
(2017),
I
SSUEN
O.
07
(J
ULY)
ISSN
2231-5756
INTERNATIONAL JOURNAL OF RESEARCH IN COMMERCE, IT & MANAGEMENT
Past research has focused on the impact that merger announcements have played on stock prices of merging firms, demonstrating that news of a merger will impact the target company’s stock price positively, while having little impact on the acquiring firm’s stock price (Hackbarth & Morellec, 2008; Largay & Zhang, 2009). The public pronouncement of an upcoming merger is an important factor in the share performance of consolidating firms; however, the focus of this research goes beyond just the announcement of a merger, and addresses the actual impact of a closed business transaction. Stock price increases based on announcement alone demonstrate a level of efficiency in the United States capital market by movement through information (Fama, 1970), but do these specu-lative increases translate into specific and measureable shareholder gains? Past research on stock performance, both pre- and post-acquisition, has created com-peting conclusions on this matter, and a generally accepted position awaits discovery. Established research has indicated that the stock prices of the acquiring firm will increase after a merger (Chehab, 2002; Melicher & Harter, 1972), whereas contemporary scholars argue that company procurement has minimal and near zero impact on stock prices (Bhabra, 2008; Bozos, Koutmos, & Song, 2013). Other researchers have pointed out that even as the purchase of companies may create growth, M&A activity creates a mediocre or losing proposition for shareholders (Higgins, 2012).
Research that infers positive stock price movement, is founded in the understanding that post-merger benefits arise from above market acquisition costs necessary for purchase of another business (Melicher & Harter, 1972). The reasons why companies merge, specifically banks, provides insight as to why decades old research provides contradictory results in identifying the direct correlation between stock price movement and M&A activity. As argued by Zhang (1998) while exploring bank mergers, “In theory, three major motives have been put forward: synergy, agency, and hubris. The synergy motive suggests value gains resulting from take-overs. The agency motive describes welfare-enhancing takeovers for the acquirer management at the expense of the acquirer shareholders. The hubris hypothesis explains the mistakes in the acquirer management's valuation of the takeover” (p. 1025). The findings in this study shows that motivating factors for M&A will impact the acquiring firms financial gain either positively or negatively based on the catalytic desire for unification, however most banks will merge for the purpose of synergy (Zhang, 1998). The unification of once competing firms, has allowed banks to create economies of scale, increase revenues, lower costs by operational efficiencies, diversify by expansion, and result in an efficient banking system that can benefit the domestic economy (Kowalik et al., 2015). This efficiency has also been linked to larger market gains, and abnormal stock price fluctuations (Aamir, Kouser, & Mujtaba Chaudhary, 2014; Agrawal, Jaffe, & Mandelker, 1992; Chehab, 2002). With a company restructured through synergy, “evidence exists to suggest that managers and investors factor post-merger profit efficiency and to a lesser extent cost efficiency opportunities into the offering prices” (Chronopoulos et al., 2013, p. 259).
Other researchers acknowledge that while a merger announcement may create a temporary increase in stock prices for the involved firms, there is no overall increase in performance for a post-merger firm, especially on stock purchase deals (Mortal & Schill, 2015). Additionally, in their study of non-financial firms, Mortal & Schill conclude that companies who grow their asset size organically have similar growth as merged firms, and that post-merger returns are undifferentiated from zero (2015). Other researchers argue that the stock prices will most likely show negative returns post-merger based on higher than market value premiums paid to acquire target companies (Largay & Zhang, 2009). In examining the long term shareholder impact of mergers, researchers have shown that stockholders of acquiring companies will be negatively impacted by a loss of wealth of about 10% over the five years post-merger completion (Agrawal, Jaffe, & Mandelker, 1992). While stock performance may also be attributed to external market factors outside of M&A activity, other researchers argue that the most important financial metric used in the acquisition of another company is not just company stock price, but stock dividend is of the highest importance then followed by P/E (Lee, 2013). This review of past literature has identified some areas of research disagreement, causing a need for further exploration.
OBJECTIVES
As demonstrated, a majority of past research has focused their attention on M&As of non-financial companies, the effect of equity vs. cash purchases, and the effect of merger announcement on both target and acquiring company stock prices. There appears to be a void in past research to discover the affect that mergers and acquisitions have on the stock performance of the largest banks in this nation, specifically those with the fiduciary responsibility for nearly half of all deposits in the United States (over $5T). To fill this gap in literature, there is a prudent need to research the relationship that exists between M&A and bank stock perfor-mance. The objective of this study is two part. First, this research aims to identify what impact bank mergers have on company stock perforperfor-mance. This occurs by testing pre-merger stock performance data with post-merge stock performance data. Secondly, this paper will identify those findings that are of benefit to investors and analysts of bank stock performance.
HYPOTHESIS
Based upon the research of previous scholars, to test the research question at hand, the overarching hypotheses of this study is:
H1 = M&A activity directly affects share performance in the nation’s largest banks
H0 = M&A activity does not directly affect share performance in the nation’s largest banks
RESEARCH METHODOLOGY
SAMPLING TECHNIQUE
To gather information on the specific population used in this study, a convenience sample technique was utilized based on the market share of the chosen insti-tutions. Data on these well-known and financially sound institutions is easy accessible to find, interpret, and analyze through variety of ways. For this research, all data was found using online databases that report stock performance information on a multitude of firms in a standardized format.
SAMPLE SELECTION
The ten institutions used in this report were chosen based on a recent report by the Federal Deposit Insurance Corporation (FDIC) identifying national deposit market share ranking as of June 2015. Considered for this study are the ten largest banking institutions, based on their fiduciary role of mainting nearly 50% of all the nation’s deposit dollars, totaling over $5 trillion of the nation’s $10 trillion. Only these ten banks will be examined, as the remaining 53% of the nation’s bank deposits are held amongst 6,173 regional and community banks. For the purpose of economic importance, only these firms ten will be included.
SCOPE
Based on market share data found within the FDIC BankFind database, the scope of this paper will examine the common stock performance of the ten largest FDIC insured, American-banking institutions (ranked in order of largest to smallest market share amongst the TBTF banks):
• BAC - Bank of America, National Association (FDIC #: 3510)
• JPM - JPMorgan Chase Bank, National Association (FDIC #: 628)
• WFC - Wells Fargo Bank, National Association (FDIC #: 3511)
• C - Citibank, National Association (FDIC #: 7213)
• USB - U.S. Bank National Association (FDIC #: 6548)
• PNC - PNC Bank, National Association (FDIC #: 6384)
• COF - Capital One, National Association (FDIC #: 4297)
• TD - TD Bank, National Association (FDIC #: 18409)
• STI - SunTrust Bank (FDIC #: 867)
• BK - The Bank of New York Mellon (FDIC #: 639),
Analysis of these sample institutions will determine if M&A had any statistical impact on stock price, quarterly dividend payouts, and earnings per share. To isolate the impact of M&A on bank stock performance, the data will only include information found within the following parameters:
• Focusing on the ten largest banks in the US (ranked by domestic market share) as of the June 30, 2015 FDIC market share report. Asset and market
V
OLUMEN
O.
7
(2017),
I
SSUEN
O.
07
(J
ULY)
ISSN
2231-5756
INTERNATIONAL JOURNAL OF RESEARCH IN COMMERCE, IT & MANAGEMENT
• Mergers and acquisitions from the 1st quarter of 2008 to the 4th quarter of 2015 are used due to the volatility and unprecedented regulation that began in
2008.
• Only full mergers and acquisitions are incorporated in this data, with the intentional exclusion of strategic buyouts of individual branches and lines of business.
Partial sales of offices and divisions are disqualified from this study, as many of these minor acquisitions affected only specific geographic locations. Examples of exclude transactions include US Bank Acquiring Charter One branches in Chicago in 2014, or Bank of America selling their Idaho and Eastern Oregon Branches to Washington Federal, also in 2014.
• Internal reorganizations such as divisional splits and affiliated corporate unification of divisions are excluded from this study.
• Only previously, unaffiliated corporate bank mergers will be included, such as voluntary M&A, governmentally assisted transactions, and hostile takeovers.
By using a restrictive scope, the goal of this research will aid in identifying whether a statistically significant relationship exists between a bank’s growth strategy and shareholder value.
DATA COLLECTION
Data has been collected focusing solely on the M&A history of all firms chosen since January 2008. This has allowed for a sufficient sample size needed for this case study. A quantitative examination of pre-acquisition stock performance trends and post-acquisition trends for each institution after a takeover has occurred. Using historical data gathered from Yahoo Finance, FDIC, and Mergent Online a profile for each of these institutions has identified 52 unique mergers that satisfy the parameters used for this project.
STATISTICAL TOOLS AND TECHNIQUES
The pre and post M&A data for each of the institutions tested are grouped as unique variables. Testing includes trend analysis and statistical testing to verify to see how mergers and acquisitions affect stock performance. SPSS and Excel are the platform tools chosen to analyze and test the data in hopes of discovering correlation and relational significance. The analysis of each variables uses a 95% confidence interval percentage (CI) to identify any areas where there was greater than a 5% statistical significance where p <.05.
DATA ANALYSIS
In a 1972 study, which analyzed the stock price movements of large company acquisitions, researchers attempted to discover the effect of M&A’s on acquiring firms (Melicher & Harter). A portion of the methodology used in this decades old study, compared average company stock prices six-months prior to merger, with average stock prices six-month post-merger, to identify if changes in prices were significantly different from zero. This six month time period was chosen as the appropriate timeframe for testing as it is far enough away from merger announcement and completion to have the averages overly influenced by speculation (Nielsen & Melicher, 1973). The results of this industrial study showed a lack of price differentiation from zero, when comparing pre-merger prices to post-merger prices.
The analysis of this 43-year-old study serves as the model for the data collection and testing in discovering the impact of large bank mergers. The data collected here focuses on more than just stock price movement, but also includes merger impact on quarterly dividend payouts, and earnings per share (EPS). Only the
mergers and acquisitions by the ten largest banks in the United States, since the first quarter following the start of the Great Recession (1st Quarter 2008), have
been included in this data resulting in 52 corporate acquisitions. Bank market share from a 2015 FDIC report is the primary method for determining which institu-tions are included within this investigation. Information for each M&A event was derived by using two different financial databases, Yahoo Finance and Mergent Online. Additionally, the information was collected by:
• Calculating both the average daily adjusted price common stock for each organization six months before the date of acquisition and the average daily
com-mon stock price from the date of acquisition to six com-months out (Yahoo Finance)
• Averaging the quarterly dividend payments per share for six months prior to the bank acquisition, and the average quarterly dividend payouts from the date
of merger to six months in the future (Yahoo Finance)
• Recording the average EPS Net Basic of the acquiring bank six-months prior to the merger, and identifying those numbers with the EPS from the date of
unification to six months post-merger (Mergent Online).
The entire dataset consisted of 52 unique bank mergers, identified as the following independent variable groups:
• AvgPrice6moPrior: Six-month pre-merger stock price average, up to the day before finalization of company acquisition.
• AvgPrice6moPost: Six-month stock price average from the date of merger plus six months.
• AvgDiv6moPrior: Six-month average dividend payout prior to merger, including only those quarterly dividend payments that occurred within the six-month
measurement window.
• AvgDiv6moPost: Six-month average dividend payout after the finalization of the announced merger, including only those quarterly dividend payments that
occurred within the six-month measurement window.
• AvgEPS6moPrior: Six-month average EPS as reported on the companies standardized quarterly income statement within the six-month measurement window
pre-merger.
• AvgEPS6moPost: Six-month average EPS as reported on the companies standardized quarterly income statement within the six-month measurement window
before merger.
TESTING OF THE HYPOTHESIS
In order to identify if any significant trends exist to the stock performance of an acquiring firm, the means of each variable pair are calculated and compared side by side both numerically and visually. On the surface, these numbers provide an interesting perspective on the impact that M&A activity has had on these large financial institutions. Based upon the raw data collected, the stock performance of these ten institutions provides a mixed message as to the impact of acquiring a smaller competitor.
TABLE 1: CHANGE IN BANK STOCKS AFTER M&A
In calculating the means of each examined category, a basic trend has begun to evolve showing negative stock performance as an average for these institutions. The variable means are calculated by taking the total stock, divided, or EPS and dividing by the number of the M&A cases for this study; in this case 52. To calculate
the percent change of each variable, all data was computed using the formula:( ), a variation of the standard percent change
equation (Berman, Knight, & Case, 2013). These averages are not an accurate reflection of the unique financial results experienced by each institution, but rather an overall mean of the cumulative pre and post-merger results of all ten banks analyzed. The individual results of each bank varied. Some of the entities have shown an increase in all three the tested categories (USB, PNC, COF), while others showed gains/no losses in at least two areas (C, TD, STI, BK), and the remaining firms in this sample identified average losses in all three fields (BAC, WF, JPM). Additionally, all variable sets were further analyzed to calculate the standard deviation and mean of each. In doing so, a negative downward trend emerged.
Bank M&As Since 1st Quarter 2008
Average Change In Price Per Share
Average Change in Quarterly Dividend Per Share
Average Change In Earnings Per Share
V
OLUMEN
O.
7
(2017),
I
SSUEN
O.
07
(J
ULY)
ISSN
2231-5756
INTERNATIONAL JOURNAL OF RESEARCH IN COMMERCE, IT & MANAGEMENT
TABLE 2: PAIRED SAMPLES STATISTICS
Mean N Std. Deviation Std. Error Mean
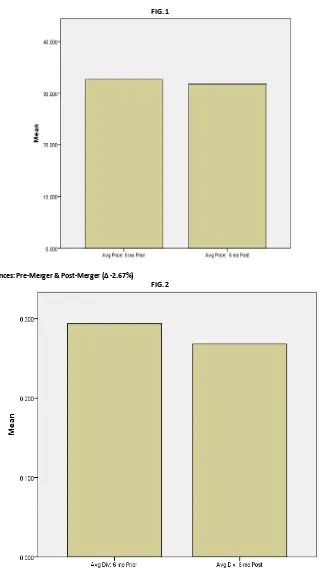
Pair 1 Avg Price: 6 mo Post 31.80327 52 11.227205 1.556933
Avg Price: 6 mo Prior 32.67731 52 12.201663 1.692066
Pair 2 Avg Div: 6 mo Post .26821 52 .217958 .030225
Avg Div: 6 mo Prior .29386 52 .243070 .033708
Pair 3 Avg EPS Net Basic: 6 mo post .42346 52 .466951 .064755
Avg EPS Net Basic: 6 mo prior .62774 52 .534820 .074166
Between all ten banks, the cumulative comparison between both pre and post-merger means identified this visual downward trend:
FIG. 1
Average Stock Price Differences: Pre-Merger & Post-Merger (∆ -2.67%)
FIG. 2
V
OLUMEN
O.
7
(2017),
I
SSUEN
O.
07
(J
ULY)
ISSN
2231-5756
INTERNATIONAL JOURNAL OF RESEARCH IN COMMERCE, IT & MANAGEMENT
Average EPS Differences: Pre-Merger & Post-Merger (∆ -32.54%)
FIG. 3
The raw percentage change in both pre and post-merger data show minor deceases in the stock performance area tested within study. The negative change in price performance dropped only slightly, while the reduction in dividend and EPS were more pronounced. These numbers are averages amongst the 52 mergers
that occurred between the 1st full quarter of 2008 until the 4th quarter of 2015. This snapshot of averages, as interesting as they may be, require further testing to
determine whether the pattern that has emerged is of any statistical significance. To do so requires analysis of these six variables through a more in-depth level of testing. In testing to see if the resulting decreases in stock performance are statistically significant, a paired samples t-test is used to determine whether the changes seen within these three areas are different from zero.
A boxplot exploration for each of the six variable group discovered that there were no outliers within the Avg6moPricePrior, Avg6moDivPrior, and Avg6moDivPost. The boxplot analysis of the Avg6oPricePrior yielded three outliers that were greater than 1.5 box lengths outside the edge of the box, while the variables Avg6moEP-SPrior and Avg6moEPSPost each had one potential outlier. In reviewing the data, the inputs are correct and the values did not reveal the outliers as extreme, allowing for their continued inclusion into this study. The Normal Q-Q Plot provides a visual inspection of each variable, identifying a pattern of normal distribution:
NORMAL Q-Q PLOT: STOCK PRICE
FIG. 4 & 5
NORMAL Q-Q PLOT: QUARTERLY DIVIDEND PAYOUT
V
OLUMEN
O.
7
(2017),
I
SSUEN
O.
07
(J
ULY)
ISSN
2231-5756
INTERNATIONAL JOURNAL OF RESEARCH IN COMMERCE, IT & MANAGEMENT
NORMAL Q-Q PLOT: NET BASIC EARNINGS PER SHARE
FIG. 8 & 9
Paired Sample T-test. As the variables are paired to calculate statistical impact, the hypothesis of this study is revised and reduced to each variable pair as follows:
STOCK PRICE
• HP1 = M&A activity directly affects common stock price in the nation’s largest banks • HP0= M&A activity does not directly affect common stock in the nation’s largest banks
QUARTERLY DIVIDEND PAYMENTS
• HD1 = M&A activity directly affects stock dividend payments in the nation’s largest banks • HD0 = M&A activity does not directly affect stock dividend payments in the nation’s largest banks
EARNINGS PER SHARE
• HE1 = M&A activity directly affects EPS in the nation’s largest banks • HE0 = M&A activity does not directly affect EPS in the nation’s largest banks
For proper comparison the variables chosen in this study, a paired sample t-test was conducted to accurately identify the statistical significance of the stock
performance impact caused by M&A activity among the largest domestic banking institutions. In this test, all calculations used the standard equation: = /.
For testing purposes, all post-merger variables act as Variable 1 as these were the dependent variables, and the pre-merger variables are Variable 2 acting as the independent variables. Variable 2 acts as control to identify if there exists any post-M&A impact on stock performance.
VARIABLE ASSOCIATIONS
As a matter of measuring the strength of relationship between each pair of variables, an initial Pearson Correlation Coefficient examination identified some inter-esting findings as the association between these continuous variables sets. This data test shows correlation between variables, not necessarily causality as ex-plained in other testing. The sample size of 52 allows for accuracy of identifying correlation, while not diluted by an overly large dataset. Not all variables demon-strate a statistically significant association to one another, however the strength of correlations is most predominant in the variables pairs of pre (prior) and post-merger activity in price, dividend payout, and earnings per share.
TABLE 3: VARIABLE CORRELATIONS
Avg Price: 6 mo Prior
Avg Price: 6 mo Post
Avg Div: 6 mo Prior
Avg Div: 6 mo Post
Avg EPS Net Basic: 6 mo prior
Avg EPS Net Basic: 6 mo post
Avg Price: 6 mo Prior Pearson
Correla-tion 1 .773** .635** .731** -.178 -.202
Sig. (2-tailed) .000 .000 .000 .206 .151
N 52 52 52 52 52 52
Avg Price: 6 mo Post Pearson
Correla-tion .773** 1 .189 .298* -.139 -.184
Sig. (2-tailed) .000 .179 .032 .325 .192
N 52 52 52 52 52 52
Avg Div: 6 mo Prior Pearson
Correla-tion .635
** .189 1 .946** -.218 -.171
Sig. (2-tailed) .000 .179 .000 .120 .226
N 52 52 52 52 52 52
Avg Div: 6 mo Post Pearson
Correla-tion .731** .298* .946** 1 -.224 -.179
Sig. (2-tailed) .000 .032 .000 .111 .204
N 52 52 52 52 52 52
Avg EPS Net Basic: 6 mo prior
Pearson
Correla-tion -.178 -.139 -.218 -.224 1 .095
Sig. (2-tailed) .206 .325 .120 .111 .496
N 52 52 52 52 53 53
Avg EPS Net Basic: 6 mo post
Pearson
Correla-tion -.202 -.184 -.171 -.179 .095 1
Sig. (2-tailed) .151 .192 .226 .204 .496
N 52 52 52 52 53 53
**. Correlation is significant at the 0.01 level (2-tailed). *. Correlation is significant at the 0.05 level (2-tailed).
Analysis of variable correlations and examination of the relationship strength between variable pairs discovered:
V
OLUMEN
O.
7
(2017),
I
SSUEN
O.
07
(J
ULY)
ISSN
2231-5756
INTERNATIONAL JOURNAL OF RESEARCH IN COMMERCE, IT & MANAGEMENT
• A strong relationship exists between the stock price variables, where r=.773, and a significance of p<.0001 which satisfies the alpha of statistical significance.
• Surprisingly, a weaker relationship is found among the earnings per share variables. The EPS ratio shows a correlation significance of r =.095, which denotes
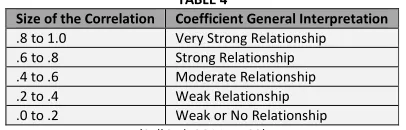
a weak correlation. This may be due in part to the use of negative numbers in the earnings per share calculations. The strength of relationship is based on the following interpretation of the association.
TABLE 4
Size of the Correlation Coefficient General Interpretation
.8 to 1.0 Very Strong Relationship
.6 to .8 Strong Relationship
.4 to .6 Moderate Relationship
.2 to .4 Weak Relationship
.0 to .2 Weak or No Relationship
(Salkind, 2014, p. 92)
The paired sample t-tests reveal the following information about the differences between each variable pair:
TABLE 5: PAIRED SAMPLES TEST
RESULTS
The findings of the paired sample t-test confirmed much of what was initially discovered in the visual trend analysis of pre- and post-merger activity. The test
shows a mild impact on each of the three variable pairs as demonstrated by the negative mean values. The t values, though reporting as negative, discuss their
relation to the hypothesis and only show that indeed a difference between the two variable sets exits. The significance of each variable pair describes interesting findings that clarify how independent these variables are to one another.
Stock price. The results from at a 95% CI identify a mean decrease of -.874 in the post-merger stock price when compared to pre-merger pricing. The 2-tailed
significance results on stock price show that p=.431. This would not satisfy the statistical requirement that p<.05. The calculated p in this paired test shows that
the significance between each variable is not statistically significant from zero, confirming the results of past researchers (Hackbarth & Morellec, 2008; Largay & Zhang, 2009), and affirming the null hypothesis.
Stock Dividends. Much like stock prices, the mean difference between the dividend pairs shows a decrease, however much smaller at -.0256. Unlike the significance
level of stock price performance, the statistical impact on dividends revealed a p =.025 which satisfies the significance factor of p <.05. The results show a statistical
correlation confirming that within this sample, bank mergers affect quarterly stock dividends at a significance level greater than zero. This result has rejected the null hypothesis for stock dividends, while confirming the hypothesis for this study.
Earnings per share. This paired sample t-test calculated a mean decrease of -.204 between pre and post-merger earnings. Independent of stock price and dividend
per share payments, the earnings per share resulted in a p =.034, showing a significance greater than zero where p <.05. The p value rejects the null hypothesis
for earnings within this sample, showing significance between pre- and post-merger stock performance.
DISCUSSION
The findings of this investigation paint a picture of both variable correlation and independence. By analyzing stock performance using three indicators, rather than solely relying on stock price, patterns have emerged through the data to provide valuable information. Stock price, though a readily available indicator of share performance, does not tell the whole story of overall stock performance. When a surviving firm acquires a smaller banking institution, the impact on price can be so minor that it is insignificant. An investor looking to grow the value of their portfolio through speculative purchase of banks who are actively acquiring other institutions will find that the resulting increase in price may never materialize. Past research has found that stock prices may rise at the announcement of a merger, but then will drop after the initial increase (Hackbarth & Morellec, 2008). There can still be short-term increases that occur in acquiring firm stock price, but these are isolated examples and not reflective of the major corporations within the industry. If anything, investment among these companies both post and pre-merger show minimal declines and moderate price stability during each time period tested.
The raw data shows large increases and declines amongst stock price, dividends, and earnings per share among all banks tested. Cumulatively, these banks demon-strate that their M&A activity creates a negative impact on their overall stock performance, as both dividends and EPS declined. A positive indicator amongst the data showed that even through economic hardship, every bank was able to pay their shareholders with quarterly dividends. These banks, though tested, main-tained their financial integrity while continuing their operations. Even as the number of banks continues to decline nationwide to mergers and institutional failures, “bank mergers can result in more efficient banks and a sounder banking system and thus benefit the economy, as long as banking markets remain competitive and communities’ access to banking services and credit is not diminished” (Kowalik et al., 2015, p. 31). The banks tested in this study show that even as statistically significant relationships between pre- and post-merger stock performance can occur, the strength of these stocks are still a stable investment for long term investors and portfolio managers, regardless of temporary and cyclical turbulence. The findings in this analysis do not indicate whether the relationship created by M&A will indicate positive or negative share performance, only that there is a statistically significant causal relationship by M&A on EPS and dividend payments.
CONCLUSION
The three individual paired t-tests analyzing stock price, quarterly dividends, and earnings per share provided three unique results. Stock prices were lowered by a small margin and found to reinforce the findings of past literature, and thus demonstrating a lack of differentiation from zero (Melicher & Harter, 1972). Surpris-ingly the same was not true for the either quarterly dividends or earnings per share, as both are affected by a bank acquiring another institution. The firms used in this sample size are not minor, but rather they currently have the fiduciary responsibility of maintaining a significant portion of deposits within the domestic banking industry (Cox, 2015). In terms of investor understanding and confidence, the discoveries of this study demonstrate that M&A activity has greater financial impact on stock performance than only affecting price. Well-informed investors understand that there is more to choosing a bank stock than only an increase in share price value, this study adds to the body of investor knowledge showing that M&A activity can drive down both dividends and EPS while creating losses for shareholders.
Additionally, the tests concluded that even in an industry where certain firms are considered “too big to fail” (Brewer & Jagtiani, 2013), growth activities can have negative stock impact for the acquiring firms, regardless of size or market share. Even though the number of deposits, assets, offices, and loans may increase on a bank’s financial statement when acquiring a smaller competitor, there is still financial risk that can manifest as negative stock performance. Banks that choose to
Paired Differences
t df
Sig.
(2-tailed) Mean
Std. Devia-tion
Std. Error
Mean
95% Confidence Interval of the Difference
Lower Upper
Pair 1 Avg Price: 6 mo Post - Avg Price: 6 mo Prior -.874038 7.946858 1.102031 -3.086458 1.338381 -.793 51 .431
Pair 2 Avg Div: 6 mo Post - Avg Div: 6 mo Prior -.025648 .079845 .011073 -.047877 -.003419 -2.316 51 .025
Pair 3 Avg EPS Net Basic: 6 mo post - Avg EPS Net Basic: