ASSESSMENTS OF THE EFFECTIVENESS OF THE CROATIAN
FISCAL EQUALISATION MODEL
Anto Bajo, DSc Article*
Institute of Public Finance UDC 336.2
and Faculty of Economics and Business, Zagreb JEL H73, H72, H74 Mihaela Bronić, MSc
Institute of Public Finance, Zagreb
Abstract
No detailed analysis of the fiscal and economic inequalities of local units (at the mu-nicipality and city level) in Croatia has ever been published. The Government and the Fi-nance Ministry have endeavoured by tax sharing, allocations of current grants and per-sonal income tax refunds to palliate the differences in the fiscal capacities of local units. However, at the same time the fiscal capacities have not been properly calculated, because during the definition of the criteria for horizontal fiscal equalisation no care has been paid to the economic inequalities nor has there been proper establishment of the way local units belong to a special financing system. The paper, then, tests out the hypothesis that the existing Croatian model of horizontal fiscal equalisation is ineffective, for the Gov-ernment and the Finance Ministry do not, with their poorly targeted financial instruments (personal income tax sharing, current grants and personal income tax refunds), manage to bring about palliation of the differences among the fiscal capacities of the local units, on the contrary, they tend to increase them.
Key words: fiscal equalisation, tax sharing, personal income tax, personal income tax refund, fiscal capacity, Croatia
1 Introduction
Since acquiring independence, Croatia has not worked out detailed analyses of the fis-cal and economic inequalities of lofis-cal units, nor has it established a proper model of fisfis-cal
equalisation. From 1995 to 2007, 275 local government units obtained special status in the financing system. These are the areas of special national concern (areas/categories I, II and III), the hill and mountain areas, and some of the islands with the special status obtained from their being willing jointly to finance capital projects. The Government and the Min-istry of Finance have mostly used tax sharing and personal income tax refunds as the main instrument for palliating horizontal inequalities and rarely allocating current grants from the central government budget. However, because of the lack of good criteria and annual analyses of changes in the financial positions of local units the Government, the Finance Ministry and the Ministry of the Sea, Transportation, Development and Tourism do not determine their real degree of fiscal capacity each year, or the level of fiscal and economic inequalities and the justification of retaining the special status in financing.
The main proposition of this work is that the Government and Finance Ministry by sharing personal income tax, allocating current grants and personal income tax refunds do not actually significantly contribute to alleviation of horizontal fiscal inequalities. After the introduction, in the second part of the paper the problems in fiscal equalisation are ex-plained. The third part analyses the existing model of fiscal equalisation, which is based on personal income tax sharing, the allocation of current grants and the refund of person-al income tax. In the fourth part, on a sample of 546 municipperson-alities and cities, horizontperson-al fiscal inequalities are assessed for 2004 and the question of whether the government ac-tually induces a growth in fiscal inqualites is answered. Part five contains conclusions, proposals and recommendations.
2 Problems in fiscal equalisation
From 1993 to 2007 the system of financing local government units was marked by the establishment of areas of special national concern, hill and mountain areas, local units on the islands that have entered into agreements to finance capital projects and the so-called decentralisation of the financing of local government units. However, the basic issues were not settled: a clear distribution of responsibilities and authorities for the financing of given functions and a distribution of revenue between central government and the local units. In the financing of some of the functions there are elements of dualism. The Gov-ernment, the Finance Ministry and the line ministries have only since 2001 devolved part of the authority for the financing of elementary and secondary education, health care and fire services to the local units. Unfortunately, Croatia still does not have a well-devised strategy of regional development in which special attention is dedicated to the model of financing local units with the emphasis of aid to areas with economic difficulties in their development and problems with financing the minimum standard of public services.
the fiscal relations of central government and the local government units. Up to now gov-ernments have paid more attention to legislative regimes and through numerous amend-ments to the laws concerning the areas of local units (municipalities, cities and counties) created the illusion that fiscal decentralisation exists. This kind of status quo has had a direct effect on deepening the disagreement about a desirable model for the financing of local units. Still unsolved is the issue of whether central government should give some productive taxes to the local units or by tax sharing and by current grants reallocate more revenue to the local units. In such conditions the question arises as whether there is actu-ally in Croatia a trend towards decentralisation or centralisation. It seens like Croatia has determined on the domination of central government (the Government, the Finance Min-istry and the line ministries) in a system of financing that is largely founded on the tax sharing (particularly personal income tax) and the allocation of current grants from the central government budget.
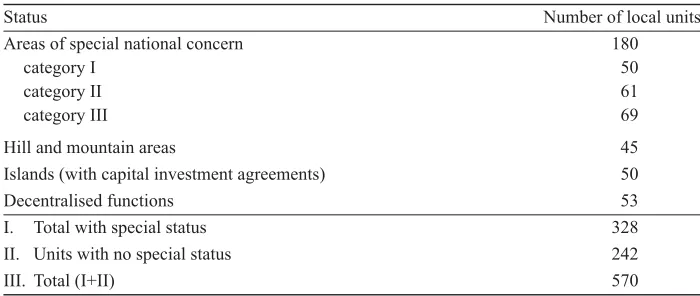
Problems in the redistribution of revenue to local units have been particularly percep-tible since 1995, when the areas of special national concern, the hill and mountain areas and some island local units that acquired a special status in the financing system. As a re-sult of such a situation and of political and economic lobbying, in 2007, more than half the local units are in some special financing system (Table 1).
Table 1 Local units in a special financing status in 2007
Status Number of local units
Areas of special national concern 180
category I 50
category II 61
category III 69
Hill and mountain areas 45
Islands (with capital investment agreements) 50
Decentralised functions 53
I. Total with special status 328 II. Units with no special status 242
III. Total (I+II) 570
Note: On the areas of special national concern, hill and mountain areas and islands (with capital investment agreements) there are 275 local units.
Source: Ministarstvo financija (2001-2006)
Areas of special national concern and the hill and mountain areas. In 1996, two groups of special national concern were designated, and a third group joined them in 2002 (NN 26/03). In these areas there are 180 local units (50 in the first, 61 in the second and 69 in the third). Groups I and II were set according to the degree of economic damage caused by the war. The third group consists of areas evaluated as lagging in terms of velopment according to four criteria: economic development, structural difficulties, de-mography and special criteria. It was established that the three groups together can cover up to 15% of the total population of the country. Since 2002, 45 local units have had the status of hill and mountain areas for the sake of their more rapid and even economic de-velopment. The Government and the Finance Ministry regularly give the areas of spe-cial national concern and the hill and mountain areas current grants from the central gov-ernment budget and also introduced additional incentive measures. Since 2001 they have ceded almost all revenue from personal income tax and corporate income tax to the cities and municipalities in the areas of special national concern and since 2003 to the hill and mountain areas as well. Various reliefs have been introduced in the real estate transfer tax as well (Table 1, annex). The rates of corporate income tax have been reduced for some groups of taxpayers, privileges have been introduced with respect to the charge for ex-ploiting mineral raw materials and other privileges have been given to legal entities and individuals in the areas of special national concern.
Incentive measures for the islands. For the sake of the protection of the islands and for a more rapid demographic development, in 2003 the Government incentive measures for the development of 45 island local units. These measures took the form of preferential treatment in the purchase or lease of agricultural land, the financing of capital projects re-lated to water and water supply, physical planning and improvement of the transportation infrastructure. From 2001 to 2007 central government ceded its part of personal income tax revenue to island municipalities and cities that had entered into agreements with each other to finance capital projects. In 2007 the government and the Finance Ministry ex-empted these units from the obligation to pay part of the personal income tax revenue into the equalisation fund. The previous fund resources became the revenue of the island local government units meant for the financing of capital projects (Table 1, annex).
Decentralised functions. During 2001 new regulations were adopted according to which some responsibilities of the central government administration were decentralised and transferred to the local and regional self-government. Local units obtained new as-signments in the area of elementary and secondary education, health care, welfare and fire services. Fifty three local units (20 counties and the city of Zagreb and 32 other cit-ies) accepted the obligation to finance decentralised functions. The Government, Finance Ministry and the line ministries provided these units with funding by an additional share in personal income tax and equalisation grants.
in-come tax paid irrespective of changes in the economic positions of local units that ac-quired a special status in the financing system.
Revenue inequalities
The question arises as to whether the Government and the Finance Ministry in the tax sharing and the allocation of current grants from the central government budget real-ly paid attention to the existing economic inequalities of the local units. A good indicator of economic inequalities is the gross per capita personal income in the cities and munici-palities. The available 2004 data show noticeable differences in the distribution of gross personal incomes in the local units that are in the special financing status (areas of special national concern, hill and mountain areas and the islands with capital investment agree-ments) and the other local units that do not have this status. We should look then at the total distribution of gross personal incomes of the local units.
Table 2 Distribution of gross personal income per capita of local units in 2004
Gross personal income (in kuna per capita)
Local units, total
%
Local units in areas of special national
concern, hill and mountain areas and
on the islands
%
Other local units
%
over 20,000 141 26 63 23 78 29
16,000-20,000 106 19 54 20 52 19 12,000-16,000 135 25 60 22 75 28
8,000-12,000 117 21 66 24 51 19
to 8,000 47 9 31 11 16 6
Total 546 100 274 100 272 100
average = 16,000
above average 247 45 117 43 130 48 below average 299 55 157 57 142 52 75% of the average 164 30 97 35 67 25
Source: Authors calculation based on data from Tax Administration, Republic of Croatia
In 2004 the average gross per capita personal income of the local units came to about 16,000 kuna. Above average personal income was in 257 local units, and below average in 299 local units. One hundred and sixty four local units had less than 75% of the aver-age per capita personal income, and these should be the main candidates for the Govern-ment and Finance Ministry to support more significantly via the fiscal equalisation sys-tem. However, there are certain illogicalities connected with the acquisition of a special status in the financing system.
government units had below average gross per capita personal income. However, only 97 local units had a gross personal income lower than the 75% average at the level of mu-nicipalities and cities and they are the real candidates for more active fiscal support from central government. We can conclude that some of the local units that are currently in the special financing regime do not need to be so and that there are numerous local units with lower average personal incomes that the government neither supports nor puts in a spe-cial financing system.
Thus of the 272 local units that are outside the special financing system, 130 of them have above and 142 units below average personal income. As many as 67 local units meet the requirements to obtain transfers from the central government budget because they have a gross per capita personal income below the 75% average at the level of cit-ies and municipalitcit-ies.
In the sequel we shall go on to analyse the mechanisms of redistribution of person-al income tax among centrperson-al government and locperson-al units via personperson-al income tax shar-ing, allocation of current grants and refunds of personal income tax. On the basis of sim-ple regression models on the basis of the 546 local units in 2004 we shall assess the fis-cal effects of mentioned government transfers on the alleviation of lofis-cal horizontal eco-nomic inequalities.
3 Fiscal equalisation model
Local units differ according to their degree of economic development and their abili-ties to collect revenue in their area. This is the result of the different natural, demographic, economic and political conditions affecting the development of the given areas. To palliate fiscal inequalities created because of the different abilities to collect revenue at the lower levels of government the mechanism of fiscal equalisation is used. There are two kinds of fiscal equalisation: vertical and horizontal. Through vertical fiscal equalisation, central government endeavours to provide resources adequate for the financing of the basic or additional (decentralised) functions of local units. The mechanism of horizontal equalisa-tion on the other hand endeavours to soften the fiscal inequalities deriving from unequal economic development of local units, in order to provide the minimum necessary level of public services in all the local units. The basic instruments of vertical fiscal equalisation are revenue/tax sharing and of horizontal fiscal equalisation grants.
3.1 Vertical fiscal equalisation
the budgets of local units of a productive source of revenue. The division of the revenues from these taxes is a powerful instrument in the hands of the Government and the Finance Ministry for the palliation of unequal fiscal capacities, and is also a strategic instrument in the running of fiscal policy. By increasing or reducing the share of local units in the tax revenue, the Government and the Finance Ministry can tend to produce an equal distri-bution of revenues and tax burdens. For this reason the taxes that the central government shares with the local units are the main reason of fiscal equalisation.
Tax sharing
In Croatia governments to date have used tax sharing as an instrument: a) for palliat-ing vertical inequalities arispalliat-ing because of the assumption of decentralised functions and b) horizontal fiscal equalisation for the sake of palliating regional economic differences arising as the result of different development of local units (due to unemployment, demo-graphic characteristics and so on).
Tax sharing for vertical fiscal equalisation. The system for the financing of local units is very largely based on the tax sharing (particularly personal income tax) between cen-tral government and the local units. The Financing of Units of Local and Regional Self-Government Law, which governs the tax sharing is not easy to understand. From 1993 on it has changed 11 times, and in the 2001-2007 period alone it was altered six times.1 Such
frequent alterations of the Law and of the manner of personal income tax sharing create confusion from the point of view of the role and fiscal effects of the tax on the financial positions of the local units.
From 1994 to 2001 central government ceded to the counties, municipalities and cit-ies some of the tax revenues raised in their areas (Table 3).
Table 3 Tax sharing from 1994 to 2001 (in %)
The tax Central
government Counties
Cities and
municipalities Zagreb
Personal income 60 8 32 –
Personal income, Zagreb 60 5 – 35
Corporate income 70 10 20 –
Corporate income, Zagreb 70 – – 30
Real estate transfer 40 – 60 –
Source: Zakon o financiranju jedinica lokalne uprave i samouprave
Local units that take on the financing of decentralised functions have been given by central government a larger share in the personal income tax since 2001 (Table 4).
1 Zakon o financiranju jedinica lokalne uprave i samouprave, NN 117/93, 69/97, 33/00, 73/00, 127/00, 59/01,
Table 4 Tax sharing from 2001 to 2006 (in %)
The tax Central
government Counties
Cities and municipalities
Decentralised functions
Equalisation fund Personal income 25.6 10 34 10.4 21
Corporate income 70 10 20 – –
Real estate transfer 40 – 60 – –
Source: Zakon o financiranju jedinica lokalne uprave i samouprave
Apart from that, if they cannot finance the decentralised functions (up to the level of the established minimum financial standard) with the revenue obtained from personal in-come tax, the local units will receive additional resources from the equalisation fund. This fund is actually part of the personal income tax revenue that central government cedes to local government units for the funding of the decentralised functions. Only 345 local units take part in filling this fund. The remaining 225 local units are exempted for they are in a special position in the financing system (areas of special national concern and hill and mountain areas).2
In 2007 the Government and the Finance Ministry once again changed the percent-age share of the local government units in the tax sharing (Table 5).
Table 5 Tax sharing as of 2007 (in %)
The tax Central
government Counties
Cities and municipalities
Decentralised functions
Equalisation fund
Personal income – 15 52 12 21
Corporate income 100 0 0 – –
Real estate transfer 40 – 60 – –
Source: Zakon o financiranju jedinica lokalne uprave i samouprave
Central government has taken all the corporate income tax and retained the same share of real estate transfer tax as in the previous year. Thus corporate income tax is now paid entirely into the central government budget.
3.2 Horizontal fiscal equalisation
Horizontal fiscal inequalities (differences in the abilities of local units to provide equal public services with the same tax burden) increase if there is any disharmony be-tween the expenditures of local units and their fiscal capacities (i.e., ability to
gath-2 Central government gave these local units a larger share of the personal income tax revenue collected in their
er revenue). Before decentralisation in 2001 there were no searching analyses of the effects of the Government’s measures on the palliation of the existent horizontal fis-cal inequalities, and it is doubtful whether or not since 2001, because of the confusing mechanisms and criteria for the allocation of current grants from the central govern-ment budget, new inequalities have arisen. In practice the main instrugovern-ment of horizon-tal fiscal equalisation consists of various kinds of current and capihorizon-tal grants. Howev-er, in Croatia instead of developing an effective mechanism for both current and capi-tal grants, the Government and the Finance Ministry have used tax sharing as the main instrument for palliation of horizontal fiscal inequalities, irrespective of the economic indicators of local units.
Tax sharing
As well as for the palliation of vertical inequalities deriving from the assumption of the decentralised functions, Governments so far have made use of tax sharing as an in-strument for horizontal fiscal equalisation i.e., as a fiscal measure for the softening of re-gional economic inequalities. The Government, the Finance Ministry and the competent ministries have bolstered the areas of special national concern and the hill and mountain areas and the island units that have made agreements with each other to finance capital projects by tax sharing.
Moreover the Finance Ministry and the Government regularly provide the areas of special national concern and the hill and mountain areas with grants from the central budg-et. Since 2001 the areas of special national concern and since 2003 the hill and mountain areas have been given additional incentives too by the Government, Finance Ministry and line ministries. They cede the municipalities and cities in these areas revenue from corporate income tax and personal income tax almost entirely. Also introduced are vari-ous forms of tax reliefs in the transfer of real estate, corporate income tax rates for certain groups of taxpayers have been cut, and other privileges for individuals and legal entities in the areas of special national concern.
Table 6 Tax sharing in the areas of special national concern and hill and mountain areas in %
The tax Central
government Counties
Cities and municipalities in areas of special
national concern
Personal income – 10 90
Corporate income, 2003-2006 – 10 90 Corporate income, as of 2007 100 – –
Source: Zakon o financiranju jedinica lokalne uprave i samouprave
areas aid directly from the central budget in the amount of the corporate income tax that is raised in their area. In the central government budget for 2007, for this purpose 287 million kuna was earmarked (NN 137/2006).
Tax sharing for the financing of capital projects. For the sake of protecting the is-lands and for their accelerated demographic development, in 2003 the Government in-troduced incentive measures for the development of 45 island local units. These consist of privileges in the purchase or leasing of farmland, the financing of capital projects re-lated to water and water supply, for spatial planning and improving the transportation infrastructure. Also as of 2007 the Government and Finance Ministry have additional-ly exempted island units from the obligation to pay part of the personal income tax to the equalisation fund, and this has become their own additional revenue for the financ-ing of capital project.
It is extremely clear that the Government, Finance Ministry and other competent min-istries have supported the areas of special national concern, the hill and mountain areas and some island local units not because of their low fiscal capacities but for social reasons. These are more or less, we might recall, areas that were hit in the war and are inadequately developed, areas with high unemployment and adverse demographic characteristics. Current grants from the central government budget
Up to 2005 the Government and the Finance Ministry used current grants from the central budget as an additional (and not the main) instrument for palliating horizontal fiscal inequalities. Since 2005 the Government has changed their purpose, and current grants have become capital grants from the central budget (for simplicity we call them current grants).
Current grants are allocated to financially weaker local units with below-average fis-cal capacities. Unluckily, the criteria are not clear, and hence the current grants cannot be used effectively for the palliation of the existing financial inequalities of local units.
From 1994 to 2001 current grants were allocated to counties in the area of which the revenue of all the local units (i.e., the cities and municipalities), not including the city of Zagreb, was less than 75% of the national per capita personal income. It is assumed in this that all the local units have the average tax burden. Current grants could not be al-located to a county in the area of which the rate of surtax on personal income tax (sur-tax) was less than 1%, and the tax rates and amounts of taxes were lower than the statu-torily prescribed highest rates or amounts. In a similar way, counties were able to allo-cate current grants to the municipalities and cities in their area. Unfortunately, howev-er, although defined in the law, these rules were not applied in the real calculation and the definition of criteria for the allocation of current grants to local units. It is interest-ing that these criteria, although no longer used, are still stated in the Financinterest-ing of Local and Regional Self-Government Law, and most of the EU countries also use them in de-termining the objectives of regional policy for selecting those areas that are lagging in development and need help.
crite-ria for the allocation of current grants, firstly directly to the counties (which then transfer them to their own municipalities and cities) and secondly the direct current grants of cen-tral government to the cities and municipalities in the areas of special national concern. Current grants to counties
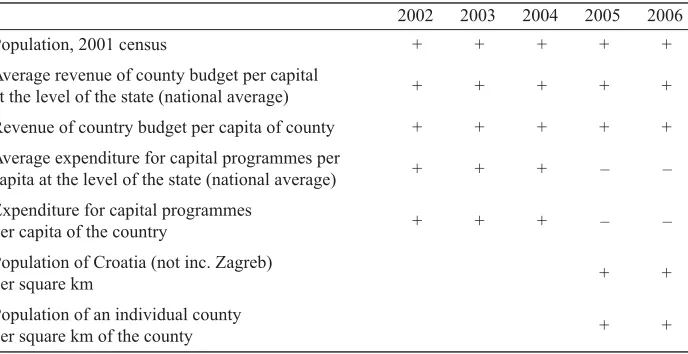
From 2002 to 2006 the criteria for the allocation of current grants to the counties were frequently altered.3 From 2002 to 2005 these grants were meant for the adjustment of
fis-cal capacities and for investment in the development programmes of the counties and the cities and municipalities in their area.
Table 7 Criteria for the allocation of current grants from the central government budget to the counties
2002 2003 2004 2005 2006 Population, 2001 census + + + + +
Average revenue of county budget per capital
at the level of the state (national average) + + + + +
Revenue of country budget per capita of county + + + + + Average expenditure for capital programmes per
capita at the level of the state (national average) + + + – –
Expenditure for capital programmes
per capita of the country + + + – –
Population of Croatia (not inc. Zagreb)
per square km + +
Population of an individual county
per square km of the county + +
Source: Zakoni o izvršavanju državnog proračuna (2001-2006)
But from 2005 the Government changed the purpose of these current grants and pro-vided them only for investment in development programmes of the counties and the small-er units in their areas. Thus from 2005 central govsmall-ernment has not handed the counties any current but only capital grants. It is expressly stated in the law that the current grants must be used for investment in capital programmes (excluding the purchase of
passen-3 From 2002 to 2006 the criteria for the allocation of grants to counties were population (2001 census),
ger cars). The counties were bound to allocate a certain percentage of the current grants to their own municipalities and cities who were not direct beneficiaries of current grants from the central government budget. This percentage changed: in 2003 it was at least 30%, in 2005 at least 50%, and in 2005 at least 75%. Thus from 2005 the counties were left with a maximum of 25% of the current grants, which was strictly earmarked and had to be used for capital expenditures, the other minimum of 75% being allocated to the cit-ies and municipalitcit-ies in the area of the given county that were not direct beneficiarcit-ies of current grants from central government budget.
Direct current grants to municipalities and cities in the areas of special national concern
As well as current grants that the central government allocates to the counties (which it in turn reallocates to cities and municipalities), there are also the current grants that central government transfers directly to the cities and municipalities in the areas of spe-cial national concern. Thus in Table 8 we give the criteria for the allocation of these di-rect current grants.
Table 8 Criteria for the allocation of current grants from central government to the cities and municipalities in the areas of special national concern from 2002 to 2006
2002 2003 2004 2005 2006
Population size according to 2001 census + + + + +
Average revenue per capita of cities
and municipalities at national level + + + + +
Average revenue per capita of the group areas of special
national concern (individual cities and municipalities) + + + + +
Expenditure for capital programmes as proportion
of total expenditure + + + + +
Rationality of execution of functions of the system
(number of employees, expenditure per employee) + + + + +
Expenditure for functions of city (less than 30,000 pop.) + + + + +
Correction factor for gradual transition to new model
for calculation of current grants + + + – –
Balancing material expenditure
(population size and per capita expenditure) + + – –
Population size per square km at level of groups I and II
of areas of special national concern (group average) + +
Population size per square km of a given city
and municipality + +
The criteria for the allocation of current grants to local government units are unclear and are too frequently modified.4 From 2002 to 2006, current grants to cities and
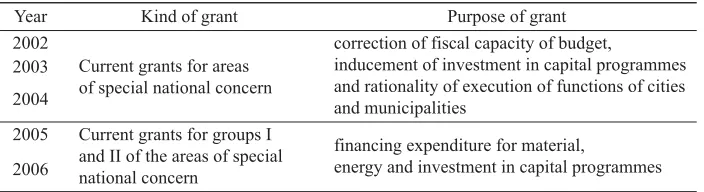
munici-palities were meant for the correction of fiscal capacities, for inducements to investments in capital programmes and rationality in the performance of functions. But from 2005 the statute said expressly that current grants to cities and municipalities were meant only for investment in capital programmes and for the financing of material expenditures for power. Table 9 gives the cities and municipalities that allocated given current grants. Table 9 Direct current grants to cities and municipalities in the areas of special
national concern
Year Kind of grant Purpose of grant 2002
Current grants for areas of special national concern
correction of fiscal capacity of budget,
inducement of investment in capital programmes and rationality of execution of functions of cities and municipalities
2003
2004
2005 Current grants for groups I and II of the areas of special national concern
financing expenditure for material,
energy and investment in capital programmes 2006
Note: Since 2004 current grants have been given in the amount that corresponds to the difference between the estimated personal income tax refund according to the annual tax return, which are taken over by the central budget on behalf of the local unit, and current grants calculated pursuant to criteria derived from the Execution of the Central Government Budget Law for the given year.
Source: Zakoni o izvršavanju državnog proračuna (2001-2006)
Between 2002 and 2005 these current grants were meant only for the counties, cities and municipalities in the areas of special national concern (180 units). From 2005 the third group of areas of special national concern (69 units) no longer had the right to current grants and the remaining beneficiaries were the local government units in the 1st and 2nd groups of
areas of special national concern (111 units).
From this analysis it is clear that the Government and the Finance Ministry did not perform a proper determination of the criteria for tax sharing and allocating current grants, because in the definition they relied on the categories of total revenue and expenditure per capita. Unfortunately, in the calculation and establishment of the criteria they did not use a
4 Since 2002 the criteria for the allocation of these current grants are population size (2001 census), average
single economic indicator of fiscal capacity, such as earned personal income and profit made at the level of the local units. Another problem is that economic criteria were not used in the establishment of which local unit should belong to a special financing system. In these conditions in 2004 introduced personal income tax refunds as an additional instrument of fiscal equalisation in the areas of special national concern and hill and mountain areas. Personal income tax refund as instrument of fiscal equalisation in the areas of special national concern and hill and mountain areas
An additional confusion in the definition of clear criteria for fiscal equalisation was introduced by the provisions of the Execution of the Central Government Budget Law (NN 31/04), in which current grants to the local units in the areas of special national con-cern and the hill and mountain areas were given in the amount of the difference of the es-timated personal income tax refund according to the annual return for the previous year (which was to be refunded by the given local unit in the areas of special national concern or hill and mountain areas) and amounts of current grant funds calculated pursuant to cri-teria from Execution of the Central Government Budget Law each year. This personal in-come tax refund is refunded to taxpayers in the areas of special national concern and hill and mountain areas, not by the local units, but by central government from its own budg-et, and by this amount of refund, the amount of the current grant to the local unit was re-duced. But not even then were the fiscal effects of the personal income tax refund in the areas of special national concern and hill and mountain areas known, nor data about its harmonisation with the current grant allocation mechanism.
4 Assessments of the effects of the fiscal equalisation model
The main argument of this paper is that the Government and the Finance Ministry do not manage, with the personal income tax sharing mechanism, the badly targeted current grants and with the personal income tax refunds in the areas of special national concern and hill and mountain areas, to palliate the horizontal fiscal inequalities of local govern-ment units. Hence on the basis of data from 2004 we shall determine whether in fact the Government and Finance Ministry through the allocation of personal income tax revenue, current grants and personal income tax refunds did help those local units with below-av-erage fiscal capacities (less than the 75% avbelow-av-erage gross per capita personal income) or whether they contributed to the exacerbation of fiscal inequalities.
4.1 Models of assessing horizontal fiscal inequalities
Fiscal capacity is measured as the ability of local units to raise revenue to cover their expenditures. Gross per capita personal income is often used as a reliable measure of fis-cal capacity.5 On the basis of per capita personal income of cities and municipalities via
four regression models we shall assess whether the government in its personal income tax sharing and its allocation of current grants respected the differences in fiscal capacities of the local units. Data about gross personal incomes were obtained from the Tax
tration, on the basis of a sample which covered 5% of the population (about 120,000 peo-ple) of cities and municipalities who made incomes that according to the provisions of the Personal Income Tax Law are subject to taxation.
Model I Gross personal income and totally collected personal income tax and surtax (per capita)
In the first simple regression model we endeavour to determine the distribution of the totally collected personal income tax (before tax sharing) and gross personal income of the cities and municipalities (per capita). In this model the annual gross personal incomes are an independent and the totally collected personal income tax and surtax per capita of the local units are the dependent variable.6 These relations are expressed in the first equation:
Ti = αi + βBDi + ui (1)
where
Ti – totally collected personal income tax and surtax (before tax sharing) per capita of the local unit n
BDi – gross personal income per capita of local unit n
i – local unit n.
If the gross personal income of a local unit is less than the average, we expect that in the area of this local unit (city or municipality) lower revenue from personal income tax will be collected. In this way we shall determine the correctness in the allocation of the burden of personal income tax before the tax sharing between the central government and the cities and municipalities.
Model II Gross personal income and revenues after sharing personal income tax and surtax (per capita)
In a second simple regression model we shall attempt to determine the relation be-tween local revenues from personal income tax sharing and gross personal income of the cities and municipalities (per capita). In this model the annual gross personal incomes are the independent and the personal income tax and surtax (after tax sharing) in the local units are the dependent variable7. These relations are expressed in the second equation:
TDi = αi + βBDi + ui (2)
where
TDi – revenue from shared personal income tax and surtax per capita of the local unit n
BDi – gross personal income per capita of the local unit n
i – local unit n.
6 It is hard analytically to separate income tax revenue from surtax revenue because there are no separate items
in the account plan of the budget and in the financial reports of the budget and of budget users.
7 The revenue from personal income tax and surtax (after sharing) includes the tax refund to cities and
If the gross per capita personal income of a local unit is less than the average, we would expect these cities and municipalities in the tax sharing to obtain more revenue from personal income tax (per capita). In this way we can determine whether the central government has through its personal income tax sharing made some progress in palliating fiscal inequality in gross per capita personal income of the local units or not.
Model III Gross personal income and current grants (per capita)
In the third simple regression model we try to establish whether the government has through the allocations of current grants made any considerable effect on the palliation of differences in the gross per capita personal incomes of the local government units or not. In this model the annual gross personal incomes are the independent and the current grants from the central government the dependent variable (per capita of the cities and municipalities). These relations are expressed in the third equation:
TRi = αi + βBDi + ui (3)
where
TRi – current per capita grants of local unit n BDi – gross per capita personal income of local unit n i – local unit n.
We would expect the local units with below-average gross personal incomes to ob-tain a greater amount of per capita current grant.
Model IV Gross personal income and revenues from shared personal income tax and surtax, current grants and personal income tax refunds (per capita)
In the fourth simple regression model we endeavour to determine the total fiscal ef-fect of personal income tax and surtax sharing, current grants and personal income tax refunds (in the areas of special national concern and hill and mountain areas) on the pal-liation of the differences in fiscal capacities (gross per capita personal income). For an evaluation of this effect, the following equation is employed:
PDTPi = αi + βBDi + ui (4)
where
PDTPi – revenue from shared personal income tax and surtax, current grants and personal income tax refund (in the areas of special national concern and hill and mountain areas) per capita of local unit n
BDi – gross per capita personal income of local unit n i – local unit n.
We are interested in whether the local units obtained the minimum amount of person-al income tax and current grants per capita (75% average) for the financing of the mini-mum expenditures in their areas or not.
4.2 Results of the estimates
Model I Gross personal income and totally collected personal income tax and surtax (per capita)
On the basis of the simple regression equation with gross personal incomes as the in-dependent and totally collected personal income tax (before tax sharing) as the depend-ent variable, we determined that there is a significant statistical relationship between these variables. The coefficient of determination shows that gross personal income (at 1% sig-nificance) explained 63% of the changes in the totally collected personal income tax and surtax in local units (Table 2 in the annex).
Graph 1 Gross personal income and totally collected personal income tax and surtax in 2004 (per capita in kuna)
6,000 5,000 4,000 3,000 2,000 1,000 0 -1,000
totally collected personal income tax and surfax
gross personal income
0 5,000 10,000 15,000 20,000 25,000 30,000 35,000 40,000
Source: authors calculation
The remaining 37% of the variations of the totally collected personal income tax and surtax should be ascribed to personal income tax allowances (reliefs and exemptions and so on). Although there are important differences in totally collected personal income tax per capita of cities and municipalities, we can say that before the tax sharing there is an equitable distribution of personal income tax burden in the local units (more tax is collect-ed in the area of local units with greater personal incomes).8 Possible greater differences
in gross personal incomes and taxes can be the result of exemptions and reliefs built into the personal income tax system.
Effects of personal income tax sharing. By a comparison of totally collected personal income tax and surtax in the area of the local units with the legally determined tax shar-ing, the weakness of the governmental measures in the use of personal income tax as an instrument for palliating regional inequalities come clearly into focus.
8 This is logical because of the progressiveness of personal income tax. The greater the incomes, the more tax
is paid.
Graph 2 Personal income tax and surtax sharing between central government and the cities and municipalities in 2004 (per capita in kuna)
3,500 3,000 2,500 2,000 1,500 1,000 500 0 -500
revenues after personal income tax and surtax sharing
-1,000 0 1,000 2,000 3,000 4,000 5,000 6,000 totally collected personal income tax and surtax
Source: authors calculation
The analysis showed that local units in the areas of special national concern and hill and mountain areas were on the line closest to the y axis. In the centre were local units on the islands that had made agreements with each other to finance capital projects. On the line closest to the x axis are the local units without any special position in the financ-ing system. This distribution of taxes shows that the government most of all helped the local units in the hill and mountain areas, the areas of special national concern and the islands with capital agreements, and least of all the local units that are not in any special financing system and yet have below-average per capita gross personal income. For ex-ample, three local units - the municipality of Marija Bistrica (not in a special regime), the city of Vis (island local unit with capital agreement) and the city of Hrvatska Kosta-jnica (in the areas of special national concern) totally collected per capita about 1,000 kuna from personal income tax and surtax. After personal income tax sharing, the mu-nicipality of Marija Bistrica (on the line closer to the x axis) received 300, the city of Vis (on the centre line) 600, and the city of Hrvatska Kostajnica (closer to the y axis) about 1,000 kuna per capita of personal income tax and surtax revenue.
In the sequel we shall look at the fiscal effects of the sharing of personal income tax on the fiscal capacities of the local government units (cities and municipalities).
Model II Gross personal income and revenue from sharing personal income tax and surtax (per capita)
Graph 3 Gross personal income and revenues after sharing personal income tax and surtax in 2004 (per capita in kuna)
6,000 5,000 4,000 3,000 2,000 1,000 0 -1,000
personal income tax and surtax (after sharing) 0 5000 10,000 15,000 20,000 25,000 30,000 35,000 40,000
gross personal income
y = 0.0478x - 163.09 R2 = 0.4484
Source: authors calculation
In the personal income tax sharing, central government did not pay sufficient atten-tion to the existing differences of gross personal incomes in the areas of the cities and municipalities. A large number of local units did not receive even 75% of the averagely shared revenue from personal income tax and surtax per capita. In Graph 3, because of the smaller positive angle of the regression line it seems that the dependence of budget-ary resources on per capita gross personal income is lower than before the personal in-come tax sharing. However, it can be seen that after the sharing of the personal inin-come tax and surtax revenues the cities and municipalities with greater fiscal capacity on aver-age still have more revenue than those with smaller fiscal capacities. This shows that the existing redistribution has on average been more useful to cities and municipalities with smaller fiscal capacities, but because of the poorly determined status in the system of fi-nancing, in some cases, even greater fiscal inequalities arise. For example, the municipal-ity of Sveta Nedelja (Zagreb County) and the cmunicipal-ity of Buzet (Istria County) have a similar per capital gross personal income, 26,500 kuna. The city of Buzet is in the hill and moun-tain areas, and the municipality of Sveta Nedelja is not in any special financing status. In Buzet, 3000 kuna and in Sveta Nedelja 2200 kuna per capita personal income tax and sur-tax were raised. After personal income sur-tax and sursur-tax sharing Buzet obtained 2,771 kuna (including the tax refund that is paid out by central government) and Sveta Nedelja only 742 kuna of personal income tax per capita (four times less).
Model III Gross personal income and current grants (per capita)
in-comes) smaller. Graph 4 shows the distribution of annual gross personal income and cur-rent grants per capita of the cities and municipalities in 2004.9
Graph 4 Gross personal income and current grants of the cities and municipalities in 2004 (per capita in kuna)
2,000 1,800 1,600 1,400 1,200 1,000 800 600 400 200 0
current grants
0 5,000 10,000 15,000 20,000 25,000 30,000 35,000 40,000 gross personal income
y = 0,0022x - 147.84 R2 = 0.0048
Source: authors calculation
There is no statistical relationship between these variables (gross personal income is not significant in explaining the variations of current grants) for current grants to local units are low and wrongly targeted. The Government and the Finance Ministry in the allocation of current grants did not take into account the existent differences in gross per capita personal income of the local unit. That there is no statistical relationship is shown by the low coeffi-cient of determination that with only 0.5% of variations in gross personal income explains the allocation of current grants (Table 4 in the Annex). As much as 99% of the variations in the allocation of current grants needs to be ascribed to factors that are not directly con-nected to gross personal income as the main economic indicator of the fiscal capacities of the local units. We conclude that the Government and the Finance Ministry have not paid sufficient attention to the differences in per capita gross personal income of the local units and that the current grants have been transferred according to dubious criteria.
In the sequel we shall explain the total effect of personal income tax and surtax shar-ing, and current grants to local units, on the palliation of differences in gross per capita personal incomes.
Model IV Gross personal income and revenues after sharing personal income tax and surtax and current grants (including personal income tax refunds)
We are interested in whether the local units obtained the minimum amount of current grants and revenues from personal income tax per capita (75% of the average) for enabling
9 Data sources concerning current grants are from the Finance Ministry concerning local budgets, at http://
the financing of the minimum expenditure. In the fourth model too there is a weak statis-tical relationship between gross personal incomes and revenues after sharing personal in-come tax and surtax and current grants in the local units (Table 4 in the Annex).
Graph 5 Gross personal income and revenues after sharing personal income tax and surtax and allocation of current grants in 2004 (per capita in kuna) 6,000
5,000 4,000 3,000 2,000 1,000 0 -1,000
personal income tax and surtax (after sharing)
and current grants
gross personal income
y = 0,0461x - 26,033 R2 = 0,3342
0 5000 10,000 15,000 20,000 25,000 30,000 35,000 40,000
Source: authors calculation
The allocated personal income tax, surtax and current grants did not depend on the gross personal incomes (fiscal capacities) of the local units. Gross personal incomes (with 1% significance) only 33% explain the variations in the amount of personal income tax after tax sharing and current grants (Table 5 in the Annex). In this case too the redistri-bution of personal income tax and the allocation of current grants has on average been more useful to local units with smaller gross personal incomes. However, there are exam-ples in which horizontal fiscal inequalities are increased. For example, the municipality of Biskupija (Šibensko-kninska County), in the 2nd group of the areas of special national
concern and the municipality of Davor (Brodsko-posavska County), which is not in any special financing regime, have about 10,600 kuna of gross per capita personal income. In Biskupija, 150 and in Davor 372 kuna of revenue from personal income tax per capita were collected. After personal income tax, surtax sharing and current grants (including the personal inocme tax refund for the areas of special national concern), Biskupija obtained about 1,600 kuna and Davor only 161 kuna of revenue per capita (ten times as less).
4.3 Why the Government and the Finance Ministry by the personal income tax sharing, current grants and personal income tax refunds do not palliate economic inequalities?
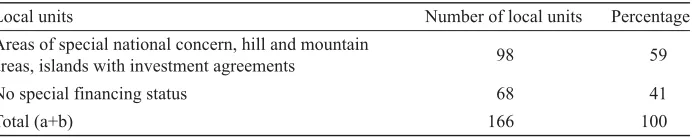
national concern. But local units with below-average fiscal capacities are not necessari-ly in the areas of special national concern, the hill and mountain areas or the islands with capital agreements. In 2004 275 local units are in the areas of special national concern, the hill and mountain areas or the islands with capital investment agreements. From all local units 166 of them have a gross per capital personal income lower than 75% of the nation-al average. However, not nation-all units in the specination-al financing systems have nation-also a below av-erage per capital gross personal income. For of the 274 local units that have a special fi-nancing status, only 98 of them have a fiscal capacity of less than 75% of the national av-erage, and as many as 175 have more than the 75% per capita national average.
Table 10 Local units with gross per capita personal income less than 75% of the national average in 2004
Local units Number of local units Percentage Areas of special national concern, hill and mountain
areas, islands with investment agreements 98 59 No special financing status 68 41
Total (a+b) 166 100
Source: calculations of the authors on the basis of Finance Ministry figures, 2007
Of the 166 local units with below-average gross per capita personal incomes (75% of the national average) almost 60% are in the areas of special national concern, hill and mountain areas or islands with capital agreements, and 40% of the local units are not in a special financing category.
Clearly there are dubious criteria for the allocation of current grants and taxes for fis-cal policy to lofis-cal units cannot be run by tax policies. Lofis-cal units in the areas of special national concern and hill and mountain areas and island local units with capital agree-ments are helped with tax policy measures not only because they have low fiscal capaci-ties but because of the social differences (the war-torn areas have a larger number of un-employed, smaller populations and so on). The primary objective of fiscal equalisation (current grant allocation and revenue/tax sharing) is to help local units to ensure the min-imum financial standard for public services. The social and other developmental prob-lems of the local units should be addressed by the Government with a proper system of specially targeted grants from the budget of central government.
consideration the real economic indicators as a foundation for the coordination of meas-ures of fiscal policy for the palliation of fiscal inequalities.
5 Conclusion
The Government and the Finance Ministry have not made any substantial impact on the palliation of fiscal inequalities with personal income tax sharing, allocation of current grants and refunds of personal income tax.
The reasons for this are the weak criteria that do not take into account economic ine-qualities, the wrongly targeted transfers (current grants from central budget), the dubious quality and consequences of the personal income tax sharing between central government and the local units, the poorly targeted personal income tax refunds, the absence of any calculation of fiscal capacities and fiscal needs and the way in which local units can be placed in the areas of special national concern and the hill and mountain areas.
The Government and the Finance Ministry should not frequently change the provi-sions of the tax sharing in the law before determining the financial consequences on the fiscal capacities of the local units. In particular they should simplify the personal income tax sharing and use just one or two simple divisions that would work for all areas. They should lay down the objectives to be achieved by the distribution of personal income tax sharing and current grants. If they want to help local units with below-average finan-cial capacities (to provide the minimum levels of public services), then it is necessary to change the manner in which personal income tax is shared and the criteria for the alloca-tion of current grants. The areas of special naalloca-tional concern, hill and mountain areas and island local units should be helped with direct, targeted grants from the central budget, and not with taxation policy measures. The Government and the Finance Ministry should stop using tax sharing and special tax incentives, for example, allowing larger personal allowances to taxpayers in the areas of special national concern or the hill and mountain areas) for palliating regional economic inequalities. For improvement of the mechanism of financial equalisation, the Government and the Finance Ministry should pay attention to the economic indicators and incorporate them into the current grant allocation criteria. In particular, they need to develop a good system of targeted current and capital grants (with or without the participation of the local units, project grants and so on), taking into account the economic capacities of the local units.
REFERENCES
Bajo, A. and Bronić, M., 2004. “Fiscal decentralization in Croatia: Problems of fiscal eqvalization”.Occasional Paper Series,No. 25. Zagreb: Institute of Public Finannce
Ministarstvo financija. Proračuni jedinica lokalne i regionalne (područne) samou-prave [online]. Zagreb: Ministarstvo financija. Available from: [http://www.mfin.hr/ str/55/].
Ministarstvo financija, 2001-2006. Godišnja izvješća Ministarstva financija. Za-greb: Ministarstvo financija.
Ministry of Finance, Tax Administration, 2006. Data on gross personal uncome of cities and municipalies. Zagreb: Ministry of Finance.
Ott, K., Bajo, A. and Pitarević, M., 2003. Fiskalna decentralizacija u Hrvatskoj. Zagreb: The Fiscal Decentralization Initiative for Central and Eastern Europe : Institut za javne financije.
Rosen, S. H., 1999. Javne financije. Zagreb: Institut za javne financije.
Uredbe o načinu izračuna iznosa pomoći izravnanja za decentralizirane funkcije jedi-nica lokalne i područne (regionalne) samouprave od 2002. do 2007. godine. Zagreb: Nar-odne novine.
Zakon o brdsko-planinskim područjima, NN 12/02, 32/02, 117/03, 42/05 i 90/05. Zagreb: Narodne novine.
Zakon o financiranju jedinica lokalne samouprave i uprave, NN 117/93, 69/97, 33/00, 73/00, 127/00, 59/01, 107/01, 117/01, 150/02, 147/03 i 132/06. Zagreb: Narodne novine.
Zakon o lokalnoj i područnoj (regionalnoj) samoupravi, NN 33/01, NN60/01 i 129/05. Zagreb: Narodne novine.
Zakon o otocima, NN 34/99, NN 32/02, i NN 33/06. Zagreb: Narodne novine.
Zakon o područjima posebne državne skrbi, NN 26/03, 42/05 i 90/05. Zagreb: Nar-odne novine.
Zakon o proračunu, NN 96/03. Zagreb: Narodne novine.
Zakon o vatrogastvu, NN 139/04. Zagreb: Narodne novine.
Annex
Table 1 Personal income tax sharing in 2007
Personal income
tax sharing County
Cities and municipalities
Fire services, decentralised functions*
Other decentralised
functions**
Equalisation fund***
Share for common financing of capital projects
the usual or
standard share 15.0 52.0 1.3 10.7 21.0 –
Zagreb – 67.0 1.3 10.7 21.0 –
areas of special national concern, hill and mountain areas
10.0 90.0 – – – –
islands – joint financing
of capital projects 15.0 52.0 1.3 10.7 – 21.0
* Only for cities and municipalities that have founded and fund the regular work of public fire services.
** Only for those cities and municipalities that have assumed the responsibilities for funding the
decen-tralised functions.
*** Transfers from central government to local units that cannot finance expenditure on decentralised
functions up to the minimum financial standard from the extra share in personal income tax revenue.
Table 2 Regression of T and BD (totally collected personal income tax and surtax as against gross personal income)
Source SS df MS Number of obs = 546 ______________________________________________ F (1, 544) = 927.60 Source 202714417 1 202714417 R-squared = 0.6303 Residual 118883202 544 218535 Adj R-squared = 0.6297 ______________________________________________
Total 321597619 545 590087
T Coef. Std. Err. t
BD 0.0947819 0.003112 30.46
Table 3 Regression of TD and BD (revenues after sharing income tax and surtax as against gross personal income)
Source SS df MS Number of obs = 546 ______________________________________________ F (1, 544) = 442,14 Source 51519138 1 51519138 R-squared = .,4484 Residual 63387954 544 116522 Adj R-squared = 0.4473 ______________________________________________
Total 114907092 545 210839
T Coef. Std. Err. t
BD 0.0477823 0.0022724 21.03
_cons -163.0569 39.40531 -4.14
Table 4 Regression of TR and BD (current grants as against gross personal income)
Source SS df MS Number of obs = 546 ______________________________________________ F (1, 544) = 2.61 Source 105235 1 105235 R-squared = 0.0048 Residual 21933755 544 40319 Adj R-squared = 0.0029 ______________________________________________
Total 220238990 545 40438
T Coef. Std. Err. t
BD 0.0021596 0.0013367 -1,62
_cons 147.831 23.1797 6.38
Table 5 Regression of PDTP and BD (revenues after sharing personal income tax and surtax, allocation of current grants and personal income tax refund
as against gross personal income)
Source SS df MS Number of obs = 541 ______________________________________________ F (1, 544) = 270.51 Source 47021928 1 47021928 R-squared = 0.3342 Residual 93693949 539 173829 Adj R-squared = 0.3329 ______________________________________________
Total 140715877 540 260585
T Coef. Std. Err. t
BD 0.0461406 0.0028054 16.45