http://www.sciencepublishinggroup.com/j/ajset doi: 10.11648/j.ajset.20170204.15
Behavior and Analysis of Reinforced Self-Compacted
Concrete Beam Column Connection Subjected to Fire
Fatma Eid
1, Khaled Heiza
1, Mahmoud Elmahroky
21
Civil Engineering Department, Menoufia University, Shiben Elkom, Egypt
2
Civil Engineering Department, Nile Higher Institute for Engineering and Technology, Elmansora, Egypt
Email address:
fatma_elzahraa2002@yahoo.com (F. Eid)
To cite this article:
Fatma Eid, Khaled Heiza, Mahmoud Elmahroky. Behavior and Analysis of Reinforced Self-Compacted Concrete Beam Column Connection Subjected to Fire. American Journal of Science, Engineering and Technology. Vol. 2, No. 4, 2017, pp. 132-140.
doi: 10.11648/j.ajset.20170204.15
Received: November 1, 2017; Accepted: November 20, 2017; Published: December 21, 2017
Abstract:
The present work is concerned with the experimental and analytical study of the behaviour of reinforced concrete beam-column connections exposed to fire under loading and to evaluate the reduction in concrete strength during fire. This research is divided into two parts, the first part is the experimental program, and the second is the theoretical analysis using finite element program (ANSYS). The experimental program include one-third scale specimens have been casted from self-compacted concrete. Three specimens were exposed to 600°C for one hour, other 3 specimens exposed to 600°C for two hours and the last 3 specimens as a control not exposed to fire. The effect of some parameters on the RC connection's behaviour like reinforcement ratio, amount of stirrups on RC connection and fire duration were studied. Experimental program extended also to study heat distribution inside RC beam – column connections by measuring temperature at points distributed at sections all over connection. Cracks propagation, strain, deflection, initial crack and failure loads were recorded, analysed and discussed.Keywords:
Self-Compacted Concrete, Reinforcement Ratio, Fire Duration, Cracks, Failure Mode, ANSYS1. Introduction
Reinforced concrete structure is the common structural system used in Egypt and nearly all over the world. Thus, the behaviour of reinforced concrete structures and its modes of failure have been extensively studied [2-4]. Particularly, degradation of concrete strength due to short-term exposure to elevated temperature (fire) has attracted attention in last decades [5]. The behaviour of concrete exposed to fire depends on its mix composition and is determined by complex interactions during heating process [6]. The modes of concrete failure under fire exposure varied according to the nature of the fire, the loading system, and the type of structure. Moreover, failure could happen due to different reasons such as reduction of bending or tensile strength, loss of shear or torsion strength, loss of compressive strength, and more. Building design manual and building codes require some provisions of structural fire-resistance to ensure building integrity for a certain period under fire conditions. Such provisions allow safely evacuation of occupants and access for fire fighters. However, the behaviour of the
building after fire and whether it is worthy to repair it or not, is another point of interest that needs more investigation. As beam-column connection is an important part on any reinforced concrete structures and Acquires big efforts in studying its behaviour [7-12] consequently, this research is aimed to investigate the effect of fire on the behaviour of reinforced beam- column connections casted from self-compacted concrete where this type of concrete has a great attention in many theses [13-15] and in construction fields. Self compacted concrete has many advantages like its improved quality and durability and also its higher strength [16]. A laboratory experiments in conjunction with theoretical analysis by using a finite element program have been performed to simulate the behaviour of beam-column connections exposed to fire. The results of these experimental and theoretical analysis were presented and discussed. The behaviour of reinforced concrete beam- column connections exposed to fire under loading was studied with using the following parameters:-
1- Fire duration (1and 2hours).
2. Experimental Work
The experimental program consists of (9) specimens grouped into three groups as following:-
1- Group (D): Includes (D1, D2 and D3) with longitudinal reinforcement of Ø16 bars (as shown in Figure (1)) to study the behaviour of connection exposed to 600°C for 1 and 2 hours.
2- Group (E): Includes (E1, E2 and E3) with longitudinal reinforcement of Ø12 bars (as shown in Figure (2)) to study the behaviour of connection exposed to 600°C for 1 and 2 hours.
3- Group (F): Includes (F1, F2 and F3) with longitudinal reinforcement of Ø12 bars + additional stirrups in connection (as shown in Figure (3)) to study the behaviour of connection exposed to 600°C for 1 and 2 hours.
For each group, the first specimen was taken as a control where it was examined without fire, the specimen geometry and load argument of RC beam-column connection shown in Figure (4), and Figure (5) shows the arrangement of sections for measuring temperature inside the RC specimen.
Figure 1. Concrete dimension and reinforcement details of group (D).
Figure 2. Concrete dimensione and reinforcement details of group (E).
Figure 3. Concrete dimensions and reinforcement details of group (F).
Figure 4. Specimen Geometry and Load Argument of RC Beam-Column Connection.
Concrete mix design
Table (1) gives the different mix proportions to produce one meter cube of self compacted concrete
(SCC) and the average compressive strength for each mix. The Second mix were chosen and the following ratios of materials were used to produce self compacted concrete:
-Cement content = 425 kg/m³
-Choose (dolomite: sand) ratio =1:1.22 -Water/ Cement (W/C) = 0.3
-Viscosity Agent (VEA) / Cement content = 4% - Fly Ash / Cement content = 20%
Table 1. The concrete mix proportions to produce (1m³) of self- compacted concrete.
Material (kg/ m³) First mix Second mix Third mix Fourth mix
Cement 400 425 400 400
Sand 1000 686 1000 715.5
Dolomite 1000 838 1000 874.5
Fly ash 40 85 40 40
Silica fume -- -- 40 40
VEA 10 17 10 10
Water 120 148.75 120 140
Average compressive strength (kg/cm²) 424 443 478 485
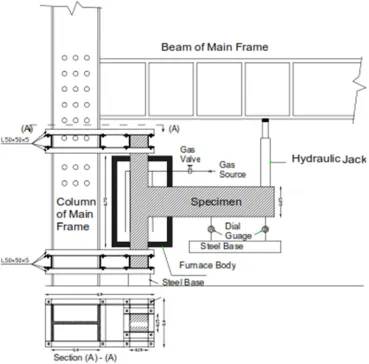
The furnace used in this work was designed to agree with the standard fire test curves of B. S 476 [17], ASTM-E119 [18], and AISO 834 [19]. It designed to contain only the beam-column connection where exposure to fire were done The furnace was made from steel sheets (2mm thickness) and consists of two parts which together form the complete furnace as shown in Figures (6 and 7). Furnace sides consists of two faces of steel sheet (2mm thickness) and a layer of glass wool (4cm thick.) as an insulation material have put
between them. Firing system inside furnace consists of (8) gas tubes distributed around the specimen to provide a uniform heating in all sides. Each gas tube has a row of holes in where fires come. All (8) gas tubes connected to two main tubes where there is a gas valve in each main tube after gas source to make a control on heat intensity inside furnace and so temperature degree. Furnace generated temperature was tested to determine how will it agree with the standard fire test curves of ASTM-E119, B. S 476 and AISO 834.
Figure 7. Typical and Actual Shape of RC Specimen during Testing.
Figure 8. Thermocouple temperature vs. voltage graph [20].
Temperature inside specimen at (65) points distributed on 5 sections were measured by using thermocouple of type (K) which can bear direct fire up to 900°C. One end of thermocouple was fixed inside specimen on defined node before casting and other end lies outside furnace during heating where this end will connect to Digital Multimeter to read temperature inside specimen. As a result of heating to specimens, electrical current was born in thermocouple which was measured in millivolts unit by the Multimeter. Conversion of measured electrical current to temperature degree were done by using curves shown in Figure (8) [20] The Specimens were painted by diluted white lime solution to facilitate the observation of crack propagation during the test whereas cracks propagation was marked at each load increment up to failure. At each load increment the deflection, crack width, and the longitudinal strains were recorded. Control specimens were firstly tested at room
temperature and both initial crack load and failure load were taken. For the specimens tested under fire, the furnace was set-up to contain only beam-column connection where connection exposed to temperature 600°C within 6 minutes from starting of fire. Specimens were fired under loading equal to initial crack load taken from control specimen. Exposure time was 1 or 2 hour as required. At the end of firing, the front part of furnace was taken aside and load increment was begun combined with recording of deflection and strain at each increment until reaching to failure load.
3. Analysis and Discussion of Test Results
exposed to 600°C for1hr and 2hr respectively, temperature at the canter of specimen D2 reached to 202°C after 1hr. of fire while it reached to 428°C at canter of specimen D3 after 2hr. of fire, also it became 268°C and 500°C at depth 2.5 cm from specimen's face of D2 and D3 respectively. These measured temperatures tell us that: temperature increases at Connection by Increasing firing time. Temperature reading at points (2, 3, and 4) at section 2 inside specimen D3 were 500, 467 and 428°C respectively and inside specimen E3 (Figure 9) were 489, 460 and 415°C respectively while inside specimen F3 (Figure 10), temperature reading at the same points were: 508, 469 and 439. By comparing temperature for the specimen D, E and F it can said that, temperature increases inside specimen D3 which has more reinforcement ratio than specimen E2 also specimen F3 with additional stirrups at connection zone has the highest temperature reading in all specimens.
Figure 9. Temperature distribution contours at section (2) inside the specimens (E3).
Figure 10. Temperature distribution contours at section (2) inside the specimens (F3).
The relationship between the applied load and corresponding deflection at different loading points were taken for all specimens. Figure (11) and Figure (12) for group (D) which casted from self-compacted concrete and at load 2.2 ton, measured deflection was 7.55, 10.15 and 15.55 mm for specimen D1, D2 and D3 respectively where: D1 (control) and D2 and D3 were fired at 600°C for 1 and 2hour respectively. It is noticed that, deflection increases with increasing fire time. For group (E) At load 1.4 ton, measured deflection was 8.75, 11.10 and 15.68 mm for specimen E1, E2 and E3 respectively where: E1 (control), E2 and E3 were fired at 600°C for 1 and 2 hour respectively. It is clear that, deflection increases with increasing firing time. By making a comparison between deflection for specimens of different reinforcement it is
clear that: deflection decreases with increasing
reinforcement ratio for example at load 1.8 ton, deflection for specimen D2 was 7.46 mm while it was 17.58 mm for specimen E2 which has less reinforcement ratio and both specimen were fired for 1 hr at 600°C
Figure 11. Relationship between the Load and Deflection for specimen D2 at 600°C for 1 hour.
Figure 12. Relationship between the Load and Deflection for specimen D3 at 600°C for 2 hour.
D1, D2 and D3 respectively at moment 1.17 m. t. By making comparison for applied moment versus the rotation of specimen D2, E2 and F2 which have same exposure time to fire, it was found that: rotation was 7.64x10⁻³, 18.03 x10
-3
and 13.60x10⁻³ for specimen D2, E2 and F2 respectively As known that specimen D2 has more reinforcement ratio than specimen E2 which means that: rotation decreases with increasing reinforcement ratio. Also specimen F2 with additional stirrups in connection zone has less rotation than specimen E2 which has less number of stirrups in connection zone.
Figure 13. Relationship between the Load and Strain for Specimen D2 at 600°C for 1 hour.
Figure 14. Relationship between the load and strain for specimen E3 at 600°C for 2 hour.
Figures (13) and (14) show strain distribution across beam section at the column face for some specimen. The positive values takes place at the upper end of connection where negative values at lower end. From these curves it can be seen that: the strain increases with increasing temperature. For example at load 1.5 ton strain reaches 3.77x10⁻³ mm, 5.74x10⁻³ mm and7.61x10-3 mm at positive sides and reaches 0.97x10⁻³ mm, 1.03x10⁻³ mm and 1.25x10⁻³ at negative sides for specimen D1, D2 and D3 respectively. Also it can be conducted that: specimens with more reinforcement ratio has less strain for example positive strain for specimen D1, D2 and D3 equal 3.95x10⁻³ mm, 5.75x10⁻³ mm and 9.05x10⁻³
mm respectively at load 1.2 ton while for specimen E1, E2 and E3 equal 5.93x10⁻³ mm, 7.05x10⁻³ mm and 9.25x10⁻³ respectively at same load and the same exposure time.
Cracks for different specimens were recorded as shown in Figures. (15, and 16), by studying the shape of crack propagation we get the results: cracks number increases by increasing exposure time to fire and also specimen which have additional stirrups in connection zone have more number of cracks than those of less number of stirrups.
Figure 15. Crack Pattern, crack distribution and mode of failure of specimen E3 at 600°C for 2hr.
Figure 16. Crack Pattern, crack distribution and mode of failure of specimen F3 at 600°C for 2hr.
4. Finite Element Analysis
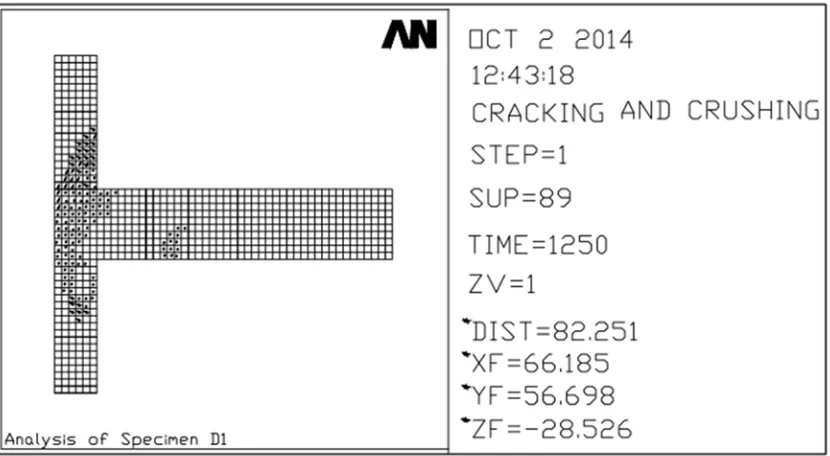
Figure 17. Cracking pattern of Specimen (D1) at Ultimate Load using ANSYS.
Figure 18. Cracking pattern of Specimen (D3) at Ultimate Load using ANSYS.
5. Comparison Between Experimental
and Analytical Results
Figures (19 and 20) show a comparison between the displacement obtained from experimental work and finite element analysis for group (D) in which it can be concluded that:-
1- For specimen D1 at room temperature: the displacement obtained from experimental results is the same that obtained of analytical analysis at load 3500kg where: ultimate load of analytical analysis less than that of experimental work by 1%.
2- For specimen D2 (at 600C° for 1 hr): the displacement obtained from experimental results is greater than that obtained from analytical analysis by 5% at load 2900kg where: ultimate load of analytical analysis greater than that of experimental work by 9.5%.
3- The analytical result of the displacement for specimen D3 at 600°C for 2hr is less than the experimental result by 11%. The experimental result shows decrease in ultimate load by 4% compared with theoretical result.
A comparison between the displacement obtained from experimental work and finite element analysis for group (F) in which it can be concluded that:-
obtained from experimental results is greater than that obtained of analytical analysis at load 3000kg by 8.5% where: ultimate load of analytical analysis greater than that of experimental work by 6%.
2- For specimen F2 (at 600C° for 1 hr): the displacement obtained from experimental results is greater than that obtained from analytical analysis by 10% at load 2500kg where: ultimate load of analytical analysis greater than that of experimental work by 6.5%.
3- For specimen F3 (at 600C° for 2 hr): the displacement obtained from experimental results is greater than that obtained from analytical analysis by 4% at load 1800kg where: ultimate load of analytical analysis greater than that of experimental work by 10%.
Figure 19. Load-Deflection Curve for RC Specimen D1 at 600°C for 1 hour.
Figure 20. Load-Deflection Curve for RC Specimen D2 at 600°C for 1 hour.
Figure (21) shows a comparative study for initial crack for specimen of group (D) between the finite element analysis and experimental results. We can concluded that, the initial crack load for specimen D1 (control) increases for experimental results compared with analytical analysis by 7%, and the same for specimens D2 (exposed to 600°C for 1hr) but decreases for Specimen D3 (exposed to 600°C for 2hr) by 10%. Figure (22) shows a comparative study for initial crack for specimen of group (F) between the finite element analysis and experimental results. We can concluded that, the initial crack load for specimen F1 (control) increases for experimental results compared with analytical analysis by 3%, but decreases for specimens F2 (exposed to 600°C for
1hr) and F3 (exposed to 600°C for 2hr) by 5% and 10% respectively.
(D1, D2 and D3 fired for 0, 1 and 2hr respectively).
Figure 21. Initial Cracking Load for RC Specimens of Group D.
(F1, F2 and F3 fired for 0, 1 and 2hr respectively).
Figure 22. Initial Cracking Load for RC Specimens of Group F.
6. Conclusions
1. Self- compacted concrete showed higher fire resistance compared with ordinary concrete.
2. Cracking and spilling occurred in both self-compacted concrete and ordinary concrete were increased with increasing exposure time to fire.
3. The rate of heat propagation inside self-compacted concrete is less than that of ordinary concrete because self-compacted concrete is denser and contain less bores.
4. Resistance of reinforced concrete beam column
connections subjected to fire increased by increasing reinforcement from Ø12 mm to Ø16 mm longitudinal bars.
5. Increasing number of stirrups in the RC connection zone, relatively increases specimen fire resistance but number of cracks increases..
6. Increasing number of stirrups in the RC connection zone gave obvious prediction for the distribution of temperature for both horizontal and vertical directions inside RC connection.
7. Using finite element analysis program (ANSYS) gives
experimental results.
8. Exposure of RC beam column connection to direct fire
for 2 hour under static loading is one of the important fulfilments of Egyptian fire code.
9. Increasing exposure time to fire, decreases initial crack load, ultimate load, decreases the stress and increases the strain.
10.Good agreement was observed between the theoretical
and experimental results.
References
[1] Oreste S. Bursi, Fabio Ferrario, and Riccardo Zandonini " Analysis of Steel-Concrete Composite Beam-To-Column Joints" PhD thesis, Department of Mechanical and Structural Engineering, University of Trento, Italy, 2008.
[2] Taha M. Sc. "Behaviour an Analysis of RC Beam Column Connections Subjected To Fire Under Cyclic Loads". PhD. Thesis, Menoufia University, 2015.
[3] Jonaitset, B. and Papinigis V., "Effect OF Long-Term Loading and Fire Temperatures on Mechanical Properties of Concrete" Journal of Civil Engineering and Management,(2005), Vol. XI, No 4, 283–288.
[4] Varma, A. H. and Hong, S. " Experimental Investigations of Fire-Structure Interaction: Advantages and Limitations" Purdue University NSF-NIST Fire Research Workshop, June 11, 2007.
[5] Aggour, M. S., " Effect of Fire on Structural Elements" Academy of Scientific Research and Technology Report. (January, 2000).
[6] Kamal, M. M., Heiza, Kh. M. and Etman, Z. A., "Mechanical Properties of Self-Compacted Concrete Including Different Mineral Admixtures" 4th ERD5 Conference, Faculty of engineering, Shebin El-Kom, Center of Rural Development, 27-29 September 2005.
[7] KVIST, J. "FE-Analysis of a Beam-Column Connection in Composite Structures Exposed to Fire" Master of Science Thesis, Department of Civil and Environmental Engineering. Chalmers University of Technology, Göteborg, Sweden, 2011.
[8] Vidjeapriya R, Vasanthalakshmi V andJaya K P, "PERFORMANCE OF EXTERIOR PRECAST CONCRETE
BEAM-COLUMN" International Journal of Civil Engineering (IJCE) Volume 12, Number 1, pp. 82-95, March 2014.
[9] Vidjeapriya, R. and Jaya, K. “Experimental Study on Two Simple Mechanical Precast Beam-Column Connections under Reverse Cyclic Loading" Journal of Performance of Constructed Facilities, Volume 27, Issue 4 (August 2013).
[10] Thomas, K., Woosuk, K., and Myoungsu, S." Cyclic Testing for Seismic Design Guide of Beam-Column Joints with Closely Spaced Headed Bars" Journal of Earthquake Engineering, volume16, Issue2, PP211-230, 2012.
[11] Kim, S., Moon, J. and Lee, L. " Interior beam-column joints with wire strands subjected to reverse cyclic loads" US National and Canadian Conference on Earthquake Engineering, 2010.
[12] Yang, B. and Tan, K. “Behavior of Composite Beam-Column Joints in a Middle-Column-Removal Scenario: Experimental Tests” Engineering Structures journal, 57, 153-168. Online publication date: 1-Dec-2013.
[13] M. A. Helal and Kh. M. Heiza " Effect of Fire and High Temperature on the Properties of Self Compacted Concrete" CICE 2010- The 5th International Conference on FRP Composites in Civil Engineering, September 27-29, 2010, Beijing, China.
[14] Kh. M. Heiza " Performance of Self-Compacted Concrete Exposed to Fire or Aggressive Media" CONCRETE RESEARCH LETTERS, Vol. 3 (2)- June 2012.
[15] Mabău, M,."Effect Of Confinement On Bond Strength Between Self-Compacting Concrete And Reinforcement" Buletinul Institutului Politehnic Din Iaşi, Technical University Of Cluj-Napoca, Faculty Of Civil Engineering, March 1, 2012.
[16] Ameen, Z. A.," Effect of High Temperature and Fire on The Behavior and Strength of Reinforced Concrete Members cast with Self- Compacting Concrete" Ph. D. thesis, Menofia University, faculty of Engineering, Shebin EL-kom, 2008.
[17] British Standard Institution, BS 476-10: 2009" Fire tests on building materials and structures. Guide to the principles, selection, role and application of fire testing and their outputs " London, England.