ISSN 0975-928X
Research Note
Genetic variability and factor analysis in common bean (
Phaseolus vulgaris
L.) germplasm collection for yield related traits
P. A. Sofi 1, M. Y. Zargar 1, S. M. Razvi 2, F. A. Sheikh 1, Iram Saba 1 and T. Shafi 1
1 Regional Research Station (SKUAST-K), Wadura, Sopore, J&K, India 2
Central Institute of Temperate Horticulture (ICAR), Srinagar, J&K, India Email: parvazesofi@gmail.com
(Received: 04 Apr 2014; Accepted: 23 Apr 2014)
Abstract
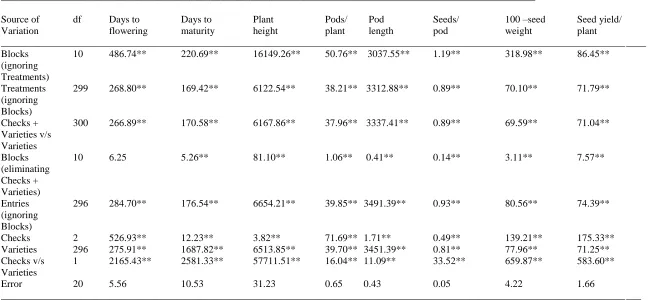
The present study was undertaken in Kharif 2011 and 2012 at Research Farm of Regional Research station of SKUAST-K at Wadura. The divergence of beans collection comprising 300 genotypes including 297 test germplasm accessions and three checks namely Shalimar Rajmash-1, Contender and Selection-3 was studied using factor analysis. We considered eight quantitative traits related to seed yield namely days to flowering, days to maturity, plant height, number of pods/plant, pod length, seeds/pod, 100-seed weight and seed yield/plant. Analysis of variance revealed that there were significant differences between checks and accessions, between accessions and between checks for all the traits. It indicated presence of substantial amount of variation among the test entries. The factor analysis was based on Pearson correlation matrix and Euclidean distances. Total variance explained with the four PC's was more than 70%. Latent roots (Eigen values) are between 2.318 for the first and 0.112 for the eight. The first component explained 28.976 % of total variation, the second component explained 16.989 %, while as the third and fourth component explained 14.751 and 12.972 % respectively. Days to flowering and days to maturity were the important traits in the first two principal components. 100-seed weight was the important trait in third principal component while the pod length and seeds per pod were important traits in fourth principal component. Combined use of the three seven PC (principal components) could yield a successful selection of genotypes suitable for donors of one or more important traits in breeding.
Key words:Phaseolus vulgaris, divergence, quantitative traits, PCA
Common bean is one of the most important summer season pulse crop in India. It is regarded as ―Grain of hope” as it is an important component of subsistence agriculture and feeds about 300 million people in tropics and 100 million people in Africa alone. Besides it is emerging as an important income generation especially in Central America. Globally, with 21 million tonnes produced from about 26 million hectares, it accounts for about half of the total pulse production. In India common bean is grown over an area of about 6 million hectares with a production of about 2.5 million tones (FOA, 2010). In the state of Jammu and Kashmir, it is a niche crop valued for its taste and nutritional qualities as a cheap source of protein. The major farming systems having common bean as a component crop are characterized by growing of local landraces that are invariably low yielding, more often disappointingly low, but possess specific adaptation traits that confer niche value. Plant
ISSN 0975-928X
description of correlations among variables. Factor analysis has the potential of enhancing our knowledge of causal relationship of variables and can help to know the nature and sequences of traits to be selected for breeding program (Khameneh et al., 2012). The method has been used by many workers in elucidating genotypic differentiations in gene bank collections (Antunes et al., 1981; Acquaah et al., 1992; Brithers and Kelly, 1993 and Vasic et al., 2008). With this background the present investigation was carried out.
The present study was undertaken in Kharif 2011 and 2012 at Research Farm of Regional Research station of SKUAST-K at Wadura (34o 17’ North and 74o 33 E at altitude of 1594 m amsl). The divergence of beans collection comprising 300 genotypes including 297 test germplasm accessions and three checks namely Shalimar Rajmash-1, Contender and Selection-3. The material is a part of the common bean collection maintained in Phaseolus GeneBank at Regional Research Station of SKUAST-K. The design consisted of 11 blocks containing 30 genotypes in each with 27 new entries and three check entries. Augmented design was followed with three checks. Each genotype was represented by a plot size of 2 x 2 meter dimensions with 5 lines. The plants were space planted for optimal expression of traits and lack of prior knowledge about growth habit of the genotypes. Data was collected from five randomly selected competitive plants on various morphological, maturity, yield and yield contributing traits as per the descriptors developed by CIAT, Colombia, USDA-ARS and other organizations. The analysis of variance was done using WINDOSTAT advanced biometrics software. We considered eight quantitative traits related to seed yield namely days to flowering, days to maturity, plant height, number of pods/plant, pod length, seeds/pod, 100-seed weight and seed yield/plant. The factor analysis was based on Pearson correlation matrix and Euclidean distances. Latent roots or Eigen values for all principal components were shown. The variability of the collection in was interpreted based on the seven principal components. Non-rotated and rotated values of Latent vectors (Component weights, Factor loadings) were shown. The Varimax method (Kaiser and Wilkins, 1990) was used for the rotation of principal components. Both the unrotated and the varimex rotated PCA values were calculated by the statistical package statistiXL.
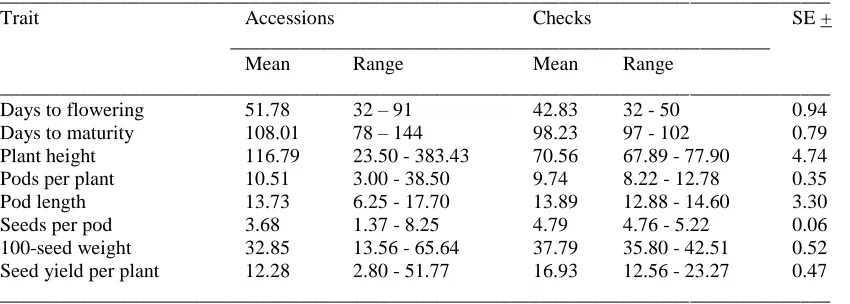
The substantial variation observed in the present study could be a result of genetic factors as well as the eco-geographic adaptation or both. However, the stability of performance needs to be studied across locations as well as years. Mean performances of the accessions and checks
was much wider in case of accessions than checks. In fact, the highest performances for individual traits were recorded in case of the accessions. Shahin et al (2007) and Sofi et al (2011) also reported broad variation pattern in the tested genotypes for morphological, maturity and yield traits. Razvi et al. (2012) evaluated some local landraces using morphological parameters and RAPD markers and found significant variation among different ecotypes. Analysis of variance for augmented design (Table 2) revealed that there were significant differences between checks and accessions, between accessions and between checks for all the 24 morphological and eight quantitative characters for which the material was evaluated. It indicated presence of substantial amount of variation among the test entries. The variation can be a result of genetic factors as well as the eco-geographic adaptation or both.
A comprehensive understanding of grain yield components and their effect on the yield is usually obtained using correlation and path analysis. Path analysis shows any yield component compensations when two or more variables either positively increase the yield and/or negatively decrease the yield. In case of studies where a large number of traits are considered simultaneously assuming to have significant effects on yield or other economic traits through direct and indirect effects, it creates a peculiar situation by coming up with a selection index comprising large number of traits. The factor analysis is a method of reducing the large number of correlated traits that define the yield into a small number of uncorrelated factors. The factor analysis divided all the studied variables into main factors.
ISSN 0975-928X
component explained 14.751 and 12.972 % respectively.
Days to flowering and days to maturity were the important traits in the first two principal components. The Trait 100-seed weight was the important trait in third principal component while the pod length and seeds per pod were important traits in fourth principal component. The first four principal components were expressed on the basis of non-rotated values. Certain traits have a high coefficient of correlation with only one Principal Component while as some has lower correlation level with more PC. This is usually overcome by rotation of all the components to have a more clear distribution of particular traits in them, and traits were more closely tied to particular Principal Components (Table 4 and 5).
It is obvious that the variables effective in the first factor had a high level of loading coefficients and contribute much more on the response structure. All of these variables showed significant and positive correlations with grain yield. The first, third and fourth PC could be designated as components of productivity as they determine the limits of yield by virtue of containing yield component traits with pronounced loadings before and after rotation. The important traits in these components were number of pods per plant, pod length, seeds per pod and 100-seed weight. Similar results have been reported by Salehi et al., (2008), Vasic et al., (2001) and Vasic et al., (2008) in common bean using multivariate analysis. These traits with the exception of pod length also share positive correlation with seed yield. The second principal component can be designated as the component of maturity since it contains pronounced traits which determine the maturity level. In the highest correlation with this PC are days to flowering and days to maturity. Combined use of the three principal components could yield a successful selection of genotypes suitable for donors of one or more important traits in breeding.
Acknowledgement
The first author acknowledges the financial support provided by J&K State Council for Science & Technology (Grant # 25-ST/2010)
References
Acquaah, G., Adams, M.W. and Kelly, J.D. 1992., A factor analysis of plant variables associated with architecture and seed size in dry bean,
Euphytica, 60, 171-177.
Antunes, I., Teixeira, M., Zimmermann, M.J.O. and Costa, J.G.C. 1981., Exploration of regional populations in common beans - concepts and procedures adopted at the national research centre for rice and beans- cnpaf/Brazil. Annual Report BIC, 24-27.
Brithers, M.E. and Kelly, J.D. 1993., Interrelationship of plant architecture and yield components in the pinto bean ideotype, Crop Sci., 33, 1234 - 1238.
FAO 2010., FAOSTAT. www.fao.org
Guertin, W.H. and Bailey J.P. 1982., Introduction to modern factor analysis. Edwards Brothers (ed) Inc Michigan USA.
Johnson, R.A. and Wichern, D.W. 1996., Applied multivariate statistical analysis. Sterling Book House New Delhi.
Kaiser, H. F. and Wilkins, R. 1990., The varimax criterion for analytic rotation in factor analysis. Pschycometrica,23, 187-200
Kovacic, Z. 1994 Multivarijaciona analiza. Univerzitet u Beogradu, Ekonomski fakultet, 282str Khameneh, M.M., Bahraminejad, S., Sadeghi, F.,
Honarmand, J. and Maniee, M .2012., Path analysis and multivariate factorial analyses for determining interrelationships between grain yield and related characters in maize hybrids.
African J. Agril. Res., 7, 6437-6446
Mohammadi, S.A. and Prasanna, B.M. 2003., Analysis of Genetic Diversity in Crop Plants—Salient Statistical Tools and Considerations. Crop Sci.,43, 1235-1248
Razvi, S.M.. Sofi, P.A., Khan, M.N., Sofi, N.R., and Dar, Z.A.. 2012., Genetic diversity, variability and character association in local common bean (Phaseolus vulgaris l.) germplasm of Kashmir. Electron. J. Plant Breed., 3, 883-891
Salehi, M, Tajik, M., and Ebadi, A. 2008., The relationship between different traits I common bean using multivariate statistical methods.
American Eurasian J. Agric. & Environ., 3, 806-809
Shahin, V., Hamid, D.L., Reza, M., Hazrat Qoli, S. and Esma`il, B. 2007., Study of agromorphological diversity among multicolor common bean collection of National Plant Gene Bank of Iran. Report of Plant genetics and genetic resources department; Khomein bean research station. .64pp.
Sofi, P.A., Zargar, M.Y., Debouck, D., and Graner, A. 2011., Evaluation of common bean genotypes under temperate conditions of Kashmir valley.
J. Phytol.,3, 47-52
Vasic M., Gvozdanovic-Varga, J., and Takac, A. 2001., Selekcija pasulja (Dry bean breeading). Savremena poljoprivreda- Contemporary Agric., Novi Sad, 1-2, 237-245.
ISSN 0975-928X
Table 1. Descriptive statistics of accessions and checks
___________________________________________________________________________________
Trait Accessions Checks SE +
______________________________________________________
Mean Range Mean Range
___________________________________________________________________________________
Days to flowering 51.78 32 – 91 42.83 32 - 50 0.94
Days to maturity 108.01 78 – 144 98.23 97 - 102 0.79
Plant height 116.79 23.50 - 383.43 70.56 67.89 - 77.90 4.74 Pods per plant 10.51 3.00 - 38.50 9.74 8.22 - 12.78 0.35 Pod length 13.73 6.25 - 17.70 13.89 12.88 - 14.60 3.30
Seeds per pod 3.68 1.37 - 8.25 4.79 4.76 - 5.22 0.06
ISSN 0975-928X
Table 2 . Analysis of variance for eight quantitative traits
___________________________________________________________________________________________________________
Source of df Days to Days to Plant Pods/ Pod Seeds/ 100 –seed Seed yield/
Variation flowering maturity height plant length pod weight plant
_____________________________________________________________________________________________________________________________ ____ Blocks 10 486.74** 220.69** 16149.26** 50.76** 3037.55** 1.19** 318.98** 86.45**
(ignoring Treatments)
Treatments 299 268.80** 169.42** 6122.54** 38.21** 3312.88** 0.89** 70.10** 71.79** (ignoring
Blocks)
Checks + 300 266.89** 170.58** 6167.86** 37.96** 3337.41** 0.89** 69.59** 71.04** Varieties v/s
Varieties
Blocks 10 6.25 5.26** 81.10** 1.06** 0.41** 0.14** 3.11** 7.57** (eliminating
Checks + Varieties)
Entries 296 284.70** 176.54** 6654.21** 39.85** 3491.39** 0.93** 80.56** 74.39** (ignoring
Blocks)
Checks 2 526.93** 12.23** 3.82** 71.69** 1.71** 0.49** 139.21** 175.33** Varieties 296 275.91** 1687.82** 6513.85** 39.70** 3451.39** 0.81** 77.96** 71.25** Checks v/s 1 2165.43** 2581.33** 57711.51** 16.04** 11.09** 33.52** 659.87** 583.60** Varieties
Error 20 5.56 10.53 31.23 0.65 0.43 0.05 4.22 1.66
ISSN 0975-928X
Table 3. Eigen values (Latent roots) and variability of non-rotated values of Principal Components _______________________________________________________________________
Principal Latent roots Percent variation Cumulative
Component (Eigen values) explained Percentage
________________________________________________________________________
PC1 2.318 28.976 28.976
PC2 1.359 16.989 45.965
PC3 1.180 14.751 60.711
PC4 1.038 12.972 73.688
PC5 0.910 11.378 85.066
PC6 0.717 8.910 94.027
PC7 0.366 4.574 98.601
PC8 0.112 1.399 100
________________________________________________________________________
Table 4 Non-rotated component loadings (values of principal component traits of common bean) _____________________________________________________________________________________
Variable PC 1 PC 2 PC 3 PC 4
_____________________________________________________________________________________
Days to Flowering 0.614 0.573 -0.080 0.060
Days to maturity 0.563 0.647 0.240 -0.034
Plant height -0.337 0.245 -0.702 0.060
Number of pods/ plant -0.717 0.499 0.041 -0.355
Pod length 0.119 0.313 0.116 0.652
Seeds/ pod -0.442 -0.025 -0.207 0.664
100-seed weight -0.309 -0.126 0.722 0.190
Seed yield per plant -0.832 0.435 0.210 -0.028
Latent roots 2.318 1.359 1.180 1.038
Percent of variation explained 28.976 16.989 14.751 12.972
Cumulative percentage 28.976 45.965 60.711 73.688
Varimex rotated component loadings
Days to Flowering 0.169 0.807 -0.182 0.041
Days to maturity 0.013 0.883 0.104 -0.045
Plant height -0.272 -0.127 -0.732 0.207
Number of pods/ plant -0.929 -0.046 -0.108 -0.116
Pod length 0.057 0.330 0.114 0.652
Seeds/ pod -0.124 -0.326 -0.137 0.735
100-seed weight -0.230 -0.175 0.743 0.181
Seed yield per plant -0.926 -0.141 0.100 0.201
Latent roots 2.318 1.359 1.180 1.038
Percent of variation explained 28.976 16.989 14.751 12.972
Cumulative percentage 28.976 45.965 60.711 73.688