221
Agriculture and Biosciences
www.ijagbio.com P-ISSN: 2305-6622 E-ISSN: 2306-3599 editor@ijagbio.com RESEARCH ARTICLEInterrelationships between Measures of Cow and Herd Performance and Farm Profitability
on Malaysian Dairy Farms
Moran JB1 and JW Brouwer2 1
Profitable Dairy Systems, 24 Wilson St. Kyabram, Victoria 3620 Australia; 2Skyglow Enterprises, Lot 825B, Jl Subang 6, 47510 Subang Jaya, Selangor, Malaysia
A R T I C L E I N F O A B S T R A C T
Received: Revised: Accepted:
September 01, 2013 September 12, 2013 September 18, 2013
Farm production and business performance data were collected from 30 dairy farms in Peninsula Malaysia. Observations of the stock, cow shed, farm facilities and forage production area were made to assess current farm practices and the general state of the stock and the supporting dairy infrastructure. Farmers were interviewed about key aspects of their farm management, the costs of farm inputs and their herd performance to develop a series of Key Performance Indicators. The business focus covered specific aspects of milk returns and feeding management to calculate total feed costs, feed efficiencies and feeding profits. Gross farm profits were calculated, including and excluding imputed labour costs. The farms were split into three groups to assess the impacts of farm management on cow milk yields and total costs of milk production. The survey provided many valuable insights into why some farms are productive and profitable and why others are not. In essence, higher per cow milk yields and farm profit abilities were recorded on farms that were better equipped and better managed. The more productive and profitable farmers had more reliable electricity and water supplies, provided specific calving down areas, did not graze their milking cows and did not suckle their calves on milkers. In addition, they used artificial insemination rather than natural mating, used calf milk replacer as part of their milk rearing program, routinely used dry cow therapy as part of the mastitis control program, kept farm records and had less problems with mastitis, lameness and young stock rearing. The cows on the most profitable farms generally had high peak milk yields and fewer had short lactations. Although they invested more in feeding for their milking cows, the resultant greater feed conversion efficiencies on these farms yielded higher feeding profits and higher returns on total farm assets and equities.
Cow sheds designs were generally poor in that roofs were low, shed hygiene had much that could be improved and fans and cooling sprinkler systems were virtually non-existent in any of the 30 farms surveyed. In addition, many of the farms suffered from a lack of productive cows in their herds. Future herd management must concentrate on improving reproductive performance and in some instances, reducing young stock mortality as well as improving the nutritional status hence performance of the milking herd. Of the 30 farms surveyed, only 8 had positive gross farm profits, although this increased to 18 farms if farmers excluded their family labour from the costs of milk production.
Key words:
Farm profitability Herd performance Tropical dairy systems Unit cost of milk production
*Corresponding Address:
Moran JB
jbm95@hotmail.com
Cite This Article as: Moran JBand JW Brouwer, 2013. Interrelationships between measures of cow and herd performance and farm profitability on Malaysian dairy farms. Inter J Agri Biosci, 2(5): 221-233. www.ijagbio.com
INTRODUCTION
Throughout the tropics, smallholder dairy farming was established as part of social welfare and rural development schemes and to provide a regular cash flow
security to counteract the vagrancies of the current global financial and politically unstable world in which we live (APHCA, 2007). Dairy consumption in Asia has more than doubled over the last 25 years, and this has led to more than 50% of the world’s total dairy imports now entering Asian markets (FAOSTAT, 2013). Consequently, dairy development programs attain high priority in most Asian countries (Dudgill and Morgan, 2008).
In South East Asia, smallholder dairying has become a good income earning occupation for crop/livestock farmers in mixed farming systems. This is evident in Thailand, Malaysia and Indonesia where such farmers turned to full time small scale dairying and are able to generate enough income and savings to support their children to receive college education. With further improvement in productivity and reduction in production costs, Chantalakhana and Skunmun (2002) concluded that small holder dairying in these countries can become very sound and sustainable enterprises.
Although many Asian dairy farmers intuitively think about farm costs and returns, greater use could be made of formats allowing them to be more aware of the relative importance of all their financial inputs in terms of cost of production (COP) per kg of milk produced on the farm (Moran, 2009a). Knowing their COP allows such farmers to determine their profit margins and this is critical to operating a sustainable dairy enterprise. Farmers must do more and better planning if they are to achieve greater profits. Profits are not something they end up with at the end of the year. Rather, they are something for which farmers must plan (Makeham and Malcolm, 1986).
Key performance indicators
Milk production is a very complex farming activity and there are many ways to quantify the success or otherwise of dairy farming ventures. Clearly, profitability and long term sustainability are essential for farmers to maintain and even expand the magnitude of their business. Profitability is achieved by optimising the difference between the value of farm returns and costs of all the farm inputs and the following study quantifies this approach. The progression to acceptable farm profits can be monitored by a series of physical measures of cow, herd and farm performance. These are called Key Performance Indicators (KPI) and have been documented by Moran (2009b).
Table 1 lists ten series of questions that should be asked on any farm, big or small. Because more than half of farm costs are feed related, the first six questions are directly related to feeding management. Even though the remaining four are more related to overall herd management, they are still very much feed-dependent. For some of the questions, specific indicators relevant to particular farming systems can be developed. However, for others, there is no single indicator that farmers can work towards because the most correct answer is the higher the better for some (such as on farm forage production or forage quality) or the lower the better for others (such as total feed costs or calf mortality and heifer wastage rates). These indicators should be presented as ranges rather than a single value emphasising the fact that they are only guidelines.
Farmers should use these indicators to identify these weaknesses in, rather than set targets for, their farm. Farmers are more likely to try to improve their systems if they know they are less productive compared to others. Such an approach may simply encourage farmers to look more critically at their cost structures. Expressed simply, this is a diagnostic tool to help identify production weaknesses adversely affecting financial performance. These KPI’s can be more easily addressed if farmers were more aware of the simple changes required in their day to day farming practices.
This and a following paper (Moran and Brouwer 2013) are among the very few published reports in which KPI of dairy farm productivity have been directly related to measures of dairy farm business performance.
MATERIALS AND METHODS
Visits were made to 31 dairy farms in Peninsular Malaysia over a 4 week period during October 2012 to collect data on cow production, herd performance and farm profitability. These farms comprised a government dairy development program and were surveyed to provide baseline data for future development.
Each visit took 2 to 3 hours and consisted of:
• Observations of the stock, cow shed, farm facilities and forage production area to assess current farm practices and the general state of the stock and the supporting dairy infrastructure.
• Measuring the temperature and relative humidity inside the cow shed to assess the degree of climatic stress to which the milking cows were being subjected.
• A 1.5 to 2 hour interview about key aspects of the farm management, the costs of farm inputs and their herd performance. The format was consistent from farm to farm through the use of a detailed questionnaire.
• The financial data were inputted into an Excel spreadsheet which was developed to capture all the costs and returns expected on a Malaysian dairy farm. The format and capture of data were the same as the FARMPROFIT computer program described in Moran (2009a). The various farm returns and input costs were provided by the farmer. The farm’s operating costs were determined over a one month period whereas stock purchases and sales and any capital improvements were assessed over the previous 12 months. The farmer provided an estimate of the value of land, facilities and stock to calculate the total farm assets as well as providing details of any outstanding loans.
• A series of KPI were developed for each farm (as in Table 1) based on specific questions and calculations on cow, herd and farm data.
Table 1: Ten key indicators of dairy farm performance
Measure Questions to ask
Feeding management
1. Stocking capacity Is the farm carrying too much stock for the available forage supplies? 2. On-farm forage production How much of the farm’s an annual forage requirement must be purchased? 3. Forage quality Is the forage being harvested or purchased at its optimal quality for milking cows? 4. Concentrate feeding program
5. Total feed costs
6. Milk income less feed costs
What is the quality of the concentrates being fed and how much is allocated per milking cow? Are the forages and concentrates costing too much per unit of feed energy or protein? How does this compare with those of other farmers with good feeding management? Herd management
7. Percent productive cows What is the percent of adult cows actually milking? What is the proportion of milking cows in the entire dairy herd, expressed as a percentage?
8. Pattern of milk production What is the peak milk yield of the herd and what is its lactation persistency (rate of decline from peak milk yield)?
9. Reproductive performance How many days after calving do cows cycle? What are the submission rate and the conception rate to first insemination?
10. Heifer management What is the pre weaning calf mortality and the wastage rate of heifers from birth to second lactation? What is their age and live weight at first calving?
Table 2: Categorising farm costs on Malaysian dairy farms
Catagory Detail
Variable Costs
Herd and shed costs
1. Artificial insemination; inseminator, semen, drugs associated with reproductive management
2. Young stock; raw milk or calf milk replacer, concentrates & roughages and herd management to point of calving
3. Animal health; veterinarian visits, drugs, vaccines and drenches
4. Milk harvesting; rubber liners, detergents and sanitisers, maintenance of milking machines, hot water, transport to milk collection centre
Feed costs
(for milking and dry cows)
1. Purchased concentrates; formulated or ingredients 2. Purchased forages; grass, roughage by-products
3. Home grown forages; fertilisers, irrigation, processing/storage, weed and pest control 4. Machinery; fuel and oil, repairs and maintenance
Overhead Costs
Cash overhead costs
1. Paid labour 2. Farm rates
3. Farm administration and insurance 4. Finance costs; interest, bank fees
5. Other; such as telephone, professional advice, office equipment, postage Imputed
overhead costs
1. Family labour 2. Depreciation
• asking the total usage of a particular ration ingredient as well as how much was fed each day to the milking cows and all other animal groups
• asking the calving interval when already knowing how many of their adult cows were milking, dry pregnant and dry non-pregnant.
Most farmers seemed to genuinely know the answers too many of the questions as they gave a rapid response when asked. In other cases, it required an explanation for them to answer the question, such as calving interval or age at first calving. Despite our expectations, most farmers seemed quite happy to provide us with full details of any outstanding farm loans.
The data from one farm was considered too unreliable because the calculation of some of the KPI provided nonsensical values. Accordingly, data from this farmer were excluded from any analyses. This left 30 farms for the data analyses.
Assessing the cost of home grown forages
The cost of home grown forages was calculated two different ways:
• For calculating the feed costs within the FARMPROFIT program, the costs of home grown forages were incorporated into the other farm costs, such as the cost of fertiliser (variable feed costs), any
fuel and oil and repairs and maintenance costs (variable feed-related machinery costs) and also the labour to plant, harvest and transport the forages to the stock (overhead paid labour and imputed labour costs). Therefore there was no specific cost placed on the actual home grown forages
• For calculating the milk income less feed costs, the home grown forages were given a token cost of RM 0.10 per kg for fresh grass. This was for the estimated quantity of fresh grass offered to each cow and did not take into account any grass not eaten.
Calculating feed intakes of different classes of dairy stock
Farmers were asked to list the quantities of feeds they offered their different classes of dairy stock each day on average, namely:
• Lactating (or milking) cows
• Dry cows (pregnant and non-pregnant)
• Yearlings or weaned heifers
• Milk-fed calves (heifers and bulls)
Services booklet (2009) and Moran (2005, 2012a, 2012b); these feed quality data are presented in the second paper (Moran and Brouwer, 2013). When stock were provided with opportunities to graze, their pasture intakes were estimated as 20 kg fresh forage/day for milking cows, 15 kg/d for dry cows and 7.5 kg/d for yearlings. If total DM intakes (grazed pasture and concentrates) exceeded 3% of live weight (400 or 450 kg for milking cows), the assumed grazed pasture intakes were adjusted back to that total DM intake. Daily total intakes per animal (milking cow, dry cow, yearling or milk fed calf) of DM and ME and the ME and protein contents of the total diet were calculated for each farm.
Farm data analyses and collation
For each farm, the raw data on business performance was entered into a specific spreadsheet developed for the Malaysian situation entitled MALFARMPROFIT. This spreadsheet was initially developed for Vietnam and Thailand and has previously been used to monitor dairy farm business measures on over 50 farms in each of these two countries. The currency unit was Malaysian Ringgits or RM (with an exchange rate of 3.1 RM/US$) with the rest of the program unaltered. In addition to the business performance focus of the spreadsheet, additional pages were developed to quantify the feeding management of milking cows, dry cows, yearlings and milk-fed calves. These culminated in a specific page which summarised all the feeding management data in the form of a series of farm measures on milk returns, feed costs, feed efficiencies and feeding profit.
The farm input costs were categorized into various components as in Table 2. The participating farmers provided details of all these costs, including an imputed value for their family labour, if necessary. Total farm costs were tabulated either as variable (made up of herd & shed and feed costs) or overhead (made up of cash and imputed overhead costs, the latter which included unpaid family labour). On six of the farms, the farmer paid himself and his family from the farm profits whereas on the other 24 farms, family labour was not included as a cash overhead cost, hence was considered as an imputed labour cost. In these cases, the operator allowances were the opportunity costs of the farmer working as a labourer in a nearby town and did not take into account any specific dairy farm management skills.
Definitions of the measures of farm production and business performance are as follows:
Cost of milk production: (total farm costs)/ (total farm milk yield)
Stocking capacity: (adult cows)/ (total forage production area)
Feed conversion efficiency: (kg milk produced)/ (kg dry matter consumed by milkers)
Percent replacement heifers: (milk-fed heifer calves + yearlings)/ (milking cows + dry cows)
Total farm assets: the total value of livestock, land, facilities and equipment on farm
Gross farm income: the monthly income from sales of milk, livestock and any other dairy related activities
Gross milk return: (value of milk sales +sales from other dairy enterprise outputs)/ (total milk sold)
Total farm costs: the monthly sum of variable (herd & shed and feed) and overhead (cash and imputed) farm costs
Gross farm profit (on a monthly basis): (total farm income - total farm costs)/ (kg milk produced)
Equity (%) or resources owned: (farm assets owned)- (farm loans)/ (total farm assets)
Milk gross margin: milk sales – variable costs
Return on assets (%): (annual gross farm profit)/ (total farm assets)
Return on equity (%): ((annual gross farm profit)-(annual finance costs))/ (farm resources owned)
The data for each of the 30 farms were categorized on the basis of two measures, one of farm performance and the other of business management. Firstly, the herd average daily milk yield from the previous day, which included both milk sales and milk fed to calves, was used to quantify current herd performance. Secondly, the cost of that milk production was used to quantify total farm costs, calculated as the sum of all the farm inputs in Table 2 divided by the farm milk yield. Because many farmers did not consider the imputed value of their family labour as a farm input cost, a second set of farm costs was calculated which excluded imputed labour costs.
Statistical analyses
The farm performance and business management data were categorized into three groups (designated A, B and C) based on increasing herd milk yields (MY in kg/cow/d) or on increasing costs of production (COP in RM/kg milk). The first 10 farms were designated as Group A, the second 10 farms Group B and the third 10 farms as Group C. Mean values for each group are presented in Table 3 for various farm descriptors, many of which were subjective, and in Tables 4 and 5 for farm production and business data. As these data were all the mean values of three lots of ten farms stratified in a continuous array, any statistical analyses could not consider these three groups as discrete entities. Accordingly, statistical assessments of the impact of farm management and business decisions on milk yield or cost of production was undertaken using the correlation coefficient for data from all 30 farms. The level of significance of the correlation coefficients was presented in Tables 4 and 5. A significant correlation coefficient could then be interpreted as a meaningful association between that measure of farm input or output and the resultant MY or COP.
RESULTS Farm descriptors
• The 30 farms were located in four Peninsula Malaysian states, namely Johore (16 farms), Negri Sembilan (8 farms), Melaka (5 farms) and Selangor (1 farm).
• The areas of forage production averaged 6 ha per farm, ranging from zero to 80 ha; there were 6 farms with 0 ha, 9 farms with 0.1 to 2.0 ha, 7 farms with 2.1 to 4.0 ha, 5 farms with 4.1 to 10.0 ha and 3 farms with more than 10 ha of forage production area.
Table 3: Farm descriptors and other measures of farm performance, with farms grouped into either A, B or C (10 farms per group) based on increasing milk yields (kg/cow/d). See text for details of farm descriptors X, Y and Z for each data set.
Farm data A B C
Herd average milk yield (kg/cow/d) 7.5 9.7 12.4
Temperature in cow shed (°C) 32.1 31.7 32.5
Temperature Humidity Index in cow shed (units) 83 82 83
Forage production area 5X, 4Y, 1Z 0X, 6Y, 4Z 1X, 5Y, 4Z
Cow quality 4X, 2Y, 4Z 6A, 4Y, 0Z 9X, 1Y, 0Z
Electricity supplies 5X, 5Y 6X, 4Y 9X, 1Y
Piped water supplies 4X, 6Y 4X, 6Y 6X, 4Y
Adequacy of rubber mats 4X, 2Y, 4Z 4X, 2Y, 4Z 2X, 4Y, 4Z
Ethnicity of farmers 5X, 3Y, 2Z 2X, 7Y, 1Z 2X, 7Y, 1Z
Farmer attitude 3X, 4Y, 3Z 0X, 4Y, 6Z 1X, 3Y, 6Z
Farmer grazed milkers 6X, 4Y 4X, 6Y 1X, 9Y
Farmer used CMR in calf rearing 1X, 9Y 2X, 8Y 4X, 6Y
Farmer fed concentrates as slurry 2X, 8Y 2X, 8Y 2X, 8Y
Farmer suckled calves on milkers 5X, 5Y 3X, 7Y 2X, 8Y
Breeding systems 0X, 4Y, 6Z 0X, 3Y, 7Z 3X, 2Y, 5Z
Mastitis problems 2X, 4Y, 4Z 1X, 3Y, 6Z 3X, 0Y, 7Z
Lameness problems 2X, 7Y, 1Z 3X, 4Y, 3Z 3X, 3Y, 4Z
Young stock rearing problems 3X, 6Y, 1Z 3X, 5Y, 2Z 3X, 4Y, 3Z
Keep animal health records 3X, 1Y, 6Z 3X, 0Y, 7Z 5X, 1Y, 4Z
Keep financial records 3X, 7Y 5X, 5Y 6X, 4Y
Have specific calving down area 3X, 7Y 2X, 8Y 7X, 3Y
Use California Mastitis Test 4X, 1Y, 5Z 3X, 2Y, 5Z 3X, 3Y, 4Z
Use dry cow therapy 8X, 2Y 7X, 3Y 10X, 0Y
Vaccination program 8X, 2Y 8X, 2Y 7X, 3Y
Age at first calving (months) 24-36 30-36 27-36
Calving interval (months) 12-16 12-18 12-18
Lactation length (months) 6-10 6-10 9-10
Milk feeding calves (months) 2-7 2-9 2-9
Peak milk yield (kg/cow/d) 12-22 12-28 15-35
Temperature Humidity Index, based on temperature and relative humidity
milkers, 18 herds with 10 to 30, 4 herds with 30 to 50 and 5 herds with more than 50 milkers.
• Mature cow live weights were estimated to vary from 400 kg in indigenous cows to 450 kg in Friesian crossbred cows.
Air temperatures in the cow sheds ranged from 27 to 35°C, with only two of the 30 farms below 30°C. The Temperature Humidity Index indicated severe heat stress in every farm shed, namely between 78 to 89 units (Moran, 2005).
Table 3 presents other farm descriptors, categorized into the three groups based on cow milk yield. Many of these descriptors are quite subjective and have been designated X, Y and Z in the table, based on the following criteria:
Temperature in cow shed; mean of values for 10 farms
Temperature Humidity Index in cow shed; mean of values for 10 farms
Forage production area: X, zero area grown specifically for cattle forage; Y, forage production area to supply less than 20 adult cows per ha forage; Z, forage production area to supply 20 adult cows or more per ha forage.
Cow quality: X, all milking cows were improved breed (such as grade Friesians); Y, mixture of indigenous and improved milking cows; Z only indigenous milking cows.
Electricity supplies: X, connected to mains supply; Y, not connected to mains supply in dairy so must rely on generators.
Piped water: X, connected to piped water supplies; Y, not connected to piped water supplies so must rely on underground pumps, dams or tanks.
Adequacy of rubber mats: X, sufficient rubber mats for all milking cows; Y, some mats but insufficient for every milking cow; Z, no rubber mats at all.
Ethnicity of farmers: X, Chinese; Y, Indian; Z, Malays.
Farmer attitude: X, Y and Z, in increasing interaction and interest with interviewers.
Farmer grazed milkers: X, grazed milking cows during day or night; Y, did not graze milking cows at all.
Farmer used CMR in calf rearing: X, used calf milk replacer or combination of calf milk replacer and fresh milk during milk feeding; Y only fed fresh milk to calves.
Farmer fed concentrates as slurry: X, fed concentrates as a slurry mixed with water; Y, fed concentrates as air dry and water separately.
Farmer suckled calves on milkers: X, sucked calves on milkers prior to milking; Y, did not suckle calves.
Breeding systems: X, only used artificial insemination (AI); Y, only used natural mating; Z, used a combination of both systems.
Mastitis problems: X, farmer mentioned it as a specific problem; Y, identified as a possible problem; Z, farmer confirmed that it was not a problem.
Lameness problems: X, Y, Z, same designation as for mastitis.
Young stock rearing problems: X, Y, Z, same designation as for mastitis.
Keep animal health records: X, yes; Y, only for
monitoring artificial insemination; Z, no.
Keep financial records: X, yes; Y, no.
Use California Mastitis Test (CMT) for assessing subclinical mastitis: X, routinely used every 2 to 4 weeks; Y, occasionally used; Z, not used at all.
Use dry cow therapy to control mastitis: X, routinely used; Y, not use at all.
Vaccination program: X, only used for Foot and Mouth Disease (FMD); Y, do not have a program at all.
The remaining descriptors in Table 3 are the range (extremes) of values provided by the farmers. These were for age at first calving, calving interval, lactation length, period of milk feeding calves and peak milk yield.
In the herds with higher yielding cows, there was increasing use of improved dairy breeds, while more of these farms were connected to mains electricity and piped water. Furthermore, fewer of these farmers grazed their milking herds, suckled calves on their milkers or only used bulls for mating. More of these farmers used CMR to rear their calves, had specific calving down areas, routinely used dry cow therapy and kept animal health and financial records. Furthermore, fewer of these farmers reported problems with mastitis, lameness and young stock rearing. In addition, farmers with the higher yielding herds reported higher peak milk yields and did not report very short lactation lengths.
There was little difference between farm groups in the adequacy of rubber mats, with 40% of all the farmers providing none at all and only 30% supplying sufficient for all their milking cows. In each group, 20% of the farmers fed concentrates as a slurry and there were little farm group differences in either ethnicity of farmers or farmer attitudes to the interviews. All but one farmer used mechanical, not hand milking, for milk harvesting. There was also little difference between farm groups in their vaccination programs or their usage of the CMT to assess subclinical mastitis. In total, six of the farms did not grow any forage at all for their stock, relying entirely on purchased sources or in several cases, supplies from adjacent palm oil plantations. Of those who did grow forage for their stock, about half in each group had reasonable stocking capacities (Moran 2005), namely less than 20 cows per ha forage. Many farmers reported very high ages at first calving and calving intervals (30 to 36 and 14 to 16 months respectively) while very lengthy milk feeding periods (up to 9 months) were not uncommon.
All but two farmers had mechanical forage choppers while four had mechanical concentrate mixers or mixer wagons. All but three farmers had on-farm cooling and storage milk vats. On most farms, calves were group housed, often in overcrowded and dirty pens, although one or two farmers in each group provided elevated individual pens for their milk-fed calves. One or two farms in each group continually tethered their milking cows in tie stalls while the remainder either tethered their cows just for milking, had walk through or herringbone milking parlors (3 farmers) or were currently building them (4 farmers).
Data in the following paragraphs are not included in Table 3 because of incomplete data collection. In each farm group, 70 to 90% of the household income was derived from the dairy enterprise while 75 to 80% of the farm labour was hired. Most farmers reported pre-weaning calf mortality rates to be 2 to 5% although one or two farmers in each group reported figures as high as 20
or 30%. The proportion of cows that conceived within 100 days of calving varied from 20 to 40% in each group although there was the occasional farmer in each group who reported 100 day-in-calf rates as low as 10%. Voluntary waiting periods (VWP), or days between calving and first mating, varied from 40 to 80 days in each group. Virtually every farmer had a deworming program and on only about 50% of the farms were many cows seen to be ruminating.
Only about 20 of the farms had available data for milk composition and there were no apparent differences between farm groups. Average values for Groups A, B and C was respectively:
• Milk fat; 4.5, 4.2 and 4.5%
• Milk protein; 3.1, 3.2, 2.9%
• Solids not fat; 8.2, 8.7, 8.3%
• Total dissolved solids; 12.9, 12.6, 12.9%
Measures of milk quality (total plate counts) were graded into farms with milk containing less than100000, 200000 or 300,000 cfu (colony forming units)/ml milk. The available milk gradings for each farm group were respectively 0, 7, 0 for A, 1, 3, 1 for B and 0, 5, 1 for Group C, indicating that most of the farms had milk containing less than 200,000 cfu/ml.
Impacts of farm management and business decisions on milk yield and cost of milk production
The data quantifying the impacts of farm management and business decisions on MY and COP are presented in Tables 4 and 5 respectively. The correlation coefficients provide an insight into the statistical significance of these two variables to the data presented in the tables.
The size of the milking herd, the entire dairy herd or the number of adult cows per labour unit had little impact of either the MY or COP. There was also little effect of the pregnancy rates of dry cows. The percentage of milking cows in the entire herd and their average milk yields impacted on the COP. The higher the milk yield, the lower its cost of production. Farms with higher rates of heifer replacements had higher MY and lower COP.
The daily intakes of DM and ME by the milkers both impacted on MY as did the ration DM content. However, ration crude protein content had little influence. Increasing MY or decreasing COP was associated with higher ration ME content and improved feed conversion efficiencies.
The MY was related to the total daily cost for feed for the milking herd (expressed in RM/cow/d) as it (and COP) was to the feed costs for the entire herd per kg milk produced and to these total feed costs expressed as a % of milk income. Even though MY and COP were not related to the milk income less feed costs for the milkers, they were both impacted on by the milk income less feed costs for the entire dairy herd. Both MY and COP were significantly related to gross farm profit expressed as RM/kg milk produced (either including or excluding the imputed labour costs) and also to the cost of production after excluding imputed farm labour.
Table 4: The impact of herd average daily milk yield on farm production and business data, with farms grouped into either A, B or C (10 farms per group) based on increasing milk yields (kg/cow/d). Cor is correlation coefficient relating milk yield to each farm variable.
Farm data A B C Cor Sig
Herd average daily milk yield (kg/cow/d) Average
Range
7.5 5.2-8.7
9.7 9.0-10.3
12.4 10.6-15.0
- - Farm descriptors
Size of milking herd (cows) 22 48 27 0.02
Size of total herd (stock) 71 173 94 0.03
% milking cows in adult herd 49 53 61 0.27
% milking cows in entire herd 29 26 31 -0.04
% dry cows pregnant 76 73 91 0.25
% replacement heifers 47 73 80 0.52 **
Cows per labour unit (stock) 39 48 37 0.02
Farm milk yield (kg/d) 167 471 311 0.73 ***
Stocking capacity (cows/ha forage) 13 26 14 0.09
Feeding management of milking cows
Dry matter intake (kg/cow/d) 10.8 12.4 14.6 0.62 ***
Metabolisable energy intake (MJ/cow/d) 87 106 130 0.71 ***
Ration dry matter content (%) 33.6 35.7 38.9 0.40 *
Ration metabolisable energy content (MJ//kg DM) 8.1 8.5 9.0 0.41 *
Ration crude protein content (%) 11.6 12.1 12.3 0.21
Feed conversion efficiency (kg milk/kg DM) 0.70 0.82 0.87 0.45 **
Farm production costs and returns
Total feed costs for milkers (RM/cow/d) 7.44 8.75 11.41 0.62 ***
Total feed costs for milkers (RM/kg milk) 1.00 0.90 0.93 -0.16
Total feed costs for entire herd (RM/kg milk) 1.86 1.83 1.17 -0.41 *
Total feed costs as % milk income 78 76 49 -0.41 *
Gross milk return (RM/kg milk) 2.76 2.78 2.77 0.16
Milk income less feed costs for milkers (RM/kg milk) 1.39 1.49 1.47 0.18
Milk income less feed costs for entire herd (RM/kg milk) 0.53 0.57 1.24 0.41 *
Gross farm profit (RM/kg milk) -2.01 -0.75 -0.05 0.44 *
Gross farm profit less imputed labour (RM/kg milk) -1.44 -0.18 0.40 0.46 *
Cost of production (RM/kg milk) 4.77 3.53 2.82 -0.43 *
Cost of production less imputed labour (RM/kg milk) 4.20 2.96 2.37 -0.44 *
Farm business management on a monthly basis
Total farm assets (‘000 RM) 1428 3218 1792 0.07
Gross farm income (‘000 RM/month) 14.0 38.4 25.1 0.16
Total farm costs (‘000 RM/month) 19.7 45.1 26.6 0.07
Milk gross margin (‘000 RM/month) 1.6 9.5 7.5 0.22
Gross farm profit (‘000 RM/month) -5.7 -6.8 -1.6 0.19
Gross farm profit excluding imputed labour (‘000 RM/month) -3.7 -1.3 2.3 0.25
Assets as livestock (%) 21 23 23 0.05
Assets as owned land (%) 57 46 52 0.07
Equity in total farm assets (%) 96 96 96 0.21
% gross farm income from milk 88 89 90 0.14
Variable farm costs (% total farm costs) 54 55 56 0.09
Herd and shed costs (% total farm costs) 16 15 13 -0.01
Feed costs (% total farm costs) 38 40 43 0.12
Overhead costs (% total farm costs) 46 45 44 0.04
Cash overhead costs (% total farm costs) 23 16 15 -0.07
Imputed overhead costs (% total farm costs) 23 30 28 0.10
Return on assets (%) -0.6 -0.4 0.1 0.49 **
Return on equity (%) -0.9 -0.5 0.1 0.55 **
Sig; significance of correlation coefficient; * P<0.05, ** P<0.01, *** P<0.001
margin and monthly gross farm profit (either including or excluding imputed labour). The % breakdown of the farm assets, farm income and farm costs (as described above) were similar on all farms. However the two key measures of farm business efficiency, return on assets and return on equity, were both significantly related to MY and to COP.
The individual farm data relating MY to daily metabolisable energy intake (MEI) are presented graphically in Figure 1 while data relating COP to % milking cows in the adult herd (%MC) are presented graphically in Figure 2. The lines of best fit for these two
graphs and the % variation of data accounted for by these linear regressions (R2) were:
Figure 1: MY = 0.062 MEI + 3.2, R2 = 0.50 Figure 2: COP = -0.073%MC + 7.5, R2=0.24
Overview of farm profitability
Fig. 1: The relationship between intake of metabolisable energy (in MJ of ME/cow/d) and milk yield (in kg/cow/d)
Fig. 2: The relationship between the % of milking cows in the adult herd and the cost of milk production (in RM/kg milk)
in other words farm costs did not include imputed labour, the number of farms with positive gross farm profits increased to 18 of the 30 farms surveyed. In this case, the extreme values were a monthly loss of 45.2 K RM to a monthly profit of 24.2 K RM. After excluding imputed labour, which averaged 3.8 K RM/month, the mean farm profit of the 30 farms increased from -4.6 to +0.8 K RM/month.
DISCUSSION
Characteristics of the most productive and profitable farms
This survey has provided many valuable insights into why some farms are productive and profitable and why others are not. In essence, higher per cow milk yields were recorded on farms that were better equipped and better managed. Some of these contributory farm factors including:
• Reliable electricity and water supplies
• Specific calving down areas
• More improved breeds of dairy stock
• Not grazing the milking cows
• Not suckling the calves on milkers
• Using AI rather than natural mating
• Using CMR as part of their calf feeding program
• Routinely using dry cow therapy as part of the mastitis control program
• Keeping better farm records
• Having less problems with mastitis, lameness and young stock rearing
• Having more of the cows with high peak milk yields and fewer with short lactations
However there were other farm factors in this survey that were not associated with higher per cow milk yields and these included:
• Herd size and the proportion of milking cows in the adult and entire herd
• % of dry cows pregnant
• Climatic stress; this was severe on every farm
• Mechanical forage choppers as these were used on virtually every farm
• Use of tie stalls for permanent tethering of cows
• Stocking capacity or number of adult cows per ha of forage grown
• Labour efficiency as quantified by the number of adult cows per labour unit
• Engaging in other farming enterprises or off farm employment as quantified by % of income from dairy enterprise
• Ethnicity and attitude of the farmers towards the interview process
• Use of rubber mats as each farm group as only 30% of each farm group provided sufficient for the milking herd, and in all cases they were thin mats which provided minimal comfort
• Use of slurry feeding which was apparent in 20% of the farmers in each group
• Housing of milk fed calves, which was inadequate on most farms.
• Routine use of CMT in mastitis control
• Vaccination and deworming programs
• Milk composition and quality
• Days of VWP after calving down
• There were also no obvious relationships between milk yield and age at first calving, calving interval or length of milk feeding period.
The published literature abounds with reference texts and proceedings of international conferences highlighting dairy cow production responses in tropical small holder farms to investment in facilities and to better farm management decisions and actions. In addition to those previously cited and written by the senior author, these include FAO (1989), Falvey and Chantalakhana (1999), Rangekar and Thorpe (2002), Chantalakhana and Skunmun (2002), Devendra (2010) and FAO (2010).
The statistical analyses reported on Tables 4 and 5 provided further insights into cow performance and milk production costs. Certain measures of feed costs and business performance either impacted on, or were impacted by, MY and COP while others were not. Those related to MY were as follows:
• % replacement heifers in the herd
• Milking cow intakes of DM and ME
• Ration DM and ME contents, but not protein content
• Feed conversion efficiency
• Daily milker feed costs and feed costs as a % of milk income
• Unit feed costs (RM/kg milk) for the entire herd
• Feeding profit (milk income less feed costs) for the entire herd
Table 5: The impact of cost of milk production on farm production and business data, with farms grouped into either A, B or C (10 farms per group) based on increasing cost of production (in RM/kg milk). Cor is correlation coefficient relating cost of milk production to each farm variable
Farm data A B C Cor Sig
Cost of production (RM/kg milk) Average
Range
2.48 2.04-2.90
3.14 2.91-3.63
5.51 3.70-9.07
- - Farm descriptors
Milking cows (stock) 54 20 23 -0.24
Total herd size (stock) 177 76 85 -0.21
% milking cows in adult herd 60 57 47 -0.49 **
% milking cows in entire herd 30 29 27 -0.31
% dry cows pregnant 80 81 78 -0.22
% replacement heifers 79 69 52 -0.45 *
Cows per labour unit (stock) 48 48 29 -0.30
Farm milk yield (kg/d) 551 196 202 -0.28
Stocking capacity (cows/ha forage) 34 20 6 -0.27
Herd average milk yield (kg/cow/d) 10.8 10.2 8.5 -0.44 *
Feeding management of milking cows
Dry matter intake (kg/cow/d) 12.4 12.5 12.8 -0.00
Metabolisable energy intake (MJ/cow/d) 112 108 103 -0.16
Ration dry matter content (%) 38.3 35.6 34.3 -0.29
Ration metabolisable energy content (MJ//kg DM) 9.0 8.5 8.1 -0.39 *
Ration crude protein content (%) 12.7 11.5 11.8 -0.18
Feed conversion efficiency (kg DM/kg milk) 0.89 0.84 0.67 -0.52 **
Farm production costs and returns
Total feed costs for milkers (RM/cow/d) 8.86 10.07 8.58 -0.14
Total feed costs for milkers (RM/kg milk) 0.84 0.97 1.02 0.30
Total feed costs for entire herd (RM/kg milk) 1.45 1.43 1.97 0.61 ***
Total feed costs as % milk income 61 59 83 0.62 ***
Gross milk return (RM/kg milk) 2.79 2.84 2.68 -0.09
Milk income less feed costs for milkers (RM/kg milk) 1.55 1.44 1.37 -0.34
Milk income less feed costs for entire herd (RM/kg milk) 0.94 0.97 0.42 -0.62 ***
Gross farm profit (RM/kg milk) 0.31 -0.30 -2.83 -0.98 ***
Gross farm profit less imputed labour (RM/kg milk) 0.55 0.22 -1.99 -0.94 ***
Cost of production less imputed labour (RM/kg milk) 2.24 2.62 4.67 0.96 ***
Farm business management on a monthly basis
Total farm assets (‘000 RM) 2791 1574 2071 -0.02
Gross farm income (‘000 RM/month) 44.6 16.8 16.0 -0.28
Total farm costs (‘000 RM/month) 41.9 18.6 30.9 -0.02
Milk gross margin (‘000 RM/month) 14.8 3.4 0.4 -0.48 **
Gross farm profit (‘000 RM/month) 2.7 -1.8 -14.9 -0.55 *
Gross farm profit excluding imputed labour (‘000 RM/month)
6.3 1.4 -10.3 -0.61 **
Assets as livestock (%) 28 18 20 -0.13
Assets as owned land (%) 46 63 46 -0.03
Equity in farm assets (%) 96 95 97 0.07
% gross farm income from milk 89 85 93 -0.27
Variable farm costs (% total farm costs) 59 58 47 -0.12
Herd and shed costs (% total farm costs) 15 17 13 -0.13
Feed costs (% total farm costs) 44 41 34 -0.12
Overhead costs (% total farm costs) 41 41 53 0.09
Cash overhead costs (% total farm costs) 18 12 20 0.17
Imputed overhead costs (% total farm costs) 23 30 34 0.02
Return on assets (%) 0.3 -0.2 -1.0 -0.62 ***
Return on equity (%) 0.3 -0.5 -1.2 -0.48 **
Sig; significance of correlation coefficient; * P<0.05, ** P<0.01, *** P<0.001
• Cost of production
• Return on total farm assets and equity Those related to COP were as follows:
• % replacement heifers in the herd
• % milkers in the adult cow herd
• Ration ME content and the feed conversion efficiency
• Feed costs as a % of milk income
• Unit feed costs (RM/kgmilk) for the entire herd
• Feeding profit (milk income less feed costs) for the entire herd
• Milk gross margin
• Gross farm profit
• Return on total farm assets and equity
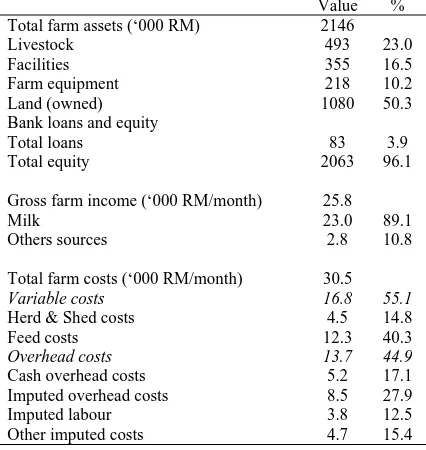
Table 6: Breakdown of total farm assets, income and farm costs. Mean values for all 30 farms surveyed.
Value %
Total farm assets (‘000 RM) 2146
Livestock 493 23.0
Facilities 355 16.5
Farm equipment 218 10.2
Land (owned) 1080 50.3
Bank loans and equity
Total loans 83 3.9
Total equity 2063 96.1
Gross farm income (‘000 RM/month) 25.8
Milk 23.0 89.1
Others sources 2.8 10.8
Total farm costs (‘000 RM/month) 30.5
Variable costs 16.8 55.1
Herd & Shed costs 4.5 14.8
Feed costs 12.3 40.3
Overhead costs 13.7 44.9
Cash overhead costs 5.2 17.1
Imputed overhead costs 8.5 27.9
Imputed labour 3.8 12.5
Other imputed costs 4.7 15.4
between both MY and COP and the returns on assets and on equity of the farm operations, indicate a close association of herd performance and farm profits on the efficiency of utilising the farm resources, either owned by the farm or the lender.
Published surveys of dairy farm performance have consistently shown milk production to positively respond to the range of improved farm management decisions highlighted above. Such studies have been reported from Thailand (Pongpiachan et al., 2000), Sri Lanka (Ibrahim and Zemmelink, 1999), Peru (Bernet and Leon-Velarde, 2000), Spain (Bach et al., 2008) and Ethiopia (Asres et al., 2013). However very few, if any, have concurrently monitored and found corresponding improved farm profits, although the Sri Lanka and Spain studies above did use computer modeling to predict beneficial economic farm performances. In their detailed business analyses of 130 dairy farms in Thailand, Lapar et al. (2005) concluded that these farms were operating at 26% higher costs than the best practice and that this farm profitability was constrained by the large gap between technology dissemination and successful adoption. As with many such studies, they found a need towards adjusting the technology to suit varying circumstances and resources of smallholder dairy systems.
Interpreting some of the key indicators of farm performance
Ages of heifers at first calving were frequently too high (30 to 36 months) and this could be exacerbated by some farmers deciding not to mate their heifers until 20 to 24 months of age because of an ill founded concern that mating any earlier would adversely affect future milk production. Calf mortality rates of 2 to 5% are acceptable but not the 20 to 30% as mentioned by some farmers (Moran, 2011). Furthermore, 100 day-in-calf rates of 20 to 40% and dry cow pregnancy rates of only 70 to 80% are indicative of reproductive problems leading to lengthy calving intervals (16 to 18 months), given the fact that the
VWP of 40 to 80 days would not be considered abnormally long. Quantifying the number of services (both inseminations and natural matings) per conception and the average number of inseminations required by each pregnant cow would help identify the causes of such problems (Falvey and Chantalakhana, 1999; Rangekar and Thorpe, 2002).
The KPI for the proportion of milking cows in the adult herd as recommend by Moran (2009b) and the number of herds achieving them are as follows:
Excellent >74% 2 herds
Acceptable 60-73% 8 herds
Below average 50-59% 12 herds
Not good 40-49% 5 herds
Even worse <40% 3 herds
Clearly, these farms suffered from a lack of productive cows in each herd, as is evident from Figure 2 which highlights the higher costs of milk production on farms with fewer milking cows in the adult herd. Many of the farms were building up herd sizes so have retained or purchased a larger number of young stocks than if they were stabilised herds. Replacement rates were very high (averaging 50 to 80% in the different groups), compared to the more normal 25 to 30% in stabilized herds (Moran, 2005). Future herd management must concentrate on improving reproductive performance and in some instances reducing young stock mortality as well as improving the nutritional status hence performance of the milking herd.
Lengthy milk feeding periods up to 9 months are indicative of poor calf rearing protocols although it does buffer the calves against the adverse impacts of poor feeding management post-weaning. However one of the farmers did not provide any solid feed to his calves until they were 3 months of age. Coincidently, he reported a very high calf mortality following weaning and this could be attributed to poor rumen development because of lack of solid feeds during early life (Moran, 2012c).
On certain farms in Johore, the FMD vaccination program was very haphazard and in some cases had ceased altogether, with stock now highly susceptible to FMD. None of the farmers practiced a regular vaccination program other than with the free government-supplied FMD. Most of the farmers only relied on the external parasite program freely supplied by the government veterinarians (at the same time as the FMD vaccinations) whilst very few had an extra parasite control program of their own.
Shed designs were generally poor in that roofs were low, there was no gap in the roof for heated air to escape and shed hygiene had much that could be improved. Far too many milking cows (and young stock) had very dirty coats and were often forced to live in appalling conditions. Despite the high levels of heat stress on all farms, only one farm had fans (which were poorly located and virtually ineffective) while only one other had a sprinkler system for cooling cows. Tie stalls were common with only 6 farmers reporting free stalls or individual pens for milking cows. Many of the farmers specifically identified lameness as an issue on their farm. In at least 10 of the sheds, the milking cows did not appear comfortable, with high respiration rates (in excess of 70 per minute) and few cows lying down while ruminating. With only 10 farms supplying sufficient rubber mats for the milking cows to lie on and they were all thin (less than 10 mm thick), cow comfort is a high priority that needs to be addressed. Several farmers had recently or were in the process of constructing new sheds with high roofs, adequate ventilation and much improved shed effluent drainage indicating an awareness of many of these problems and some degree of optimism in their dairy industry.
Feeding management of milking cows
The dramatic effect of daily ME intake on milk yield is highlighted in Figure 1. Higher ME intakes can be achieved through higher DM intakes and higher ration ME contents, both of which impacted of MY. The DM intakes are typical for traditionally managed dairy cows on many tropical small holder farms but the ration ME contents (averaging 8.1 to 9.0 MJ/kg DM in the three groups) are very marginal (Moran, 2005). Although not significantly related to MY, the ration protein contents (averaging 11.6 to 12.3% for the three groups) are also marginal for milking cows (Moran, 2005). Feed conversion efficiencies were reflected in both MY and COP and the highest values group values recorded (0.8 to 0.9 kg DM/kg milk) were low compared to what could be expected in Friesians (1.0 to 1.5 kg DM/kg milk, Little 2010). The facts only on 50% of the farms were large numbers of cows seen to be ruminating while resting is indicative of fibre deficiencies.
With just 50% of the farms having piped water for their stock, it is highly likely that in many cases restricted access to clean drinking water would have been a constraint to appetite hence milking cow performance. In many cases cows in tie stalls were not even offered water during the heat of the day while grazing cows were rarely given access to water outside the shed. Without piped water, there is no guarantee that cows will be able to voluntarily drink sufficient to meet their needs. Water
quality from bores or dams also needs to be tested from time to time to ensure its drinking quality is suitable.
The fact that six farms had no home grown forage while another nine had limited supplies of forage (that is had stocking capacities of more than 20 adult cows per hectare of forage), meant that there were periods during the year (particularly during the dry season) when many of the farms would have to depend on purchased forages or forages harvested by farm staff. It is likely that such forage quality would be limiting, adversely affecting farm milk production. One farmer had year-round access to sweet corn trash (residues from the canning factory) which provided him with a cheap, year-round supply of reasonable quality forage. The feeding management on these farms, including the KPI of costs per unit feed energy and protein, will be a topic for further discussion in the following paper (Moran and Brouwer, 2014).
Milk harvesting systems
Nearly 50% of the farmers did not routinely use CMT while some of these were even unaware of its role in mastitis management. The levels of subclinical mastitis need to be ascertained to help develop more pro-active mastitis treatment programs, and if possible, mastitis eradication programs. One farmer preferentially used traditional herbal medicines in an unsuccessful attempt to manage mastitis.
In-line vacuum milkers were common and some of the farmers did ensure that they were operating effectively, with pulsation rates of 60/min and vacuum pressures of 50-60 KPA. On some farms there were potential problems with these lines being too lengthy, as vacuum pressure drop off when bucket milkers are connected to distant vacuum taps. In far too many cases the rubber liners were much pitted and obviously in use for far too long. This leads to teat irritation, poor cleaning of milk clusters and increasing levels of subclinical mastitis (Moran, 2012b).
The milking hygiene on some farms was very poor and an even bigger concern was the fact that some farm owners erroneously thought their milking staff were doing a good job. One of the poorest milking procedures we observed was on one farm where three towels were used to clean the udders and teats of 40 milking cows and in between use, the towels were simply dropped onto a dirty concrete floor. There was little evidence on any farm of using one towel per cow or at least putting them into sterilised solutions in between uses.
The use of suckling calves to ensure milk let down is all too common (30% of farms). One farmer even used oxytocin on cows whose calves have died. Cows, even Zebus, do not require the presence of a calf to stimulate milk let down (Moran 2012b). It may take some time to retrain such cows but in the long run, labour inputs will be much lower and the calves can be managed to wean off milk at a much earlier age. However, using suckling calves to stimulate milk let down can help in mastitis control in severely affected herds.
Total farm assets, borrowings, income and inputs
The mean values of total farm assets, borrowings, income and inputs for all 30 farms are presented in Table 6. On average, each farm was worth RM 2.15 million, with 50% of that value in land, 23% in livestock, 16% in facilities and 10% in farm equipment. On average, the bank owned 4% of this in the form of unpaid loans. Monthly farm incomes averaged RM 25.8 thousand of which 89% was derived from milk sales. Monthly farm costs averaged RM 30.5 thousand of which 55% were variable and 45% overhead. The highest contributor to total farm costs was feed, which constituted 40% of total or 73% of variable costs. The next highest contributor was imputed overheads, at 28% of total farm costs, followed by cash overheads then finally herd and shed costs which made up 17% and 15% respectively of total farm costs. Imputed labour comprised 12% of the total farm costs but this would underestimate family labour because only 6 of the 30 farmers paid themselves and their family as part of their cash overheads.
As it costs each farm on average, RM 30,500 each month to generate RM 25,800 total farm income, the farms were each losing RM 4,700 per month. However of that, they were generating RM 3,800 in imputed labour, which if excluded from farm costs, would reduce this loss to RM 900 per month. These calculations do not take into account wealth creation from appreciating land and stock values; this can only be calculated once several years of farm data become available. However, this survey does take into account depreciation of farm assets such as replacing equipment and farm facilities.
Seeking the solutions
It is time to address the problems as to why these farmers are achieving such poor levels of cow performance, namely:
• 10 kg milk, compared to a realistic15 kg/cow/d
• 15 to 18 months calving intervals, instead of 12 to 15 months
• 30 to 33 months age at first calving, rather than 24 to 27 months
• High numbers of cows suffering from climatic stress, as is evident by their respiration rates exceeding 70 breaths per minute
• High levels of subclinical mastitis
• Unacceptable levels of cow lameness
• High mortality rates in young stock often with little diagnoses of the cause
The major conclusion from the business analyses was that dairy farming was not a highly profitable venture in Peninsula Malaysia under the current economic climate and with existing levels of herd and farm management as only 27% of the farms had positive gross profit. However, this increased to 60% if farmers excluded their family labour from the costs of milk production.
The associated paper of this survey (Moran and Brouwer 2013) discusses the feeding management in more detail, potential cost savings from improved herd practices and the diversity of concerns expressed by these farmers when asked the open question “Please list the three major constraints to your overall dairy farm performance and profitability”. It also discusses factors influencing the success or otherwise of national dairy development schemes.
REFERENCES
APHCA, 2007. An APHCA brief on small holder dairy development, The Asia Pacific dairy strategy project, Animal Production and Health Commission of Asia and the Pacific, Bangkok http://www.aphca.org/ reference/dairy/chiangmai_workshop_feb08.html Asres A, J Solkner and M Wurzinger, 2013. Innovation
and technical efficiency in the smallholder dairy production system in Ethiopia, J Agric Sci and Technol, A3, 151-164.
Bach A, N Valls, A Solans and T Torrent, 2008. Associations between nondietary factors and dairy herd performance, J Dairy Sci, 91: 3259-3267. Bernet T and C Leon-Velarde, 2000. Income effects of
fodder and herd management on small-scale milk producers in the northern Peruvian Andes. Lives Res Rural Dev, 12: 1-17.
Chantalakhana C and P Skunmum, 2002. Sustainable smallholder animal systems in the tropics, Kasetsart University Press, Bangkok, Thailand.
Department of Veterinary Services, 2009. Nutrient composition of Malaysian feed materials and guides to feeding of cattle and goats. Feeding Guide Series, 2nd Edition. DVS, Ministry of Agriculture and Agro-based Industry, Malaysia.
Devendra C, 2010. Small farms in Asia. Revitalising agricultural production, food security and rural prosperity. Academy of Sciences, Malaysia.
Dugdill B and N Morgan, 2008. Small holder dairying in the Asia-Pacific region. Synthesis of nine country lessons learned studies. In Developing an Asian regional strategy for sustainable small holder dairy development. pp: 6-12, Proc of an FAO/APHCA/ CFC funded workshop, Chiang Mai, Feb, 2008. Falvey L and C Chantalakhana, (Ed). 1999. Smallholder
dairying in the tropics. International Livestock Research Institute, Nairobi, Kenya.
FAO, 1989. Feeding dairy cows in the tropics. Ed A. Speedy and R Sansoucy. FAO, Rome.
FAO, 2010. Status and prospects for smallholder milk production. A global perspective. Ed T Hemme and J Otte FAO, Rome.
FAOSTATS, 2013. FAO statistics on line, http://faostat3. fao.org/home/index.html#DOWNLOAD
Ibrahim MNM and G Zemmelink, 2000. A comparative evaluation of integrated farm models with the village situation in the Forest-Garden area of Kandy, Sri Lanka.Asian-Aust J Anim Sci, 13: 53-59.
Lapar Ma L, A Garcia, S Aditto and P Suriya, 2005. Measuring cost efficiency in smallholder dairy: Empirical evidence from Northeast Thailand, Presented at annual meeting of the American Agricultural Economics Association, Rhode Island, USA, July 2005. Little S, 2010. Feed conversion efficiency, A key measure of feeding system performance on your farm, Dairy Australia, Melbourne.
Makeham J and L Malcolm, 1986. The economics of tropical farm management, Cambridge University Press, Cambridge.
Australia. http://www.publish.csiro.au/nid/197/issue/ 3363.htm
Moran JB, 2009a. Business management for tropical dairy farmers. CSIRO Publications, Melbourne, Australia, http://www.publish.csiro.au/nid/220/issue/5522.htm Moran J, 2009b. Key performance indicator’s to diagnose
poor farm performance and profitability of small- holder dairy farmers in Asia. Asian-Aust J Anim Sci, 22: 1709-1717.
Moran J, 2011. Factors affecting high mortality rates of dairy replacement calves and heifers in the tropics and strategies for their reduction. Asian-Aust J Anim Sci 24: 1318-1328.
Moran J, 2012a. The nutritive value of feedstuffs for dairy farmers in South East Asia. Report published by Profitable Dairy Systems, May 2012.
Moran JB, 2012b. Managing high grade dairy cows in the tropics. CSIRO Publications, Melbourne, Australia. http://www.publish.csiro.au/nid/220/issue/6812.htm
Moran JB, 2012c. Rearing young stock on tropical dairy farms in Asia. CSIRO Publications, Melbourne, Australia, http://www.publish.csiro.au/nid/220/issue/ 6810.htm
Moran J and J Brouwer, 2013. Feeding management and farmer concerns about constraints to production on Malaysian dairy farms. Int J Agric Biosci, 2: 234-241.
Pongpiachan P, P Rodtian and K Ota, 2000. Lactation in cross and purebred Friesian cows in northern Thailand and analyses on effects of tropical climate on their lactation. Asian-Aust J Anim Sci, 13: 1316-1322.