AJAERD
Assessing the Food Security Determinants among Rural
Households in Kano, Nigeria
*Mukhtar Mustapha
1, Roslina B. Kamaruddin
2, Shri Dewi
31,2,3University Utara Malaysia, School of Economics, Finance and Banking, Sintok 06010, Kedah, Malaysia
Food security is a serious challenge in Nigeria as a whole and Kano in particular. Numerous factors combine to make households food insecure, especially the rural households in Kano State. The aim and objective of the study is to indicate the food status of the rural households and identify the major determinants of food security in the region. Using a sample size of 326 rural households from eight local government areas in Kano, this study assessed the food security of rural households through a food security index (FSI). A binary regression was applied to identify the factors that determine food security in rural Kano. The FSI result revealed that 60% of the rural households are food insecure. Binary regression outcome revealed that age of household head, education, involvement in farming, farm size, expenditure, livestock ownership, household size and income of household members were found to be statistically significant factors. It is suggested that household heads, especially males, should curtail the size of the household; women in the study area need to be educated on the basic nutritional requirements and minimum standards of hygiene so that households; food security could be improved.
Key words: food security determinants, rural households, Kano State.
INTRODUCTION
The concept of food security in the eyes of the world has taken a different dimension. The Food and Agricultural Organization (2017) projected that the figure of people suffering from hunger in the world was approximated at 815 million, indicating an upward movement from 775 million in 2014 and 777 million in 2015. Out of the total figure, 98% of the hungry people resided in developing countries, while the remaining 2% were located in developed countries. The finding also indicated that 1 in 10 individual in the world is faced with chronic food security challenge.
FAO (2017) estimated that 27.4% of the total populations in the African continent were facing a serious and chronic food security issue, which is estimated to be four times more than any other continent in the world. This is an increase from the estimated previous figure of 22.7% by the end of 2016. Sub Saharan Africa has the highest number of hungry individuals in Africa estimated at about 306.7 million and that West Africa accounted for an estimated 12% of the total figure of hungry people in Africa. Among the causes identified were the unpredictable rise in global food price, government continuous neglect in the
agricultural area, conflicts especially in Eastern Africa, climate change, gender inequality and high level of unemployment (FAO, 2012).
In early 2017 the United Nations declared that more than 20 million people were at the risk of famine in four countries including Nigeria, Somalia, South Sudan and Yemen. Specifically in the Northeastern part of Nigeria, an estimated of 4.5 million people were facing serious food security challenge due to conflict (United Nations
Development Programme, 2017a and Von Grebmer et al.,
2017). Global Hunger Report positioned Nigeria at number 90th out of 105 countries in the World in 2015 (Von
Grebmer et al., 2015), and number 84th out of 118
countries in 2017. The report indicated that the level of food insecure people in the country was 25.4% (46 million people) of the estimated population of 180 million (Von Grebmer et al., 2017).
*Corresponding author: Mukhtar M. Mustapha, University Utara Malaysia, School of Economics, Finance
and Banking, Sintok 06010, Kedah, Malaysia. Email:
mustaphamukhtar@ymail.com
Journal of Agricultural Economics and Rural Development
Vol. 4(2), pp. 501-512, October, 2018. © www.premierpublishers.org, ISSN: 2167-0477
The concept of food security was first presented to the World Food Conference in the year 1974 and a definition based on providing adequate and available food at the national level was coined without considering the individual household. However World Bank (1986) modified the definition to include individuals at all level that is characterized by accessibility to adequate and enough food with the required nutritional quality for a healthy as well as dynamic life. Food security is achieved, when there is a present of physical and economic access to a safe, sufficient and nutritious food, that satisfy a healthy and vigorous life (FAO, 1996). However, a recent definition was given by FAO (2015) as a condition where individuals at all level and always possess physical, social as well as economic accessibility to a safe and sufficient as well as nutritional food that converge with people dietary requirement as well as inclination in term of food, which in turn ensure a dynamic life plus healthy life style. Thus food security is much more than the issue of food production and food accessibility. To achieve food security both the necessary and sufficient condition need to be satisfied, these conditions are what we term as food security
components, according to Gross et al. (2000) these
components include availability, accessibility, utilization and stability of food. Food availability is a mirror image of food supply and is a necessary condition, but not sufficient to guarantee food security either at the national level, household level or even individual level; in the same vain food access is a necessary condition but not sufficient to guarantee enough food and nutritional status (Barrett and Lentz, 2009).
Source: Gross et al., 1996.
Researches on food security status have been conducted in various locations of the world including Brazil (Felker-Kantor and Wood, 2012); Ethiopia (Bogale, 2012); Ghana
(Owusu et al. 2011 and Kuwornu et al. 2011); India
(Saxena, 2018); Kenya (Kassie et al, 2014 and Korir et al, 2018); Malaysia (Solaymani, 2018); Pakistan (Asghar and
Mohammad, 2013); Punjab (Bashir et al. 2013) and
Zimbabwe (Mango et al. 2014). Just like the rest of the world, there are various researches on food security status in Nigeria especially among rural households (Babatunde
et al. 2007; Arene and Anyaeji, 2010 and Omonona and Agoi, 2007). Numerous approaches were adopted in
finding the food security status of households ranging from dietary diversity, household income and expenditure approach, food security index and aggregate household food security index etc.
The recent studies conducted in Nigeria on rural households’ food security status include: Abu and Soom (2016) their study investigated the analysis of factors affecting food security in Benue State, Nigeria using a food security index and a probit regression model. Result revealed that 53.3% and 62.2% of the rural and urban households were food secure respectively. Major factors
affecting households’ food security status include,
household head income, family size, farm size and household head age.
Oyekale et al. (2017) studied the analysis of rural
households food security status in Ogun State, Nigeria, using descriptive analysis and probit regression model, the result indicated that 70.1% of the rural households were food secure using household per capita expenditure.
While, Okpokiri et al. (2017) conducted an assessment of
food security status of rural households in Abia State, Nigeria, using a food security index and probit regression analysis approach. Results revealed that 36.7% were food secure. Result from probit regression revealed that household head’s farm size; marital status; family size and farm income were the major determinants of food security among the households.
Ehebhamen et al. (2017) researched in rural households’
food security and coping strategies adaptation in Edo State, Nigeria using calorie intake estimate, food poverty line, coping strategies index and logit regression. Result revealed that 47.3% of the rural households were found food secure. Household head’s income, education, size of land cultivated, level of livestock ownership, age and family size were the major determinants affecting household food security status in the area. Another study by Arene and Anyaeji (2010) investigated the determinants of food security among households in Nsukka metropolis of Enugu State, Nigeria using household expenditure approach and the binary logistic model. Result revealed that 40% of the households were food secure and that income and age were the major determinants of food security status among the households in the area.
METHODOLOGY Data and Sample
The study used primary data via a structured questionnaire administered and collected from a sample of 326 rural household heads in Kano, Nigeria. A stratified sampling technique was adopted to select four local government areas each from Northern Kano and Southern Kano (where rural areas were located) using a random selection. Food Security Index (FSI) was used to identify the level of food security among respondents and a Binary Logit Model was used to analyze the factors that influence food security status among the rural households in Kano.
Food Security Index
In most food security researches, there are two objective approaches used in measuring food security, measuring the gross production and purchase over a period of time incurred by household which gives direction to either increase or decrease of household stocks over a period of time or measuring household consumption recall for individual members in a household, then calorie intake measured from each food item (Maxwell, 1996). The consumption and expenditure report obtained through survey provide the household calorie. The quantity of each food items consumed daily was determined. Food items were converted to grams and calories were obtained using nutrients composition table of common food eaten in
Nigeria (appendix 1) adopted by Babatunde et al. (2007)
as provided by Oguntona and akinyele, (1995) and USDA (2005).
By taking the estimated calorie of the household and dividing it with household adult equivalent after taking into account average consumption factors of household sex and age category (Table 2.1) also considering adjusted household size for adult equivalent table provided by Stefan and Pramila, (1998) in (appendix 2). Per capita intake of the calorie is obtained. A household per capita calorie intake in excess or identical to 2,710 kcal daily is regarded as food secure and any amount shy of the recommended 2,710 kcal the household is regarded as food insecure.
Table 1: Recommended Daily Energy intake and Equivalent Scale
Age category (yrs) Average energy
allowance/day
Factor equivalent
Children less than 6 yrs 1160 0.3
Children (6 – 18) yrs 2030 0.7
Adults (> 18) yrs 2710 1.0
Source: Kuwornu et al., 2013.
Calorie intake of individuals in the household is measured by food security index FAO recommended average calorie intake by individuals depending on the location and
country. Global average of calorie intake recommended by FAO daily is 2,780 kcal (FAO, 2016). Nigeria average daily calorie intake is estimated at 2,710 based on FAO food
balance sheet (Okwoche and Benjamin, 2012; Muche et
al., 2014; Fawole et al., 2016 and Schmidhuber et al., 2018). The index is given as follows:
𝑌𝑖 = 𝑋𝑖
𝑅 ………Equation (1)
Where Yi is food status of household ith assigning the value of (1) representing food secure and (0) representing food insecure; Xi represent per capita calorie intake of ith household daily, R represents per capita daily calorie recommended which in the case of Nigeria is 2,710 kcal.
The surplus/shortfall ratio index and head count are given as follows:
(f) = ……….Equation (2)
Gi = …………Equation (3)
(f) = 1 𝑀 ∑
𝑚
𝑖=1
…Equation (4)
Where M represents the number of households classified as insecure in term of food (food secure household); Gi is the per capita calorie deficiency (per capita surplus). Surplus or shortfall provided the extent or severity to which household either exceeded or fall short of food security line.
Binary Logit Model
Depending on the outcome of food security index Yi, the logit model was estimated to ascertain the food security determinants among the rural household, thus the implicit model form is given as follows:
Yi = 𝛽Xi+𝜇𝑖……….Equation (5)
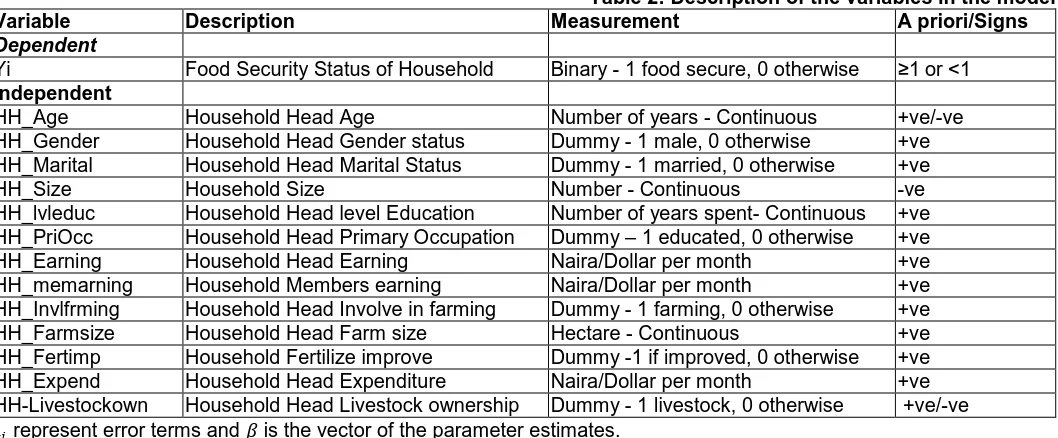
Where Xi is the vector of the explanatory variables, 𝜇𝑖 is the error terms and 𝛽 is the vector of the parameter estimates. Thus explanatory variable included in the model includes:
Household head age: Measured in years. The household head age is expected to assume a major role on household food production, which directly affects household food security status. Age impacted on the supply of labour, job opportunity as well as income generating activities. Thus the younger the household head, the stronger and energetic he would be, this can enable him cultivate a vast farmland than the older household head. The expectation of age could be positive and negative.
m
i i
G
M
11
R
R
y
i
Gender status of household head: This refers to the sex of household head, measured as (1) for male headed and (0) for female head, expectation here is household headed by male would be food secured then household headed by female, it is generally believed that male household can easily mobilizes labour to the farm then a female counterpart.
Household head marital status: Marital status of heads of household could be married, divorced or widow. Household considered married takes the value of (1) while household headed by either divorced or widow are considered unmarried, thus takes the value (0). The expectation is that household headed by a married male; with small size of family and a good source of income could be food secure than a household managed by a female with a large number of dependent individuals and no means of income source.
Household head level of Education qualification: Considered as social capital, with positive impact to the food security status of the household, normally through well-informed production and nutritional strategies. Education is a dummy variable, thus the higher the level of education qualification the higher the tendency of household becoming food secure.
Primary occupation of household head: Occupation is the source of income to the household heads, occupation ranges from private, public and farming occupation or none at all. Household head with occupation takes the value (1) otherwise takes (0). Thus household head with a good occupation is expected to be food secure, then household head without occupation.
Household head total income: Expectation of household head with high earning to be food secure is higher that household with low income earning capacity. Measured in Naira and converted into Dollar equivalent.
Household member’s earning: The higher the number of household members earning income within the household the higher the tendency of the household food security status. Members earning measured in Naira and converted to Dollar equivalent.
Household head involvement in farming: Either as a primary occupation or otherwise, household involvement in farming has a tendency of increasing household food security status. Thus involvement in farming is expected to increase household food security either through own food production or cash crop production. Household head involved in farming is assigned value (1) otherwise (0).
Household head farm size: farmland measured in hectares (ha), the expectation is with large farmland by the household head, the more food secures the household, this is because all things being equal the higher the productivity expected.
Fertilizer application in the farm: More productivity is expected with application of fertilizer by the household head, measured in kilogram (kg).
Total monthly expenditure: Household total expenditure in a month was measured in Naira and converted to Dollar equivalent. Household food security status increases with high monthly expenditure on a food item, then with a lower monthly expenditure.
Livestock ownership by household head: Household head ownership of livestock could have a positive or negative impact on food security. Livestock could be used during stun; therefore household head with livestock was signed (1) otherwise (0).
Household size: This measures the household size, which, include the number of adult equivalent. A household with large size, low income and low farm productivity are expected to be food insecure, a small size household with a high source of income and having high farm productivity is expected to be food secure and it is measured in number.
Method of Data Analysis and Model Specification
Descriptive statistics and binary regression were used to conduct the analysis. The logit estimated the coefficients; the logistic estimated the odds ratio while the marginal effect (dy/dx) provided the percentage probability of the outcomes. The empirical model is stated below:
Yi= 𝛽0+ 𝛽1𝐻𝐻_𝐴𝑔𝑒 + 𝛽2𝐻𝐻_𝐺𝑒𝑛𝑑𝑒𝑟 + 𝛽3𝐻𝐻_𝑀𝑎𝑟𝑖𝑡𝑎𝑙 + 𝛽4𝐻𝐻_𝑆𝑖𝑧𝑒 + 𝛽5𝐻𝐻_𝑙𝑣𝑙𝑒𝑑𝑢𝑐 + 𝛽6𝐻𝐻_𝑃𝑟𝑖𝑜𝑐𝑐 +
𝛽7𝐻𝐻_𝐸𝑎𝑟𝑛𝑖𝑛𝑔 + 𝛽8𝐻𝐻_𝑚𝑒𝑚𝑒𝑎𝑟𝑛𝑖𝑛𝑔 + 𝛽9𝐻𝐻_𝑖𝑛𝑣𝑓𝑎𝑟𝑚 + 𝛽10𝐻𝐻_𝑓𝑎𝑟𝑚𝑠𝑖𝑧𝑒 + 𝛽11𝐻𝐻_𝑓𝑒𝑟𝑡𝑖𝑚𝑝 + 𝛽12𝐻𝐻_𝑒𝑥𝑝 +
𝛽13𝐻𝐻_𝑙𝑖𝑣𝑒𝑠𝑡𝑐𝑘 + 𝜇𝑖 ………Equation (6)
RESULTS AND DISCUSSIONS Socioeconomics of Respondents
Table 3 reveals finding on household heads socio-economic characteristics, Statistical evidence revealed that 88% of the total population were males, 12% females; average age in the study area was 42 years with highest
age bracket within (41 – 50) of 37%; majority of the
Table 2: Description of the variables in the model Variable Description Measurement A priori/Signs
Dependent
Yi Food Security Status of Household Binary - 1 food secure, 0 otherwise ≥1 or <1
Independent
HH_Age Household Head Age Number of years - Continuous +ve/-ve
HH_Gender Household Head Gender status Dummy - 1 male, 0 otherwise +ve
HH_Marital Household Head Marital Status Dummy - 1 married, 0 otherwise +ve
HH_Size Household Size Number - Continuous -ve
HH_lvleduc Household Head level Education Number of years spent- Continuous +ve
HH_PriOcc Household Head Primary Occupation Dummy – 1 educated, 0 otherwise +ve
HH_Earning Household Head Earning Naira/Dollar per month +ve
HH_memarning Household Members earning Naira/Dollar per month +ve
HH_Invlfrming Household Head Involve in farming Dummy - 1 farming, 0 otherwise +ve
HH_Farmsize Household Head Farm size Hectare - Continuous +ve
HH_Fertimp Household Fertilize improve Dummy -1 if improved, 0 otherwise +ve
HH_Expend Household Head Expenditure Naira/Dollar per month +ve
HH-Livestockown Household Head Livestock ownership Dummy - 1 livestock, 0 otherwise +ve/-ve
𝜇𝑖 represent error terms and 𝛽 is the vector of the parameter estimates.
while 41% were in core farming activities, 67% of the rural households engaged in agricultural activities as full time and part-time occupation. In term of household consumption, rice was the most preferred food consumed in the study area, while butter was the least consumed food item.
Table 3 also reveals the economic characteristic of the rural household heads, statistical evidence revealed that household monthly average expenditure was N86, 534 (US$283) with 61% of the total household heads within the range of N10, 000 – N100, 000 (US$33 – US$328) monthly expenditure group; household head average monthly income was N126, 120 (US$413) with majority of household earning within the range of N10, 000 – N100,
000 (US$33 –US$328) monthly income accounting for
about 61% of the rural household population.
Table 3: Socio-economic Profile of Household Heads
Factors Pooled (n = 326)
% mean Gender
Male 88
Female 12
Age (yrs) 42
19 - Below 0
20 - 30 16
31 - 40 30
41 - 50 37
51 - Above 17
Marital Status
Single 0
Married 90
Divorced 1
Widowed 9
Educational Qualification
Primary Certificate 17
SSCE/GCE 20
NCE/OND 35
Bsc/HND 26
Msc/PhD 2
Household Size 11
(1 - 5) 17
(6 - 10) 37
(11 - 15) 33
(16 -20) 10
(21 - Above) 3
Children under 18 yrs 56 6
Children in School 19 2
Adult above 18 yrs 44 5
Household Occupation
Private Sector 12
Public Sector 47
Farming/Agriculture 41
Household Classification
Farming Household 67
Non-Farming Household 33
Household Expenditure (N/$)/Monthly
10, 000 - 100, 000 61
(US$ 33 - US$ 328)
101, 000 - 200, 000 32
(US$331 - US$656)
201, 000 - 300, 000 0
(US$659 - US$984)
301, 000 – Above 7
(US$987 - Above)
Household Expenditure (N/$)/Monthly
Naira - Average 86,534.00
Table 3 Continue:
Household Income (N/$)/Monthly
10, 000 - 100, 000
(US$ 33 - US$ 328) 63
101, 000 - 200, 000
(US$331 - US$656) 26
201, 000 - 300, 000
(US$659 - US$984) 5
301, 000 - Above
(US$987 - Above) 6
Household Income (N/$)/Monthly
Naira - Average 126,120.00
Dollar - Average 413.00
Household Members' Income (N/$) Monthly
Naira - Average 20,115.00
Dollar - Average 66.00
Household Consumption (kg)/Monthly
Millet 8
Sorghum 6
Maize 11
Rice 21
Groundnut 6
Beans 7
Bread 4
Egg 6
Meat 11
Fish 5
Butter 0
Tea/Beverages 4
Fruits 5
Vegetables 6
Source: Field survey, 2018
US$ exchange at CBN prevailing rate of N305
Table 4 reveals farming household profile, statistical evidence revealed that average farming experience estimated at 36 years, 47% of which, possessed between
(11 – 20 years) experiences in agriculture. Household
heads have an average cultivable land of 3 hectares; land ownership indicated that majority about 64% possess their land through inheritance directly from the family; 91% has a farm size ranging from 1 – 10 hectares. Statistically evidence revealed that all farmers applied fertilizer, with an average of 1 kg per hectare of land; fertilizer classification also revealed that 48% usage was between 1 – 100 kg; farming household heads production in term of Naira/Dollar value indicated that 6% of the total production valued at an average of N63, 974 (US$210) were consumed annually, 91% of the total agricultural production valued at an average of N950, 000 (US$3,066) were sold annually, 2% of the farming production valued at an average of 21,355 (US$70) were used for seeding in the next farming season, while 1% with an average value of 21,709 (US$71) were used for donation.
Table 4: Farming Household Head - Socio-economic Profile
Factors Pooled (n = 217)
% Mean Farming Experiences 36
1 - 10yrs 12
11 - 20yrs 47
21 - 30yrs 28
31 - Above 13
Land Cultivated (ha) 3 Land Ownership Structure
Individual 25
Family 64
Community 2
Rented 9
Farm Size (ha)
1 -10 ha 98
11 -20 ha 2
21-30 ha 0
31- Above ha 0
Fertilizer Usage (kg)
Actual Usage (kg) 1
Fertilizer Classification (kg)
1 - 100kg 48
101 -200kg 36
201 - 300kg 14
301 - Above 2
Household Production (N/$)/Yearly Consumed 6
Naira - Average 63,974.00
Dollar - Average 210.00
Sales 91
Naira - Average 950,001.00
Dollar - Average 3,066.00
Seeds 2
Naira - Average 21,355.00
Dollar - Average 70.00
Donations 1
Naira - Average 21,709.00
Dollar - Average 71.00
Revenue -
Source: Field survey, 2018
US$ exchange at CBN prevailing rate of N305
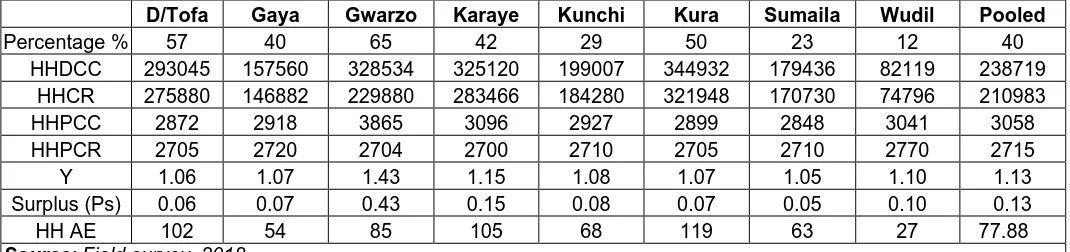
For instance, households in Dawakin Tofa has adult equivalent of 102 individuals under food secure comprising of 44 infants under the age of less than 6 years with assigned calorie intake of 1,160 kcal as per table: 2.1 - (0.3 – average consumption of individual ranging from 0 – 6 years - of 2,710 kcal), which will give a total calorie of 51,040 kcal, dividing the figure with 2,710 kcal will convert the total of 44 infants into a value equivalent of 19 adults, the same procedures is followed with total number of 36 children under the age of 7 years to 18 years (0.7 of 2,710), will give us 27 adult equivalents and with total adults of 56 give us the total of 102 adult equivalent (HH AE). AE multiply by the FAO recommended calorie intake of 2,710 will give us the total of Household calorie requirement (HHCR) which is 275,880. To obtain the Household per capita calorie consumption (HHPCC) in D/Tofa we divide the total of household daily calorie consumption (HHDCC)
with adult equivalent AE (293,045/102). To getting the household per capita calorie requirement (HHPCR), take the total household calorie requirement (HHCR) and divide by the adult equivalent (AE) the outcome become 2,705 kcal. Same calculations will be applied to obtain the result in pooled data in the area, under household daily calorie consumption (HHDCC), household calorie requirement (HHCR), household per capita daily calorie consumption (HHPCC) and household daily per capita calorie requirement (HHPCR).
Applying equation (1) into our pooled data will give us the overall food security status of households considered food secure (Y) and since the result is above the threshold of 1, by applying equation (4) we obtained a surplus index of 0.13 when converted into percentage it becomes 13%.
Table 5: Summary of Food Secure Households Based on Local Government Area
D/Tofa Gaya Gwarzo Karaye Kunchi Kura Sumaila Wudil Pooled
Percentage % 57 40 65 42 29 50 23 12 40
HHDCC 293045 157560 328534 325120 199007 344932 179436 82119 238719
HHCR 275880 146882 229880 283466 184280 321948 170730 74796 210983
HHPCC 2872 2918 3865 3096 2927 2899 2848 3041 3058
HHPCR 2705 2720 2704 2700 2710 2705 2710 2770 2715
Y 1.06 1.07 1.43 1.15 1.08 1.07 1.05 1.10 1.13
Surplus (Ps) 0.06 0.07 0.43 0.15 0.08 0.07 0.05 0.10 0.13
HH AE 102 54 85 105 68 119 63 27 77.88
Source: Field survey, 2018
Where HHDCC represent total households daily calorie consumption, HHCR represent total household daily calorie requirement, HHCR represent household daily per capita calorie consumption, HHCR represent household daily per capita calorie requirement, Y is the household food security status, Ps represent food surplus index and HH AE is the household adult equivalent.
Source: Computed from the field study, 2018.
Table 5 represented the food insecure households in the rural Kano, as indicated 60% of the total households were food insecure and pooled food security status (Y) revealed a figure of 0.4 indicating a food shortage of 0.6 from food security status threshold which represented a food severity of 60% among the rural food insecure households. Estimated 1,775 adult (AE) were faced with serious food security problem in the study area.
Table 6: Summary of Food Insecure Households Based on Local Government Area
D/Tofa Gaya Gwarzo Karaye Kunchi Kura Sumaila Wudil Pooled
Percentage % 43 60 35 58 71 50 77 88 60
HHDCC 140672 167432 206376 289698 273767 213705 252520 223115 220911
HHCR 441180 501350 317612 537664 877498 482380 814084 795114 595860
HHPCC 868 905 1764 1463 845 1201 842 767 1082
HHPCR 2723 2710 2715 2715 2708 2710 2714 2732 2716
Y 0.32 0.33 0.65 0.54 0.31 0.44 0.31 0.28 0.40
Shortfall (Pi) 0.68 0.67 0.35 0.46 0.69 0.56 0.69 0.72 0.60
HH AE 162 185 117 198 324 178 300 291 219.38
Where HHDCC represent total households daily calorie consumption, HHCR represent total household daily calorie requirement, HHCR represent household daily per capita calorie consumption, HHCR represent household daily per capita calorie requirement, Y is the household food security status, Ps represent food surplus index and HH AE is the household adult equivalent.
Table 7 indicated that overall 60% representing majority of the households in the study area were food insecure and with overall food security status (Y) threshold achievement of 0.60 we finalized that the area is food insecure. The shortfall/surplus indicating the severity or the extent of deviation from the line of food security or above it in Table 2.3 reported that households considered food secure surpass the daily calorie requirement by 13% while households considered food insecure, fall short of the daily calorie intake recommendation of 2,710 kcal by 60%.
Table 7: Summarized Food Security Indices (Pooled) in the Study Area
D/Tofa Gaya Gwarzo Karaye Kunchi Kura Sumaila Wudil Pooled
HHDCC 433717 324992 534910 614818 472774 558637 431956 305234 459630
HHCR 717060 648232 547492 821130 1061778 804328 984814 869910 806843
HHPCC 3740.35 3822.82 5629 4559.5 3771.53 4099.18 3689.92 3808.16 4140.06
HHPCR 5428.04 5430.04 5418.25 5415.15 5418.33 5415.45 5423.61 5502.57 5431.44
Y 0.60 0.50 0.98 0.75 0.45 0.69 0.44 0.35 0.60
Shortfall (Pi) 0.68 0.67 0.35 0.46 0.69 0.56 0.69 0.72 0.60
Surplus (Ps) 0.06 0.07 0.43 0.15 0.08 0.07 0.05 0.1 0.13
HH AE 264 239 202 303 392 297 363 318 297.26
Where HHDCC represent total households daily calorie consumption, HHCR represent total household daily calorie requirement, HHCR represent household daily per capita calorie consumption, HHCR represent household daily per capita calorie requirement, Y is the household food security status, Ps represent food surplus index and HH AE is the household adult equivalent.
Source: Computed from the field study, 2018.
Recent studies conducted in Africa revealed that about 60% - 70% of households especially in rural areas in the continent were insecure in term of food need, which also confirmed the finding of this research (Arene and Anyaeji,
2010; Omueme et al., 2012; Olayemi, 2012 and Orewa
and Iyangbe, 2013). Numerous scholars also adopted the food security index in assessing household security status in term of food in Africa, notable of which include,
Babatunde et al., (2007); Kuwornu et al., (2013) and
Onafeso et al., (2015).
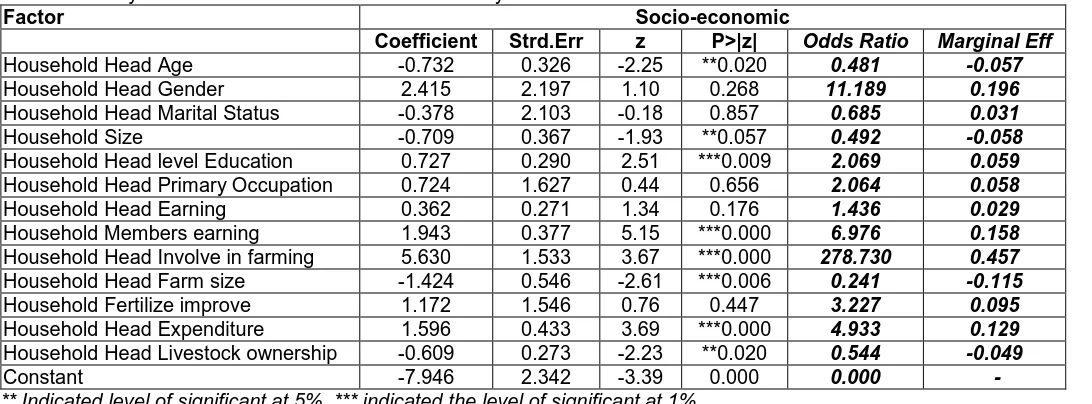
Factor Influencing Food Security Status
Binary regression analysis is presented in Table 8 with the food security status of rural households in mind, regression report revealed that out of the 16 independent variables, 3 variables were dropped due to low coefficients and odds ratio revealing their insignificant in the model, results from Table 4.6 also revealed that eight out of the remaining regressors were statistically significant in the model and describe the variation in regressand of rural households in the study area. These regressors include household head age, composition, level of education, members earning, involvement in farming activities, farm size, expenditure and livestock ownership while household head gender, marital status, primary occupation, total earning and fertilizer application possess high coefficient and odds ratio but statistically not significant.
Household head level of education: Household level of education has a direct and positive correlation with food security status of household. As expected odds ratio of 2.069 indicates an increase in household food status resulting from a slight change in the education level of household head’s qualification, thus the more the education qualification of rural household head, the higher
the tendency of food secure the household become. The variable is statistically significant at 1% and a probability of 6% chance. This outcome is in line with findings of Amaza
et al. (2009) and Jabo et al. (2016). However, Omotayo et al. (2018) discovered a negative coefficient in their study. Household members’ earning capacity: Household members’ earning has a positive coefficient of 1.943 indicating an increase food security status resulting from a unit increase in household members earning, the variable is statistically significant at 1%. The variable has a 16% probability chance. The studies of Bashir et al. (2010);
Gebre (2012) and that of Ahmed et al. (2016) also
established a positive coefficient between household members income and food security status of the household.
Household head involved in farming: the variable has a positive coefficient of 5.630 indicating a positive and strong relationship with household food security status, suggesting an increase in food security status of household as a result of unit change in household head involvement in farming activities which is according to the a priori expectation. The variable is significant at 1% and has 46% probability chance, which is also considered high. The finding is against the work of Ameh and Iheanancho,
(2017); Metu et al. (2016) and Ogundari (2017). However,
inline with works of Akinnifesi et al. (2007).
especially if such expenditure is incurred on foodstuffs directly consumed by household. The finding of Omotayo (2016) is in conflict with finding of the research, but inline with Babatunde et al. (2007).
Household head age: Variable indicated a negative coefficient -0.732 indicating a reduction in household food security status, meaning a unit change in household age, when other variables were held constant will result in a reduction in household food security status by 0.73 with a probability of 6% and statistically significant at 5% level. This means that as the age of the household head increase, the tendency of becoming food insecure increases. This finding is inline with the findings of Adeniyi and Ojo, (2013) and Asogwa and Umeh, (2012).
Household size: This variable indicated a negative coefficient of -0.709 indicating a reduction in the food security status of the household as a result of a unit change in household size, when other variables are held constant. Statistically significant at 5% and variable has a 6% probability chances. This finding is inline with the work of Gebre (2012) and Baltenweck and Staal (2007).
Household head ownership of livestock: Variable has a negative coefficient of -0.609 indicating a reduction in household food security status as a result of unit change in livestock ownership, which is also contrary to the a priori expectation, this mighty be as a result of excess pressure exacted by the livestock inform of feeding and other activities directed to the livestock, before being put to use or sales as the case may be, the variable has a probability estimated at 1% and statistically significant at 5%.
Omotayo et al. (2016) and Delvaux and Paloma, (2017) all
discovered a negative coefficient in their work.
Household head farm size: Indicated a negative coefficient of -1.424 suggesting a reduction in food security status of household as a result of unit change of household head farmsize, which is contrary to the expectation, this could be as a result of inefficiently used of farmland and over exploitation of the farmland. The variable is statistically significant at 1% and 12% probability chances. This is inline with the work of Olomola and Gyimah-Brempong, (2014) and Harris and Orr (2014); however, against the finding of Jabo et al. (2016).
Table 8: Binary Determinants of Household food security status
Factor Socio-economic
Coefficient Strd.Err z P>|z| Odds Ratio Marginal Eff
Household Head Age -0.732 0.326 -2.25 **0.020 0.481 -0.057
Household Head Gender 2.415 2.197 1.10 0.268 11.189 0.196
Household Head Marital Status -0.378 2.103 -0.18 0.857 0.685 0.031
Household Size -0.709 0.367 -1.93 **0.057 0.492 -0.058
Household Head level Education 0.727 0.290 2.51 ***0.009 2.069 0.059
Household Head Primary Occupation 0.724 1.627 0.44 0.656 2.064 0.058
Household Head Earning 0.362 0.271 1.34 0.176 1.436 0.029
Household Members earning 1.943 0.377 5.15 ***0.000 6.976 0.158
Household Head Involve in farming 5.630 1.533 3.67 ***0.000 278.730 0.457
Household Head Farm size -1.424 0.546 -2.61 ***0.006 0.241 -0.115
Household Fertilize improve 1.172 1.546 0.76 0.447 3.227 0.095
Household Head Expenditure 1.596 0.433 3.69 ***0.000 4.933 0.129
Household Head Livestock ownership -0.609 0.273 -2.23 **0.020 0.544 -0.049
Constant -7.946 2.342 -3.39 0.000 0.000 -
** Indicated level of significant at 5%, *** indicated the level of significant at 1%
Other variables: Variables like gender, has a positive coefficient indicating an increase in household food security status, when the household is headed by male then female, however statistically insignificant, the probability chance was estimated at 20%; marital status of the household head has negative coefficient indicating an inverse relationship with food security status of household, this may be as a result of high number of spouses that the household head married, which subsequently resulted in high household size The probability chance has been estimated at 3%; household primary occupation as expected has a positive coefficient but statistically insignificant, with 6% probability chance and household head total monthly earning even though has positive coefficient but statistically insignificant and 3% probability chances of occurring.
CONCLUSIONS AND POLICY RECOMMENDATIONS
The paper has presented the important determinants that
affect rural households’ food security status in Kano,
Nigeria. Statistical evidence revealed that eight out of thirteen (13) variables were important determinants among rural households which, include household head age, education, involvement in farming, farm size, expenditure,
livestock ownership, household composition and
monthly income of N126, 120 (US$413), this translated into daily household head income of N4, 204 (US14), with a total household adult equivalent of 2,378 individuals in the study area, it will translate into N17, 289.79 (US$56.69) individually monthly and N576.32 (US$1.89) daily, marginally above the US$1.45 estimated poverty line. Other household members’ income averaging N20, 115 (US$66) will result in adding little to the household food security status. Statistical evidence also revealed that monthly average expenditure of the household was N86, 534 (US$283), this translated into N291.12 (US$1) per individual in the study area on monthly basis.
Outcome of food security indices could be regarded as a fair representation of the household’s food status in the Kano, Nigeria. Therefore it could serve as a reference point in measuring food security in Nigeria in general and in Northwest region in particular especially against background of various agricultural policies to be implemented by the present administration that seems to focus more on farming with ultimate aim of reducing hunger in the country. It is therefore suggested that identified lapses should go along with new policies to be implemented in reducing the food security challenges especially among rural households.
Agricultural inputs should be provided at a very low cost, timely and free from any form of corruption as well as meeting the required standard in term of quantity and quality, the outcome of which would be high yield. On the supply side, the government should proactively engage in providing adequate storage facilities to reduce the problem of postharvest losses, good road networks, electricity etc all of which can result in additional economic activities that can subsequently resulted in extra income for rural household head and household members.
Health education and environmental cleaning have to take the center stage in a rural area, especially among the household head’s spouses, a method of food preservation need to improve, to reduce malnutrition among the rural household and food waste in Kano, Nigeria. Lastly government should come up with campaign and sensitization in the local media and door-to-door education on child birth control, this could reduce the high number of household size in the study area.
REFERENCES
Adeniyi, O. R., & Ojo, O. A. (2013). Food security status of rural farming households in Iwo, Ayedire and Ayedaade local government areas of Osun State, South-Western Nigeria. African Journal of Food, Agriculture, Nutrition and Development, 13(5), 8209-8223.
Ahmed, U. I., Ying, L., Bashir, M. K., Abid, M., Elahi, E., & Iqbal, M. A. (2016). Access to output market by small farmers: The case of Punjab, Pakistan. Journal of Animal and Plant Sciences, 26(3), 2016.
Amaza, P., Abdoulaye, T., Kwaghe, P., & Tegbaru, A. (2009). Changes in household food security and poverty status in PROSAB area of Southern Borno State, Nigeria. International Institute of Tropical Agriculture (IITA) Promoting Sustainable Agriculture in Borno State (PROSAB). IITA, Nigeria.
Akinnifesi F.K., Makumba W., Sileshi G., Ajayi O., Mweta D., (2007). Synergistic effect of inorganic N and P fertilizers and organic inputs from Gliricidia sepium on productivity of intercropped maize in Southern Malawi. Plant Soil. 294, 203–217.
Ameh, M., & Andrew, C. (2017). Socio-Economic Factors Influencing Agricultural Loan Acquisition among Small-Scale Rice Farmers in Benue State, Nigeria.
Arene, C. J., & Anyaeji, R. C. (2010). Determinants of food security among households in Nsukka Metropolis of Enugu State, Nigeria. Pakistan Journal of Social Sciences, 30(1), 9-16.
Asghar Zahid, Ahmed Muhammad, (2013).
Socio-Economic Determinants of Household Food
Insecurity in Pakistan.
Asogwa, B. C., & Umeh, J. C. (2012, December). Food insecurity determinants among rural farm households in Nigeria. In International conference on Ecology, Agriculture and Chemical Engineering (ICEACS‟ 2012) December (pp. 18-19).
Babatunde, R. O., Omotesho, O. A., & Sholotan, O. S. (2007). Socio-economic characteristics and food security status of farming households in Kwara State,
North-Central Nigeria. Pakistan Journal of
Nutrition, 6(1), 49-58.
Baltenweck, I., & Staal, S. (2007). Beyond One‐Size‐Fits‐ All: Differentiating Market Access Measures for Commodity Systems in the Kenyan Highlands. Journal of Agricultural Economics, 58(3), 536-548.
Barrett, C.B., and Lentz, E.C. (2009). “Food Insecurity.” In The International Studies Compendium Project. Oxford, UK: Wiley-Blackwell Publishing.
Bashir, M. K., Naeem, M. K., & Niazi, S. A. K. (2010). Rural and peri-urban food security: a case of district Faisalabad of Pakistan. World Applied Sciences Journal, 9(4), 403-411.
Bashir, M.K., Schilizzi, S., Pandit, R., (2013a). Impact of socio-economic characteristics of rural households on food security: the case of the Punjab, Pakistan. JAPS, J. Animal Plant Sci. 23 (2), 611–618.
Bashir, M.K., Schilizzi, S., Pandit, Ram, (2013b). Regional sensitivity of rural household food security: the case of Punjab, Pakistan. JAPS, J. Animal Plant Sci. 23 (4), 1200–1206.
Bogale, Ayalneh, (2012). Vulnerability of smallholder rural households to food insecurity in Eastern Ethiopia. Food Security 4 (4), 581–591.
Dercon, S., & Pramila, K. (1998). Changes in poverty in rural Ethiopia 1989-1995: Measurement, robustness tests and decomposition.
Ehebhamen, O. G., Obayelu, A. E., Vaughan, I. O., & Afolabi, W. A. O. (2017). Rural households' food security status and coping strategies in Edo State Nigeria. International Food Research Journal, 24(1). Ejikeme, J. O., Ojiako, J. C., Onwuzuligbo, C. U., & Ezeh,
F. C. (2017). Enhancing Food Security in Anambra
State, Nigeria Using Remote Sensing
Data. Environmental Review, 6(1).
Gebre, G. G. (2012). Determinants of food insecurity
among households in Addis Ababa city,
Ethiopia. Interdisciplinary Description of Complex Systems: INDECS, 10(2), 159-173.
FAO, (1996). The State of Food and Agriculture 1996. Rome: FAO.
FAO, (2013). The state of food insecurity in the world 2012. Economic Growth is necessary but not sufficient to Accelerate Reduction of Hunger and Malnutrition. FAO, Rome, Italy, 1-61.
FAO, (2015). Achieving Zero Hunger: The Critical Role of Investments in Social Protection and Agriculture. https://doi.org/I4951
FAO, (2016). The State of Food Insecurity in the World 2015. Meeting the 2015 international hunger targets: taking stock of uneven progress. Food and Agriculture Organization Publications, Rome.
Fawole, W. O., Ozkan, B., & Ayanrinde, F. A. (2016). Measuring food security status among households in Osun State, Nigeria. British Food Journal, 118(7), 1554-1567.
Felker-Kantor, Erica, Wood, Charles H., (2012).
Female-headed households and food insecurity in
Brazil. Food Security 4 (4), 607–617.
Food and Agriculture Organization of the United Nations. (2017). State of food security and nutrition in the world 2017 (chinese edition): building Resilience For... Peace and Food Security. FOOD & AGRICULTURE ORG. Gross, R., Schoeneberger, H., Pfeifer, H., & Preuss, H. J.
(2000). The four dimensions of food and nutrition security: definitions and concepts. SCN News, 20, 20-25.
Gross, R., Schultink, W., & Sastroamidjojo, S. (1996). Stunting as an indicator for health and wealth: an Indonesian application. Nutrition research, 16(11-12), 1829-1837.
Harris, D., & Orr, A. (2014). Is rainfed agriculture really a pathway from poverty?. Agricultural Systems, 123, 84-96.
Jabo, M. S. M., Ismail, M. M., Abdullah, A. M., & Shamsudin, M. N. (2017). Measurement and determinants of rural food poverty in Nigeria: recent
evidence from general household survey
panel. International Food Research Journal, 24(3), 1011.
Kassie, M., Ndiritu, S.W., Stage, J., (2014). What determines gender inequality in household food
security in Kenya? Application of exogenous switching treatment regression. World Dev. 56, 153–171. Korir, L., Rizov, M., & Ruto, E. (2018, April). Analysis of
household food demand and its implications on food security in Kenya: an application of QUAIDS model. In 92nd Annual Conference, April 16-18, 2018, Warwick University, Coventry, UK (No. 273474). Agricultural Economics Society.
Kuwornu, J. K., Mensah-Bonsu, A., & Ibrahim, H. (2011). Analysis of foodstuff price volatility in Ghana: Implications for food security. European Journal of Business and Management, 3(4), 100-118.
Kuwornu, J. K., Suleyman, D. M., & Amegashie, D. P. (2013). Comparative Analysis of Food Security Status of Farming Households in the Coastal and the Forest Communities of Central Region of Ghana. Asian Journal of Empirical Research, 3(1), 39-61.
Mango, N., Zamasiya, B., Makate, C., Nyikahadzoi, K.,
Siziba, S., (2014). Factors influencing household
food security among smallholder farmers in the Mudzi district of Zimbabwe. Dev. Southern Africa 31 (4), 625– 640.
Maxwell, S. (1996). Food security: a post-modern perspective. Food policy, 21(2), 155-170.
Maxwell, S., & Smith, M. (1992). Household food security: a conceptual review. Household Food Security: concepts, indicators, measurements. Edited by S. Maxwell and T. Frankenberger. Rome and New York: IFAD and UNICEF.
Metu, A. G., Okeyika, K. O., & Maduka, O. D. (2016). Achieving sustainable food security in Nigeria: Challenges and way forward.
Muche, M., Endalew, B. and Koricho, T. (2014), “Determinants of household food security among Southwest Ethiopia rural households”, Food Science and Technology, Vol. 2 No. 7, pp. 93-100.
Ogundari, K. (2017). Categorizing households into different food security states in Nigeria: the socio-economic and demographic determinants. Agricultural and Food Economics, 5(1), 8.
Oguntona, E. B., & Akinyele, I. O. (1995). Nutrient composition of commonly eaten foods in Nigeria-Raw, processed and prepared.
Okpokiri, C. I., Agwu, N. M., & Onwukwe, F. O. (2017). Assessment of food security status of farming households in Abia State, Nigeria. Nigeria Agricultural Journal, 48(2), 93-98.
Olomola, A. and Gyimah-Brempong, K. (2014). Loan Demand and Rationing among Small- Scale Farmers in Nigeria. International Food Policy Research Institute (IFPRI), Abuja, Nigeria.
Olayemi, A. O. (2012). Effects of family size on household food security in Osun State, Nigeria. Asian journal of agriculture and rural development, 2(2), 136.
Omotayo, A. O., Ogunniyi, A. I., Tchereni, B. H., & Nkonki-Mandleni, B. (2018). Understanding the Link Between Households' Poverty and Food Security in South West Nigeria. The Journal of Developing Areas, 52(3), 27-38.
Onafeso, O. D., Akanni, C. O., & Badejo, B. A. (2015). Climate Change Dynamics and Imperatives for Food
Security in Nigeria. Indonesian Journal of
Geography, 47(2), 151-159.
Orewa SI, Iyangbe CO (2009). The food insecurity profile among the rural and low income urban dwellers in Nigeria. Am Euras J Sci Res 2009;4:302-7.
Owusu, V., Abdulai, A., Abdul-Rahman, S., (2011). Non-farm work and food security among Non-farm households in Northern Ghana. Food Policy 36 (2), 108–118. Oyekale, T. O., Ayegbokiki, A. O., & Adebayo, T. Y. (2017).
Analysis of rural households’food security status in ogun state, nigeria. Journal of Agribusiness and Rural Development, (1 (43)), 163-174.
Saxena, N. C. (2018). Hunger, under-nutrition and food security in India. In Poverty, Chronic Poverty and Poverty Dynamics (pp. 55-92). Springer, Singapore. Schmidhuber, J., Sur, P., Fay, K., Huntley, B., Salama, J.,
Lee, A. ...& Afshin, A. (2018). The Global Nutrient
Database: availability of macronutrients and
micronutrients in 195 countries from 1980 to 2013. The Lancet Planetary Health, 2(8), e353-e368.
Solaymani, S. (2018). Impacts of climate change on food
security and agriculture sector in Malaysia.
Environment, Development and Sustainability, 20(4), 1575-1596.
UNDP (2017a). Table 1: Human Development Index and its Components. Available at: http://hdr.undp.org/en/ composite/HDI.
USDA, N. (2005). The PLANTS Database, Version 3.5 (http://plants. usda. gov). Data compiled from various sources by Mark W. Skinner. National Plant Data Center, Baton Rouge, LA, 70874-4490.
Von Grebmer, K., Bernstein, J., de Waal, A., Prasai, N., Yin, S., & Yohannes, Y. (2015). 2015 Global hunger index: armed conflict and the challenge of hunger. Intl Food Policy Res Inst.
World Bank, (1986); World Bank; Poverty and Hunger: Issues and Options for Food Security in Developing Countries. World Bank, Washington (1986).
Accepted 4 October 2018
Citation: Mustapha M, Kamaruddin RB, Dewi S (2018). Assessing the Food Security Determinants among Rural Households in Kano, Nigeria. Journal of Agricultural Economics and Rural Development, 4(2): 501-512.
Copyright: © 2018 Mustapha et al. This is an open-access article distributed under the terms of the Creative Commons Attribution License, which permits unrestricted use, distribution, and reproduction in any medium, provided the original author and source are cited.
APPENDIX
Appendix 1: common food items eaten
Food items Kcal/kg Food items Kcal/Kg
Staple food Fruits
Cassava Flour 3870 Plantain 770
Gari 3840 Banana 960
Soy flour 2600 Pineapple 320
Wheat Grain 3400 Apple 570
Cowpea (Beans) 5920 Coconut 580
Sweet Potato Tuber 1000 Guava 730
Maize Grain 4120 Sugarcane 360
Maize Flour 3500 Mango 590
Sorghum Grain 3500 Pawpaw 300
Millet Grain 3500
Meats & Animal
prod
Groundnuts 5950 Cow Meat 2370
Vegetables Chicken 2380
Okro 4500 Fish 2230
Tomato 880 Eggs
(pieces) 1400
Pepper 3930 Drinks
Onion 440 Soft drink 620
Egg plants 440 Orange
Juice 400 Cucumber 270 Apple Juice 550 Pumpkin 440 Pineapple 560
Beverages Dairy
Products
Cocoa 1200 Milk 4900
Tea 1200 Cheese 4000
Coffee 4100 Yoghurt 4100
Source: Babatunde et al., 2007.
Appendix 2: Adults equivalent for adjusting
household size
Age category in (years) Male Female
0-1 0.33 0.33
1-2 0.46 0.46
2-3 0.54 0.54
3-5 0.62 0.62
5-7 0.74 0.70
7-10 0.84 0.72
10-12 0.88 0.78
12-14 0.96 0.84
14-16 1.06 0.86
16-18 1-14 0.86
18-30 1.04 0.80
30-60 1.00 0.82
>60 0.84 0.74