Research Notes
Genetic divergence in land races of rice
T.Rajesh, K.Paramasivam and S.Thirumeni
Abstract
Genetic diversity was assessed in 29 land races of rice using Mahalanobis’sD2 statistics. Eight quantitative characters including grain yield were considered for the study. Based on genetic distances, the 29 genotypes were grouped into five clusters. The mode of distribution of genotypes from different geographic regions into various clusters was at random indicating that geographical diversity and genetic diversity were not related .The characters days to first flowering and single plant yield contributed maximum towards genetic divergence. The maximum inter cluster distance was recorded between cluster IV and cluster V. The genotypes in these clusters
Vattan and Vellai Chitraikar (cluster IV) and Thulasi Manjari (cluster V) may serve as potential donors for
future hybridization programmes.
Key words:
Land races, Genetic divergence, D2 analysis
Rice (Oryza sativa.L) the prime, most essential and important food crop of the world is also popularly called as ‘Global grain’ . Land races plays an important role in the local food security and sustainable development in agriculture (Tang et al.,2002). The major objective in rice breeding programme is to maintain the desirable traits with an increase in the yield potential of these land races. Genetic improvement mainly depends on the amount of genetic variability present in the population. The estimation of genetic diversity between different genotypes in the crop of interest is the first and foremost process in any plant breeding programme. However assessment of genetic diversity of rice land
analysis, all genotypes were grouped into five different clusters (Table 3). Cluster I has largest with 15 genotypes followed by cluster III and cluster II having 7 and 4 genotypes respectively .Cluster IV and V have lesser number of genotypes with 2 and one respectively. The clustering pattern showed that genotypes collected from the same geotropic region got distributed in several clusters. It might be due to selection differential and or genetic drift under diverse environmental condition within same geographical regions. This pattern of clustering further indicated that there was no association between geographical distribution of genotypes and genetic divergence .Similar findings was also reported by Murty and Arunachalam (1996), Selvakumar et al. (1989) and Vivekanandan and Subramanian(1993).
Maximum intra cluster distance was observed between the genotypes viz., Pant Kalanamak 3131, Patnai 23, Cherthallai Pokkali, Ponnarayan , Red
Thriveni, Sivappu Chitraikar and Vellaikurikar in
cluster III indicating the existence of wide genetic divergence among the constituent genotypes in it. High degree of divergence among the genotypes within a cluster produces more segregating breeding materials. Selection within such clusters might be executed based on maximum mean value for the desirable characters. On the other hand ,cluster I had minimum intra cluster distance with more than one genotype, indicating the unidirectional selection which might have been practical in the past that could lead to uniformity with less deviation between the genotypes.
The intra cluster distance ranged from 22.75 (Cluster I) to 28.35(Cluster III). The highest inter cluster distance was observed between the clusters IV and V (49.04) followed by between cluster II and V (41.69). The least distance was recorded between the cluster III and IV (30.01) (Table 4). Thus hybridization between genotypes under the highly divergent clusters should result in maximum hybrid vigour and
highest numbers of useful segregants for the trait studied.
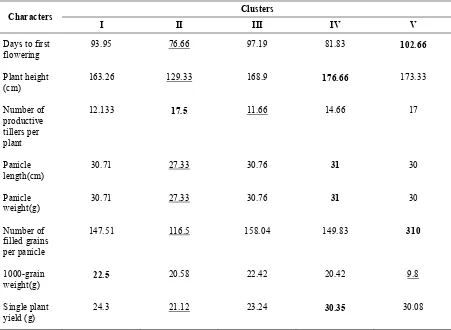
The contribution of different character to that of total divergence was estimated based on ranking system (Table 5). Among the traits, days to first flowering has contributed maximum (25.61 per cent) to the total divergence followed by single plant yield (25.12 per cent). The comparison of cluster means (Table 6) revealed that cluster IV recorded high mean values for four traits followed by cluster V .The cluster II had the minimum value for all the traits except for 1000-grain weight which indicates less genetic diversity among the genotypes. The present study suggested that hybridization among genotypes in the diverse Vattan and Vellai Chitraikar (cluster IV) and Thulasi Manjari (cluster V) could give high heterotic combinations and thus produced large variability and better segregates in the segregating generations.
References
Mahalanobis, P. C. 1928. A statistical study at Chinese head measurement. J. Asiatic Soc.Bengal., 25: 301-317.
Murty, B. R. and V. Arunachalam. 1996. The nature of genetic divergence in relation to breeding system in some crop plants. Indian J. Genet., 26: 188-198. Rao, C. R. 1952. Advanced statistical methods in
biometrical research. John Wiley and Sons. Inc., New York, 390 pp.
Selvakumar, K. S., G. Saundrapandian and A. Amirthadevarathinam. 1989. Genetic divergence for yield and yield components in cold tolerant rice. Madras Agric. J., 76: 688-694.
Tang, S. X., Y. Z. Jiang, X. H. Wei, Z. C. Li and H. Y. Yu. 2002. Genetic diversity of isozymes of cultivated rice in china. Acta Agron. Sin., 28: 203-207.
Table 1. Origin and mean perforamance of land races of rice for various characters
Genotypes Origin
Days to first flowering
Plant height (cm)
No.of productive
tillers/ plant
Panicle length
(cm)
Panicle weight
(g)
No. of filled grains / panicle
1000- grain weight
(g)
Single plant yield (g)
Orumanayoor
Anakkodan Kerala 91 183 9 33.66* 4.41 129 20.95 19.29
Vytilla
Anakkodan Kerala 91 181 11 31.33 4.91* 150 30.28* 28.52*
Chettivirippu Kerala 93 179 7 32.00* 4.73* 140 30.06* 16.85
Chettivirippu
Kannamalai Kerala 93 171 8 31.66* 4.78* 141 30.04* 17.93
Chithyankottai Tamil Nadu 86* 171 11 33.66* 5.81* 239* 20.33 39.90*
Chitteani Kerala 96 173 11 34.33* 5.61* 172* 20.97 26.35
Gopalbhag Bangladesh 104 148* 11 27.33 4.12 236* 10.68 20.14
Pokkali Kerala 94 195 10 31.33 5.83* 145 30.08* 23.11
Jodumani Kerala 89* 166 14 27 4.61* 125 20.85 23.97
Kadamakudy
Pokkali Kerala 88* 167 7 35.33* 5.33* 159 20.79 24.28
Kethanur Kerala 105 170 17* 24.66 3.67 115 20.91 26.32
Koorgood Kerala 86* 162 14 37* 3.71 108 20.42 26.95
Kuzhavazhai Tamil Nadu 105 100* 17* 24.66 2.58 116 10.87 25.36
Vettaikaraniruppu
Kulivedichan Tamil Nadu 94 109* 25* 25 2.18 98 20.1 24.57
Vedaranyam
Kulivedichan Tamil Nadu 68* 126* 24* 25.33 2.07 85 20.82 28.56*
Njavara Kerala 74* 98* 22* 26 2.39 140 10.5 18.57
Pallipuram
Pokkali Kerala 94 176 7 32* 4.70* 157 30.08* 16.57
Pant kalanamak3131
Uttar
Pradesh 103 168 13 33.33* 3.64 244* 10.39 21.1
Patnai 23 Kerala 114 175 14 27 3.99 151 20.84 23.19
Cherthallai
Pokkali Kerala 87* 176 7 34.33* 4.38 140 30.03* 19.52
Edavanakad
Pokkali Kerala 95 175 10 31.66* 4.93* 141 30.12* 20.97
Ponnararyan Kerala 88* 159 7 35.33* 4.76* 173* 30.02* 19.69
Red Thriveni Kerala 76* 168 8 32.66* 4.64* 180* 20.89 19.6
Table 2. Analysis of variance for different characters
Source Replication Genotypes Error
Degrees of freedom 2 28 56
Mean sum of squares
Days to first flowering 0.011 388.22** 0.86
Plant height (cm) 51.35 1961.29** 13.07
Number of productive tillers per plant 2.31 82.07** 2.45
Panicle length (cm) 1.25 44.18** 0.65
Panicle weight (g) 0.05 3.64** 0.09
Number of filled grains/ Panicle 61.39 8123.58** 28.188
1000- grain weight (g) 1.00 124.622** 3.93
Single plant yield (g) 7.64 101.30** 4.288
** Significant at 1 per cent level
Table 3. Distribution of genotypes to different clusters based on Tocher’s method
Cluster number
Total number of
genotypes Genotypes Origin
Orumanayoor Anakkodan Kerala
Vytilla Anakkodan Kerala
Chettivirippu Kerala
Chettivirippu Kannamalai Kerala
Chithyankottai Tamil Nadu
Chitteani Kerala
Gopalbhag Bangladesh
Pokkali Kerala
Jodumani Tamil Nadu
Kadamakudy Pokkali Kerala
Kethanur Kerala
Koorgood Kerala
Kuzhavazhai Tamil Nadu
VettaikaraniruppuKulivedichan Tamil Nadu
I 15
Edavanakad Pokkali Kerala
Vedaranyam Kulivedichan Tamil Nadu
Njavara Kerala
Pallipuram Pokkali Kerala
II 4
Sivappu Koompalai Tamil Nadu
Pant Kalanamak 3131 Uttar Pradesh
Patnai 23 West Bengal
Cherthallai Pokkali Kerala
Ponnararyan Kerala
Red Thriveni Kerala
Sivapu Chitraikar Tamil Nadu
III 7
Vellaikurikar Tamil Nadu
Vattan Kerala
IV 2
Vellai Chitraikar Tamil Nadu
Table 4. Average intra (diagonal ) and inter cluster D2 Values
Cluster No I II III IV V
I 517.782
(22.75)
1070.701 (32.72)
615.004 (24.79)
652.144 (25.53)
1738.195 (41.69)
II 794.239
(28.18)
1399.443 (37.40)
713.264 (26.70)
3278.139 (57.25)
III 803.849
(28.35)
900.833 (30.01)
1527.549 (39.08)
IV 564.994
(23.77)
2405.027 (49.04)
V 0.000
(0.00)
D Values are in parenthesis
Table 5. Contribution of characters towards genetic divergence
Characters Times ranked first Contribution
(Per cent)
Days to first flowering 104 25.61
Plant height (cm) 47 11.57
Number of productive tillers per plant 12 2.95
Panicle length (cm) 23 5.66
Panicle weight (g) 3 0.73
Number of filled grains per panicle 67 16.50
1000- grain weight (g) 48 11.82
Table 6. Cluster means for different traits
Clusters Characters
I II III IV V
Days to first flowering
93.95 76.66 97.19 81.83 102.66
Plant height (cm)
163.26 129.33 168.9 176.66 173.33
Number of productive tillers per plant
12.133 17.5 11.66 14.66 17
Panicle length(cm)
30.71 27.33 30.76 31 30
Panicle weight(g)
30.71 27.33 30.76 31 30
Number of filled grains per panicle
147.51 116.5 158.04 149.83 310
1000-grain weight(g)
22.5 20.58 22.42 20.42 9.8
Single plant yield (g)
24.3 21.12 23.24 30.35 30.08