www.ijaer.in Copyright © IJAER 2016, All right reserved Page 1777
FARMERS’ USE AND PERCEPTION OF
AGRI-ENVIRONMENTAL
PROGRAM IMPLEMENTED IN EREGLI REED BED AREA OF KONYA
PROVINCE TURKEY
Ismet BOZ
Professor, Ondokuz Mayis University Faculty of Agriculture Department of Agricultural Economics
Samsun/TURKEY
ABSTRACT
The aim of this paper was to determine farmers’ use and perceptions of different sustainable agricultural practices promoted through an agri-environment program schemed for Eregli Reed Bed Area of Konya province, one of the environmentally sensitive areas of Turkey. The study also aimed to compare adopters and non-adopters of the program in terms of applying the promoted and non-promoted sustainable agricultural practices, their perception of the program, and information sources of the program and different farming practices. Data were collected by administering a questionnaire to all of the adopters (141 farmers) and a stratified sample of 58 non-adopters. Chi-square test of independence was used for data analyses. Results of the study showed that adopter farmers significantly differed from non-adopter farmers in applying promoted sustainable agricultural practices which were crop rotation, growing legume crops, using modern irrigation systems, using animal manure, taking adequate measures for soil erosion, and taking adequate measures to protect pastures and preventing overgrazing. These findings showed that promotions have influence on adoption of environmental programs in the region.
Keywords: Sustainable agriculture, Sustainability, Environment, Adoption, Perception
1. INTRODUCTION
www.ijaer.in Copyright © IJAER 2016, All right reserved Page 1778 on-site and in a regional context (Jennings and Reganold, 1991). Although ESAs schemes seem not to have quite long background in Turkey, their history in Europe goes back to 1987 with the purpose of protecting the landscape, wildlife and historic interest of specific areas of England which are of national environmental significance, where changes in farming methods posed to threat to the environment and where conservation depended on adopting, maintaining or extending particular farming methods (Carey et al, 2005). Later on ESA schemes have been implemented in many different European Union (EU) countries (Wilson, 1997).
Overall, ESAs schemes encourage farmers to adopt scientifically determined beneficial agricultural practices which serve to maintain and enhance landscape, and protect wildlife and historic value of specified areas. Although the above statement can be the common purpose of ESAs schemes, each individual ESA has specific agro-environmental objectives (Lobley and Potter, 1998). They operate on a landscape scale with certain boundaries where long term measurements to protect and sustainable use of agricultural and natural resources, as well as historical and cultural values are predetermined. Farmers’ participation on ESAs schemes is on a voluntary basis and promotions or subsidies are provided for those who accept to adopt the specified farming practices and make a contract with relevant authorities (Lobley and Potter, 1998; Jennings and Reganold, 199; Hodge et al., 1992).
Eregli Reed Bed Area is one of the environmentally sensitive areas (ESA) for which specific agri-environmental programs were developed in Turkey. The first program was initiated by the Ministry of Agriculture and Rural Affairs in 2006 and named as Environment Friendly Agricultural Land Protection (EFALP) program (CATAK-in Turkish). It was included various practices to provide long term sustainable use of natural resources and the environment in ESAs (Boz, 2016; Ataseven, 2014; Olhan et al., 2010). In the seventh article of the regulation passed by the Council of Ministers (2009/3), the promoted farming practices determined by the Ministry of Food Agriculture and Livestock were divided in two categories. The first one required no tillage applications in environmentally less advantaged farm land in addition with soil and water protective and erosion preventive measures such as embankment, screening, stone collection, drainage, mulching, applying farm manure, overgrazing prevention, and coverage by perennial grains and forage legumes (with the exception of alfalfa). The second category included environment friendly agricultural practices and cultural measures. These were divided in three subsections; use of modern irrigation techniques (particularly drip and sprinkler irrigation technologies), controlled use of pesticides and fertilizers, and applying organic farming and/or good agricultural practices (Official Gazette, 2009).
www.ijaer.in Copyright © IJAER 2016, All right reserved Page 1779 commissions work throughout the geographic conditions, agricultural potential, and socioeconomic characteristics of the region, and determine the certain boundaries of the landscape where the program must be implemented. Depending on agricultural systems applied in different regions, each of the provincial and district program implementation teams are included a certain number of agronomists, agricultural engineers, horticulturists, and agricultural technicians. These are given training in advance. Training subjects are determined considering the landscape, climate, crops, livestock, farming infrastructure, and potential rural livelihoods in the region. Specific duties and responsibilities given to the program implementation teams are to follow program oriented legislation and regulations released by the ministry, to teach specific farming practices and provide extension services covered by the program, to keep program records related to farming activities, and to monitor and evaluate the overall program.
Overall purpose of this study was to determine farmers’ use and perceptions of the EFALP program implemented in Eregli Reed Bed area of Konya province, one of the environmentally sensitive areas in Turkey. The specific objectives were to compare adopters and non-adopters in terms of (1) promoted sustainable agricultural practices, (2) non-promoted sustainable agriculture practices, (3) their perceptions about the EFALP program, and (4) their sources of information about sustainable agricultural practices and whether or not they have adequate knowledge and information about these practices.
2. RESEARCH METHODS
Target population of this research was defined as farmers operating in six villages of Eregli district. In order to draw accurate samples to represent this population the following procedures were applied: First the EFALP program implementation area was determined and villages of Adabag, Sazgecit, Kargaci, Tatlikuyu, Alhan, and Tasagil were selected as research area. A list of 141 farmers who enrolled in the program since 2008 were obtained from the district directorate of Ministry of Food Agriculture and Livestock. Because it was possible to conduct research with all of these farmers no sampling technique was employed for this group of farmers. However, the number of farmers who weren’t enrolled in the program from these villages was quite large and employing a sampling procedure was inevitable. Therefore, Yamane (2001)’s stratified sampling technique based on total operational land of each farmer was used to draw an accurate sample size and it was calculated as 58. More detailed information about the sampling procedure can be found at Boz et all., 2011, and Boz and Akbay, 2005.
www.ijaer.in Copyright © IJAER 2016, All right reserved Page 1780 questionnaire. It was included questions about promoted and un-promoted sustainable agricultural practices, farmers’ sources of information on environmental programs and different agricultural practices. Validity of the instrument was established by a panel of experts. Reliability was established by conducting pre-test with 10 farmers. Slight amendments were made in the questions which were difficult to understand by the respondents. These questionnaires weren’t included in the data base of the study. Data were collected in January-March 2013 period.
Because most of the questions were asked in categories, Chi-square test of independence was used for data analyses. For this purpose, Chi-square tests were performed to find out if significant associations existed between the variable adoption and each of the other explanatory variables. An Alpha level of 0.05 was used to test these analyses.
3. ANALYSIS RESULTS
3.1. Comparison of Adopter Categories in terms of Sustainable Agriculture
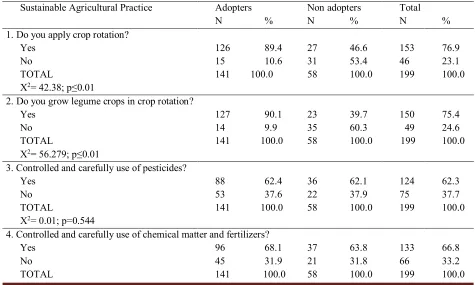
Results of chi-square tests performed for promoted sustainable agricultural practices are presented in Table 1. Among the eight practices five were found statistically significant at 0.05 Alpha level. The first significant practice was applying crop rotation for which farmers who applied this practice were 76.9% in all farmers, 89.4% in adopters, and 46.6% in non-adopters. Farmers who didn’t practice crop rotation were 23.1% in all farmers, 10.6% in adopters, and 53.4% in non-adopters. Chi-square test of independency yield significant association indicating that farmers’ practicing of crop rotation in the locality is dependent on the adoption of the EFALP program.
The second significant variable was growing legume crops in crop rotation. This practice was applied by 75.4% of all farmers, 90.1% of adopters, and 39.7% of non-adopters. Those who didn’t grow legume crops in crop rotation made 24.6% of all farmers, 9.9% of adopters, and 60.3% of non-adopters. Chi-square test performed between the variables adoption and growing legume crops in rotation yield significant association indicating that adoption is dependent of growing legume crops.
www.ijaer.in Copyright © IJAER 2016, All right reserved Page 1781 irrigation systems yield significant association indicating that these two variables are dependent to each other.
The fourth significant sustainable agricultural practice was using animal manure for which respondents who used animal manure were 75% in all farmers, 82.4% in adopters, and 44.8% in non-adopters. Those who didn’t use manure in the same three groups were 25.6%, 17.6%, and 55.2% respectively. Chi-square test performed between these two variables yield significant association indicating that using animal manure was dependent of the adoption of the EFALP program.
Finally, the last significant sustainable agricultural practice was taking adequate measures to protect pastures and preventing overgrazing. Farmers who responded positively to this question were 43% in all farmers, 51.5% in adopters, and 25.0% in non-adopters while farmers who responded negatively to the same question in the same groups were 57.0%, 48.5%, and 75%, respectively. Chi-square test yield significant association indicating that the variable taking adequate measures to protect pastures and preventing overgrazing was dependent of adoption of EFALP program.
Table 1. Comparisons of adopters and non-adopters in terms of promoted sustainable agriculture.
Sustainable Agricultural Practice Adopters Non adopters Total
N % N % N %
1. Do you apply crop rotation?
Yes 126 89.4 27 46.6 153 76.9
No 15 10.6 31 53.4 46 23.1
TOTAL 141 100.0 58 100.0 199 100.0
X2= 42.38; p≤0.01
2. Do you grow legume crops in crop rotation?
Yes 127 90.1 23 39.7 150 75.4
No 14 9.9 35 60.3 49 24.6
TOTAL 141 100.0 58 100.0 199 100.0
X2= 56.279; p≤0.01
3. Controlled and carefully use of pesticides?
Yes 88 62.4 36 62.1 124 62.3
No 53 37.6 22 37.9 75 37.7
TOTAL 141 100.0 58 100.0 199 100.0
X2= 0.01; p=0.544
4. Controlled and carefully use of chemical matter and fertilizers?
Yes 96 68.1 37 63.8 133 66.8
No 45 31.9 21 31.8 66 33.2
www.ijaer.in Copyright © IJAER 2016, All right reserved Page 1782 X2= 0.343; p=0.335
5. Conscious irrigation and application of modern irrigation methods (Drip or sprinkler irrigation)
Yes 84 59.6 24 41.4 108 54.3
No 57 40.4 34 58.6 91 45.7
TOTAL 141 100.0 58 100.0 199 100.0
X2= 5.482; p=0.014 6. Using animal manure.
Yes 122 82.4 26 44.8 148 75.4
No 19 17.6 33 55.2 51 25.6
TOTAL 141 100.0 58 100.0 199 100.0
X2=37.487; p≤0.01
7. Taking adequate measures for soil erosion.
Yes 89 74.2 31 62.0 120 70.6
No 31 25.8 19 38.0 50 28.4
TOTAL 120 100.0 49 100.0 170 100.0
X2= 2.52; p=0.08
8. Taking adequate measures to protect pastures and preventing overgrazing
Yes 52 51.5 12 25.0 64 43.0
No 49 48.5 36 75.0 85 57.0
TOTAL 101 100.0 48 100.0 149 100.0
X2= 9.314; p=0.02
Overall, adoption of the EFALP program in Eregli Red Bed area is dependent of applying crop rotation, growing legume forages in crop rotation, consciously use of irrigation water and application of modern irrigation systems, using animal manure, and taking adequate measures to protect pastures and preventing overgrazing, but independent of taking adequate measures against soil erosion.
Comparisons of selected sustainable agriculture applications which weren’t subject to promotion
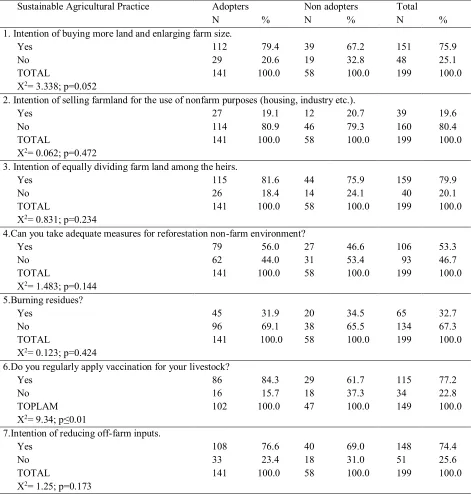
www.ijaer.in Copyright © IJAER 2016, All right reserved Page 1783 Table 2. Comparisons of adopters and non-adopters in terms of
non-promoted sustainable agriculture practices.
Sustainable Agricultural Practice Adopters Non adopters Total
N % N % N %
1. Intention of buying more land and enlarging farm size.
Yes 112 79.4 39 67.2 151 75.9
No 29 20.6 19 32.8 48 25.1
TOTAL 141 100.0 58 100.0 199 100.0
X2= 3.338; p=0.052
2. Intention of selling farmland for the use of nonfarm purposes (housing, industry etc.).
Yes 27 19.1 12 20.7 39 19.6
No 114 80.9 46 79.3 160 80.4
TOTAL 141 100.0 58 100.0 199 100.0
X2= 0.062; p=0.472
3. Intention of equally dividing farm land among the heirs.
Yes 115 81.6 44 75.9 159 79.9
No 26 18.4 14 24.1 40 20.1
TOTAL 141 100.0 58 100.0 199 100.0
X2= 0.831; p=0.234
4.Can you take adequate measures for reforestation non-farm environment?
Yes 79 56.0 27 46.6 106 53.3
No 62 44.0 31 53.4 93 46.7
TOTAL 141 100.0 58 100.0 199 100.0
X2= 1.483; p=0.144 5.Burning residues?
Yes 45 31.9 20 34.5 65 32.7
No 96 69.1 38 65.5 134 67.3
TOTAL 141 100.0 58 100.0 199 100.0
X2= 0.123; p=0.424
6.Do you regularly apply vaccination for your livestock?
Yes 86 84.3 29 61.7 115 77.2
No 16 15.7 18 37.3 34 22.8
TOPLAM 102 100.0 47 100.0 149 100.0
X2= 9.34; p≤0.01
7.Intention of reducing off-farm inputs.
Yes 108 76.6 40 69.0 148 74.4
No 33 23.4 18 31.0 51 25.6
TOTAL 141 100.0 58 100.0 199 100.0
www.ijaer.in Copyright © IJAER 2016, All right reserved Page 1784 3.2. Farmers’ Perceptions of the EFALP Program and Their Sources of Information about Sustainable Agricultural Practices.
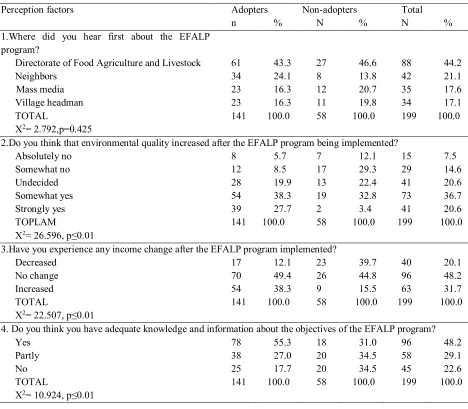
Farmers’ perceptions and their sources of information about the EFALP program are presented in Table 3. In this part of the study farmers’ first sources of information about the program; their opinions on whether or not the program increased environmental quality and income of farmers in the region; and their opinions on whether or not they received enough information about the objectives and implementation processes of the program were determined.
Table 3. Farmers’ perceptions of the EFALP program.
Perception factors Adopters Non-adopters Total
n % N % N %
1.Where did you hear first about the EFALP program?
Directorate of Food Agriculture and Livestock 61 43.3 27 46.6 88 44.2
Neighbors 34 24.1 8 13.8 42 21.1
Mass media 23 16.3 12 20.7 35 17.6
Village headman 23 16.3 11 19.8 34 17.1
TOTAL 141 100.0 58 100.0 199 100.0
X2= 2.792,p=0.425
2.Do you think that environmental quality increased after the EFALP program being implemented?
Absolutely no 8 5.7 7 12.1 15 7.5
Somewhat no 12 8.5 17 29.3 29 14.6
Undecided 28 19.9 13 22.4 41 20.6
Somewhat yes 54 38.3 19 32.8 73 36.7
Strongly yes 39 27.7 2 3.4 41 20.6
TOPLAM 141 100.0 58 100.0 199 100.0
X2= 26.596, p≤0.01
3.Have you experience any income change after the EFALP program implemented?
Decreased 17 12.1 23 39.7 40 20.1
No change 70 49.4 26 44.8 96 48.2
Increased 54 38.3 9 15.5 63 31.7
TOTAL 141 100.0 58 100.0 199 100.0 X2= 22.507, p≤0.01
4. Do you think you have adequate knowledge and information about the objectives of the EFALP program?
Yes 78 55.3 18 31.0 96 48.2
Partly 38 27.0 20 34.5 58 29.1
No 25 17.7 20 34.5 45 22.6
TOTAL 141 100.0 58 100.0 199 100.0
www.ijaer.in Copyright © IJAER 2016, All right reserved Page 1785 Three of the four Chi-square tests performed in this part were found significant. The first significant variable was whether or not environmental quality increased after the program for which among the whole sample 57.3% of farmers somewhat or strongly agreed with this idea, whereas about 22% thought vice versa. Among the adopters the rate of those who somewhat and strongly agreed that the program increased environmental quality went up to 66% while the rate of those who thought vice versa fell down to 14.2%. Among the non-adopters these figures were calculated as 36.2%, and 41.4%, respectively. Chi square test performed between these two variables yield significant association indicating that the idea that environmental quality increased after the EFALP Program was dependent on adoption.
The second significant variable was whether or not the program caused an increase in farmers’ income for which those who responded positively to this question were 31.7% in all farmers, 38.3% in adopters, and 15.5% in non-adopters. Those who believed that the program caused a decrease in farmers’ income in the same groups were 20.1%, 12.1%, and 39.7%, respectively. Chi square test performed between these two variables yield significant association indicating that the variable income level of farmers was dependent on adoption.
The third significant variable was whether or not farmers have enough information about the objectives and implementation process of the EFALP program. Those who responded “yes” to this question were 48.2% in all farmers, 55.3% in adopters, and 31.0% in non-adopters whereas, those who responded “no” to this question were 22.6% in all farmers, 17.7% adopters, and 34.5% in non-adopters. Chi-square test performed between the variables adoption and whether or not farmers have enough knowledge and information about the objectives and implementation process of the program yield significant association indicating these two variables are dependent to each other.
Comparisons of adopters and non-adopters in terms of their sources of information on selected sustainable agricultural practices and whether or not they thought that they have enough knowledge and information about these practices were presented in Table 4. In this part farmers were asked to determine their primary source of information on soil and plant nutrition, crop diseases and pesticides, animal husbandry, and irrigation. Each of these subjects was reflected to a question which was followed by an additional question searching information whether or not farmers thought to have enough information on each of these topics.
www.ijaer.in Copyright © IJAER 2016, All right reserved Page 1786 thought that they didn’t have enough knowledge and information about irrigation were 15.6% in all farmers, 13.5% in adopters, and 20.7% in non-adopters. Chi-square test performed between these two variables yield significant association indicating that having enough knowledge and information about irrigation is dependent to adoption.
Results of chi-square tests in this section showed that among the eight variables selected in this part of the study only one, namely, having enough knowledge and information about irrigation was dependent on adoption but the other eleven variables were independent of adoption
Table 4. Farmers’ sources of information on sustainable agricultural practices.
Perception factors Adopters Non-adopters Total
n % N N %
1.What is your primary source of information about soil and plant nutrition?
My own experience 51 36.2 19 32.8 70 35.2
Neighbor farmers 51 36.2 20 34.5 71 35.7
Directorate of Food Agriculture and Livestock 28 19.9 14 24.1 42 21.1
Mass media 11 7.8 5 8.6 16 8.0
TOTOL 141 100.0 58 100.0 199 100.0
X2= 0.560, p=0.906
2. Do you think you have enough information about soil fertilizing and plant nutrition?
Yes 90 63.8 29 50.0 119 58.8
Moderate 38 27.0 21 36.2 59 29.6
No 13 9.2 8 13.8 21 10.6
TOTAL 141 100.0 58 100.0 199 100.0
X2= 3.317, p=0.190
3.What is your primary source of information about pests and plant diseases.
My own experiences 44 31.2 16 27.6 60 30.2
Neighbor farmers 41 29.1 18 31.0 59 29.6
Pests dealers 23 16.3 10 17.2 33 16.6
Directorate of Food Agriculture and Livestock 11 7.8 4 6.9 15 7.5
Mass media 22 15.6 10 17.2 32 16.1
TOTAL 141 100.0 58 100.0 199 100.0
X2= 0.366, p=0.985
4. Dou you think that you have enough information about crop diseases and pesticides?
Yes 81 57.4 30 51.7 111 55.8
Moderate 44 31.2 20 34.5 64 32.2
No 16 11.3 8 13.8 24 12.1
TOTAL 141 100.0 58 100.0 199 100.0
X2= 0.582, p=0.747
5. What is your primary source of information about animal husbandry?
Neighbors 37 31.9 5 31.9 42 28.2
www.ijaer.in Copyright © IJAER 2016, All right reserved Page 1787
Veterinarians (public) 18 15.5 7 15.5 25 16.8
Mass media 15 12.9 6 12.9 21 14.1
Veterinarian (private) 21 18.1 5 18.1 26 17.4
TOTAL 116 100.0 33 100.0 149 100.0
X2= 4.523, p=0.340
6. Do you think that you have enough knowledge and information about animal nutrition and diseases?
Yes 41 35.0 11 34.4 52 34.9
Moderate 36 30.8 13 40.6 49 32.9
No 40 34.2 8 25.0 48 32.2
TOTAL 117 100.0 32 100.0 199 100.0
X2=1.404, p=0.496
7. What is your primary source of information about irrigation?
Elder family member 37 31.9 5 15.2 42 28.2
Neighbor farmers 25 21.6 10 30.3 35 23.5
Irrigation Association 18 15.5 7 21.2 25 16.8
Directorate of Food Agriculture and Livestock 15 12.9 6 18.2 21 14.1
Mass media 21 18.1 5 15.2 26 17.4
TOTAL 116 100.0 33 100.0 149 100.0
X2= 4.521, p=0.340
8. Dou you think you have enough knowledge and information about irrigation?
Yes 100 70.9 24 41.4 124 62.3
Moderate 22 15.6 22 37.9 44 22.1
No 19 13.5 12 20.7 31 15.6
TOTAL 141 100.0 58 100.0 199 100.0
X2=16.395, p≤0.01
4. CONCLUSIONS AND RECOMMENDATIONS
Results of the study showed that farmers who adopted the EFALP program used promoted sustainable agricultural practices more that non-adopter farmers. These practices were applying crop rotation, growing legume crops, applying modern irrigation systems, taking adequate measures for soil erosion, and taking adequate measures to protect pastures and preventing overgrazing. On the other hand, of the seven selected non-promoted sustainable agricultural practices only one was statistically significant indicating that there were no major differences between adopters and non-adopters in terms of non-promotes sustainable agricultural practices. From the results of comparisons of adopters and adopters in terms of promoted and non-promoted sustainable agricultural practices, a basic conclusion can be drawn that promotion was really effective in adoption of the EFALP Program. Therefore, any agri-environmental program aiming to reach greater rate of adoption should seek opportunities of providing promotions.
www.ijaer.in Copyright © IJAER 2016, All right reserved Page 1788 and information about the objectives of the EFALP program. On the other hand, there were no significant differences in terms of sources of information about selected sustainable agricultural practices and farmers’ knowledge levels of these practices. The only difference in this section was that adopter farmers had more knowledge on irrigation as compared to non-adopters.
Overall, agri-environmental programs make contributions to environmental quality in environmental sensitive areas in Turkey. Governmental support in the beginning period may increase farmers’ participation in the program. However, in order to establish sustainable agricultural production in environmentally sensitive areas, governmental support should be accompanied by regular extension services and training activities.
ACKNOWLEDGEMENTS
This study was fully supported by the Turkish Scientific Research Council (TUBITAK-in Turkish). Project # 110O747. The author expresses his deepest appreciation for this support.
REFERENCES
Ataseven, Y., & Sumelius, J. (2014). The evaluation of agro-environmental policies in Turkey and the European Union. Fresenius Environmental Bulletin, 23, 2045-2053.
Boz, I., Akbay, C., Bas, S., & Budak, D. B. (2011). Adoption of innovations and best management practices among dairy farmers in the Eastern Mediterranean region of Turkey. Journal of Animal and Veterinary Advances, 10, 251-261.
Boz, I., & Akbay, C. (2005). Factors influencing the adoption of maize in Kahramanmaras province of Turkey. Agricultural Economics, 33, 431-440.
Boz, I., Akbay, C., Jordan, GNM., & Kamalak, A. (2005). Measuring livestock farmers effect on sustainable agricultural and rural development, Livestock Research for Rural Development, Volume 17, Article # 88,
[Online: http://www.cipav.org.col/lrrd17/8/boz17088.htm], [Accessed: December 11, 2016]
www.ijaer.in Copyright © IJAER 2016, All right reserved Page 1789 Carey, P. D., Manchester, S. J., & Firbank, L. G. (2005). Performance of two agro-environment schemes in England: a comparison of ecological and multi-disciplinary evaluations. Agriculture, Ecosystems & Environment, 108, 178-188.
Drost, D., Gilbert, L., & Hales, K. (1997). Utah’s vegetable growers: assessing sustainable agriculture, HorTechnology, October-December, 4, 445-450.
Drost, D. (1998). Targeting extension efforts for the adoption of sustainable agricultural practices. Journal of Extension (36)5, [Online: http://www.joe.org/search.html], [Accessed: August 21th 2009].
Hodge, I. D., Adams, W. M., & Bourn, N. A. D. (1992). The cost of conservation: comparing like with like—a comment on Brotherton. Environment and Planning A, 24, 1051-1054.
Jennings, M.D. and Reganold, J.P. (1991). Hierarchy and subsidy stress as a theoretical basis for managing environmentally sensitive areas. Landscape Urban Plan. 21, 31-45.
Lobley, M., Potter, C. (1998). Environmental stewardship in UK agriculture: a comparison of the environmentally sensitive area program and the countryside stewardship scheme in South East England. Geoforum, 29(4), 413-432.
Official Gazette. (2009). Cevre amacli tarimsal arazilerin korunmasi programini tercih eden ureticilerin desteklenmesine dair kararin uygulanmasina iliskin teblig (2009/3) Resmi Gazete Sayi 27113. 17 Ocak 2009.
Olhan, E., Ataseven, Y., & Arisoy, H. (2010). The features of farmers preferring environmentally friendly agricultural methods: The case of Turkey Scientific Research and Essays, 5, 646-653.
Tatlidil, F. F., Boz, I., & Tatlidil, H. (2009). Farmers’ perception of sustainable agriculture and its determinants: a case study in Kahramanmaras province of Turkey. Environment, Development and Sustainability, 11, 1091-1106.