RP-HPLC Method Development and Validation for the Simultaneous Estimation of Metoprolol and Telmisartan in Tablet Dosage Form
8
0
0
Full text
(2) 76 K.Pranitha et al / Int. J. of Pharmacy and Analytical Research Vol-3(1) 2014 [75-82]. of essential hypertension in terms of its convenience and patient compliance. Literature survey revealed HPLC8-10, HPTLC13, and simultaneous UV spectrophotometric methods15 have been reported for the estimation of MET, TEL either alone or in combination with other drugs like. Hydrochlorothiazide 10, Indapamide13, Ramipril 14, etc. The present research work describes the rapid, accurate, sensitive and reproducible RPHPLC method for simultaneous estimation of Metoprolol and Telmisartan from the tablet formulation.. . METOPROLOL. TELMISARTAN. MATERIALS AND METHODS Chemicals/ Reagents and Solvents Metoprolol -50mg and Telmisartan-40mg were obtained from, GLENMARK Pharmaceutical Ltd. Mumbai. Double Distilled Water (HPLC grade), Methanol (HPLC grade), Acetonitrile (HPLC grade), orthophosphoric acid and Potassiumdihydrogen phosphate were of reagent grade. The pharmaceutical preparations of combination of Metoprolol and Telmisartan that is TELMAXX 50 tablet (GLENMARK Pharmaceutical Ltd. Mumbai.).. Instrumentation and Equipments The HPLC analysis was accomplished on WATERS high pressure liquid chromatography outfitted with 515 reciprocating dual column HPLC pump, a manually operating Rheodyne injector with 20 μL sample loop, X-terra C8 4.6 mm x 150 mm analytical column reversed-phase material of. 5μ size and a 2487 model UV-Visible detector. All the parameters of HPLC were controlled by N 2000 chromatographic system software. Other instruments used were TECHCOMP UV-Vis spectrophotometer of model 2310, Shimadzu electronic balance of model XEX-200, ADWA of model AD102U digital pH meter and ENERTECH of model SE60US ultrasonic bath sonicator.. ANALYTICAL METHOD DEVELOPMENT Optimization of UV conditions A symmetry X-terra C8(4.6mm x150mm,5m) was used for chromatographic separation. The mobile phase composed of pH 3 Buffer (Ortho phosphoric acid):Acetonitrile:Methanol (45:10:45) at flow rate 0.7 mL/min with run time 6 mins. Mobile phase and sample solution were filtered through a 0.45 μm membrane filter and degassed. The detection of both drugs was carried out at 226 nm.. Figure-1. Isobestic point of Metoprolol and Telmisartan.. www.ijpar.com.
(3) 77 K.Pranitha et al / Int. J. of Pharmacy and Analytical Research Vol-3(1) 2014 [75-82]. Optimized Method Parameters MobilePhase : Phosphate buffer (3.0 pH): Acetonitrile: Methanol (45:10:45) Column (Stationary Phase): X-terra (C8) (4.6mm x 150mm, 5m) Flow rate (ml/min): 0.7 Column temperature (°C): Ambient Volume of injection loop (l): 20 Detection wavelength (nm):226 Drug RT (min): Metoprolol- 2.4, Telmisartan- 3.4. Figure 1.1.Optimized chromatogram. Fig: 1 Optimized chromatogram PROCEDURE FOR PREPARATION OF SOLUTION Preparation of buffer. From this, 3 ml of the solution was pipetted into another 10 ml volumetric flask and diluted up to the mark with diluent.. Take 1000ml of HPLC grade water. Dissolve 2.72 grams of Potassium di hydrogen phosphate salt and Adjusted the pH to 3.0 with orthophosphoric acid.. Sample Solution Preparation. Preparation of mobile phase A mixture of above prepared buffer 450 ml (45%), 450 ml of HPLC grade Methanol and 100 mL of Acetonitrile (10%) were mixed and degassed in ultrasonic water bath for 5 minutes. The mobile phase was filterred through 0.45 µ filter under vacuum.. Diluent Preparation. Accurately weighed and transferred tablet powder equivalent to 12.5 mg of Metoprolol and 10 mg of Telmisartan (136.3 mg) into a 100ml clean dry volumetric flask and added about 70ml of diluent. It was sonicated to dissolve completely and made volume up to the mark with the same diluent. (Stock solution) From this, 3 ml of the solution was pipetted into another 10 ml volumetric flask and diluted up to the mark with diluent. Use Mobile phase Diluent Phase. Procedure. ASSAY Preparation of the Metoprolol And Telmisartan standard & sample solution Preparation of Standard Solution. 20 µL of the standard and sample solutions were injected into the chromatographic system and areas for the Metoprolol and Telmisartan peaks were measured. % Assay was calculated by using the formulae. Calculation:. Accurately weighed and transferred 12.5 mg of Metoprolol and 10 mg of Telmisartan working standard into a 100 ml clean dry volumetric flask and added about 70 ml of diluent. It was sonicated to dissolve completely and made volume up to the mark with the same diluent. (Stock solution). Assay % = AT. WS. DT. P. Avg. Wt. --------- x -------- -x ------- x ------- x ------------- X 100 AS. www.ijpar.com. DS. WT. 100. Label Claim.
(4) 78 K.Pranitha et al / Int. J. of Pharmacy and Analytical Research Vol-3(1) 2014 [75-82]. Where: AT = Average area counts of sample preparation. AS = Average area counts of standard preparation. WS = Weight of working standard taken in mg. P = Percentage purity of working standard. Sensitivity of the proposed method was estimated in terms of Limit of Detection (LOD) and Limit of Quantitation (LOQ). LOD = 3.3 x ASD/S and LOQ = 10 x ASD/S, Where, ‘ASD’ is the average standard deviation and ‘S’ is the slope of the line.. Robustness. LC = LABEL CLAIM mg/ml.. ANALYTICAL METHOD VALIDATION The HPLC method was validated in accordance with ICH guidelines.. Robustness was evaluated by making deliberate variations in method parameters such as variation of wave length; flow rate and change in mobile phase composition. The robustness of the method was studied for METO and TELM. Accuracy Accuracy was carried out by % recovery studies at three different concentration levels. To the preanalyzed sample solution of METO and TELM a known amount of standard drug powder of METO and TELM were added at 80, 100 and 120 % level.. Precision The system precision of the method was verified by five replicate injections of standard solution containing METO and TELM. The method precision was carried out the analyte five times using the proposed method. Repeatability was measured by multiple injections of a homogenous sample of METO and TELM.. Linearity The linearity was determined separately for METO and TELM Linearity of the method was studied by injecting 5 concentrations of both drugs prepared in methanol and calibration curves were constructed by plotting peak area against the respective concentrations.. RESULTS Selection of Chromatographic Conditions and Optimization of Mobile Phase Mobile phase was optimized to separate METO and TELM using Symmetry C8 column (150 mm x 4.6 mm i.d., 5μm). Initially, ACN and phosphate buffer and methanol in the Equal proportions were tried as mobile phase but the splitting of the peaks for both these drugs was observed. Therefore, after adjustment of pH of mixed phosphate buffer to 3.0 with ortho-phosphoric acid, and mobile phase composition (phosphate buffer, ACN and methanol in 45:10:45 % v/v) was tried for resolution of both drugs. Good resolution and symmetric peaks were obtained for both drugs when the pH of the mobile phase (buffer) was adjusted to 3.0. The flow rate of the mobile phase was 0.7 mL min-1. Under optimum chromatographic conditions, the retention time for METO and TELM was found to be 2.473 and 3.407 min, respectively when the detection was carried out at 226nm. A typical chromatogram of two drugs is shown in (Figure 1).. Limit of detection and Limit of quantitation. Table-1 : ACCURACY DATA Drugs. Metoprolol. Telmisartan. Amount Added (mg) 67.5 75 82. Amount Found (mg) 67.43 76.3 81.55. % Recovery. % of mean recovery. 99.8 102 98. 99.93. 54 60 66. 53.86 60.41 66.90. 99.42 101.37 102.50. 101.09. www.ijpar.com.
(5) 79 K.Pranitha et al / Int. J. of Pharmacy and Analytical Research Vol-3(1) 2014 [75-82]. Table-2 : PRECISION S.NO. RT METOPROLOL AREA RT TELMISARTAN AREA. 1. 2.472. 1745269. 3.397. 6017053. 2. 2.543. 1744223. 3.477. 6061793. 3. 2.498. 1755032. 3.440. 6084698. 4. 2.473. 1745274. 3.398. 6017163. 5. 2.548. 1744271. 3.482. 6061885. Average. 2.5068. 1746614. 3.4388. 6048520. Standard Deviation 0.0368. 4726.359. 0.041. 30151.48. 0.27. 1.2. 0.50. % RSD. 1.4. Table-3 METHOD PRECISION S.NO 1 2 3 4 5 Average. RT. AREA. RT. AREA. 2.490. 1723623. 3.423. 5925015. 2.515. 1709983. 3.448. 5864329. 2.492. 1720330. 3.418. 5891368. 2.488. 1723516. 3.423. 5924883. 2.498. 1720296. 3.423. 5909737. 1719549.6. 3.427. 5903066. 5590.41. 0.011. 25688.72. 0.33. 0.32. 0.44. 2.4966. Standard Deviation. 0.010. % RSD. 0.4. Table-4: LINEARITY RESULTS OF METOPROLOL AND TELMISARTAN. METOPROLOL. TELMISARTAN. Conc(mcg/ml) 12.5. Mean Area 319799. Conc(mcg/ml) 10. Mean Area 1677519. 25. 1003211. 20. 3739380. 37.5. 1755032. 30. 6084698. 50. 2551909. 40. 8174726. 62.5. 3150848. 50. 10315646. www.ijpar.com.
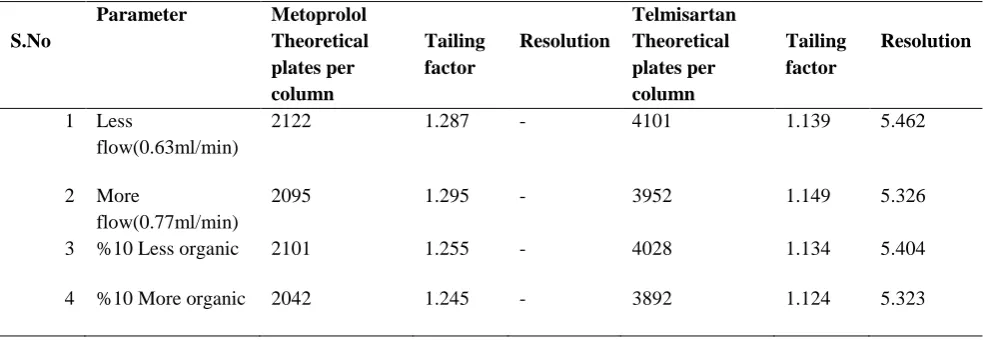
(6) 80 K.Pranitha et al / Int. J. of Pharmacy and Analytical Research Vol-3(1) 2014 [75-82]. Fig 2: LINEARITY GRAPHS OF METOPROLOL AND TELMISARTAN. Table-5 LOD AND LOQ RESULTS. S.No. Drug name. Standard deviation. Slope. LOD. LOQ. 1. Metoprolol. 11659. 57686. 0.66. 2.02. 2. Telmisartan. 55707. 217116. 0.84. 2.56. Table-6: ROBUSTNESS RESULTS Parameter S.No. Metoprolol Theoretical plates per column 2122. Tailing factor. Resolution. 1.287. -. Telmisartan Theoretical plates per column 4101. Tailing factor. Resolution. 1.139. 5.462. 1. Less flow(0.63ml/min). 2. 2095. 1.295. -. 3952. 1.149. 5.326. 3. More flow(0.77ml/min) %10 Less organic. 2101. 1.255. -. 4028. 1.134. 5.404. 4. %10 More organic. 2042. 1.245. -. 3892. 1.124. 5.323. Precision. RESULTS AND DISCUSSION Accuracy The accuracy of the method studied at three different concentration levels i.e. 80%, 100 % and 120 % showed acceptable % recoveries in the range of 99.93% for METO and 101.09% for TELM. The results are shown in Table 1.. The precision study was evaluated on the basis of % RSD value was found to be in the range 0.27– 1.4 and 0.32-0.4 %, respectively. As the RSD values were < 2% therefore developed method was precise. Results of precision study are shown in Table 2 & 3.. www.ijpar.com.
(7) 81 K.Pranitha et al / Int. J. of Pharmacy and Analytical Research Vol-3(1) 2014 [75-82]. examined. The low value changes of theoretical plates, tailing factor indicating robustness of the method. The results are shown in Table 6.. Linearity The linearity was determined separately for METO and TELM. Linearity of the method was studied by injecting 5 concentrations of both drugs prepared in methanol and calibration curves were constructed by plotting peak area against the respective concentrations. The METO and TELM followed linearity in the concentration range of 12.5– 62.5 μg mL-1 and 10-50μg mL-1; respectively. The results are shown in Table 4.and Fig no 2.. Analysis of marketed tablet formulation 3 replicates of the samples solutions (20 μL) were injected for quantitative analysis. The amounts of METO and TELM estimated were found to 99.09 % and 98.42 %, respectively. A good separation and resolution of both drugs indicates that there was no interference from the excipients commonly present in pharmaceutical formulations. The results are shown in Table 7.. Limit of detection and Limit of quantitation The LOD for METO and TELM was found to be 0.667 and 0.846 μg, respectively. The LOQ for METO and TELM was found to be 2.021 and 2.565 μg, respectively. The low values of LOD and LOQ indicates high sensitivity of the method. The results are shown in Table 5.. System Suitability Test The system suitability parameters such as resolution, number of theoretical plates and tailing factor were studied and were summarized in Table 8.. Robustness study Robustness of the method was studied by making deliberate changes in the chromatographic conditions and the effects on the results were Table 7: ASSAY RESULTS Assay Results Drug METOPROLOL. Amount present/tablet 50mg. % of Assay 99.09. TELMISARTAN. 40 mg. 98.42. Table 8: SYSTEM SUITABILITY PARAMETERS System suitability Parameters Tailing Factor Theoritical plates Resolution. CONCLUSION The developed RP-HPLC method is simple, precise, accurate, selective and reproducible. The method has been found to be adequately in linearty and robustness can be used for simultaneous determination of Metoprolol and Telmisartan in tablet formulation. The method was validated as per ICH guidelines.. METOPROLOL 1.275 2076 --. TELMISARTAN 1.145 3997 5.381. I like to thankful to Pharm Tech Solution, Cherlapally, Hyderabad, India for providing the gift samples of Metoprolol and Telmisartan. And also to the principal Dr.K.Rajeswar Dutt Smt.Sarojini Ramulamma College of Pharmacy, Mahabubnagar , Andhrapradesh and special thanks for Mrs.J.PRIYA Madam & Ms.Ramathilagam madam as well as my friends who helped during the project work.. ACKNOWLEDGEMENT REFERENCES [1] British Pharmacopoeia 2010, London-HMSO Publication. Vol II p.1419,1042.. www.ijpar.com.
(8) 82 K.Pranitha et al / Int. J. of Pharmacy and Analytical Research Vol-3(1) 2014 [75-82]. [2] Brirtish Pharmacopoeia: Medicines and Healthcare products Regulatory Agency (MHRA): Telmisartan: 5872 [3] Indian Pharmacopoeia 2010, Government of India, Ministry Of Health and Welfare. Published by Indian Pharmacopoeia commission, 2010, 1681-1682, 2186-2187. [4] The United States Pharmacopoeia: London: The United States Pharmacopoeial Convention: Metoprolol: 2007; 28(6): 1102. [5] Rang H.P, Dale M.M, Ritter J.N,Moore P.K,Pharmacology, 5th edn, New york, Churchill, Livingstone, 2003,672-674. [6] Laurence LB, Goodman and Gilman: The pharmacological basis of therapeutics:11th ed.: Mcgraw-hill medical publishing divisions: Metoprolol: 2006;284 [7] Martindale The Complete Drug Reference: Telmisartan: 951.3. [8] Suresh Kumar GV , Rajendra prasad proposed Development And Validation of Reverse phase HPLC Method for Simultaneous Estimation Of Telmisartan And Amlodipine In Tablet Dosage Form Int J Pharmacy Pharm Sci Vol 2, Issue 3, 2010 p.no 128-131. [9] A. Lakshmana Rao, Gopala Swamya, proposed RP-HPLC Method for the Simultaneous Estimation of Telmisartan and Hydrochlorothiazie in Pharmaceutical Dosage Form. International Journal of Drug Development & Research October-December 2011,Vol. 3, Issue 4, ISSN 0975-9344 [10] S.Brijesh, D. Pateland S. Ghosh, Development of Reverse-Phase HPLC Method for Simultaneous Analysis of Metoprolol Succinate and Hydrochlorothiazide in a Tablet Formulation,Tropical Journal of Pharmaceutical Research, 2009; Dec; 8 (6): 539-43. [11] A.Gadhavi, C.Patel, R.Parmar, V.Shah and D.Shah, simultaneous estimation of Telmisartan and Metoprolol Succinate in pharmaceutical dosage form by simultaneous equation method, IJIPLS,2012 [12] Prajakta S.Nawle et al; proposed normal and reverse phase HPTLC methods for simultaneous estimation of Telmisartan and Metoprolol succinate in pharmaceutical formulations. ISRN Analytical Chemistry Volume 2012, Article ID 815353, 6 pages [13] Patel AR, Chandrul KK. Method development, validation and stability study for simultaneous estimation of Telmisartan and Indapamide by RP-HPLC in pure and marketed formulations. Int J Pharm And Biomed Res. 2011 2(1): 4-16.[Available from http://www.kejapub.com/ijpbr/docs/IJPBR11-02-01-10.pdf] [14] Sunil Jawla et al;.,Development and validation of HPLC method for the simultaneous estimation of Telmisartan & Ramipril in pharmaceutical formulations.International Journal of PharmTech Research 2010,2(2) 1625-1633 [15] Dr.Sujit pilli and Deepmala manore et al; proposed simultaneous spectrophotometric estimation of Telmisartan and Metoprolol succinate in bulk and tablet dosage forms. IJPT 2012 vol4 (4090-4099) *******************************. www.ijpar.com.
(9)
Figure
Related documents
The differences of our algorithm are that according to the specific requirements for patients, who already gained osteoporotic fractures of the proximal femur or multiple vertebral
This study aimed to develop and pilot test an educa- tional video containing information regarding the in- formed consent process for trauma patients undergoing surgery, develop
Patients with inflammatory bowel disease (IBD) may have increased risk of developing CDI, along with worse outcomes, higher rates of colectomy and higher rates of recurrence
The magnesium nitrate and magnesium phosphate which impregnated coir pith showed a gradual increase at the level of the cation, magnesium in all concentrations of
suis cells were detected on PAECs incubated with the negative control preparation (Figure 5d).. To assess whether the presence
In this paper we describe how a participatory, multi- method, continuous informed consent process developed by researchers, study participants and community stake- holders during
Aldous EW, Mynn JK, Banks J, Alexander DJ: A molecular epidemiological study of avian paramyxovirus type 1 (Newcastle disease virus) isolates by phylogenetic analysis of a
