R E S E A R C H
Open Access
Multilevel predictors of adolescent physical
activity: a longitudinal analysis
Mary O Hearst
1*, Carrie D Patnode
2, John R Sirard
3, Kian Farbakhsh
1and Leslie A Lytle
1Abstract
Background:To examine how factors from a social ecologic model predict physical activity (PA) among adolescents using a longitudinal analysis.
Methods:Participants in this longitudinal study were adolescents (ages 10-16 at baseline) and one parent enrolled in the Transdisciplinary Research on Energetics and Cancer-Identifying Determinants of Eating and Activity (TREC-IDEA) and the Etiology of Childhood Obesity (ECHO). Both studies were designed to assess a socio-ecologic model of adolescent obesity risk. PA was collected using ActiGraph activity monitors at two time points 24 months apart. Other measures included objective height and weight, adolescent and parent questionnaires on multilevel psychological, behavioral and social determinants of PA, and a home PA equipment inventory. Analysis was conducted using SAS, including descriptive characteristics, bivariate and stepped multivariate mixed models, using baseline adjustment. Models were stratified by gender.
Results:There were 578 adolescents with complete data. Results suggest few statistically significant longitudinal associations with physical activity measured as minutes of MVPA or total counts from accelerometers. For boys, greater self-efficacy (B = 0.75,p = 0.01) and baseline MVPA (B = 0.55,p < 0.01) remained significantly associated with MVPA at follow-up. A similar pattern was observed for total counts. For girls, baseline MVPA (B = 0.58,p = 0.01) and barriers (B = -0.32,p = 0.05) significantly predicted MVPA at follow-up in the full model. The full multilevel model explained 30% of the variance in PA among boys and 24% among girls.
Conclusions:PA change in adolescents is a complex issue that is not easily understood. Our findings suggest early PA habits are the most important predictor of PA levels in adolescence. Intervention may be necessary prior to middle school to maintain PA through adolescence.
Keywords:Adolescent, Multilevel, Predictors of physical activity, Longitudinal
Background
The U.S. Department and of Health and Human Ser-vices recommends that children and adolescents engage in 60 min or more of physical activity (PA) every day, with most of that time in moderate- to vigorous-inten-sity [1]. Engagement in moderate-to-vigorous physical activity (MVPA) typically decreases as adolescents move through their teen years. Examining data from a large adolescent cohort, Laska et al. showed that MVPA among girls declined from 5.9 h/week during the transi-tion from early adolescence to mid-adolescence with a
further decline to 3.5 h/week by late adolescence [2]. A similar, but less pronounced decline was also seen in boys. It is known that PA is inversely associated with cardiovascular disease risk factors during adolescence and into adulthood; [3-5] therefore, identifying and sub-sequently intervening upon factors that help predict and promote adolescent PA over time is crucial for long-term health outcomes.
There have been several review articles in the past decade describing the correlates of PA among adoles-cents [3,6-8]. The reviewers generally conclude that the state of the science is limited due to the complexity of the issue, limited external validity, and the lack of mea-surement precision. Even studies using the most com-plex multilevel models only explain a low percentage
* Correspondence: [email protected] 1
Division of Epidemiology and Community Health, University of Minnesota, 1300 South Second Street, Suite 300, Minneapolis, MN 55454, USA Full list of author information is available at the end of the article
(5.3-5.7%) of the variance in PA levels among children and adolescents [3]. There are relatively few longitudinal and intervention studies that help to describe potential causal factors or determinants of change in PA [9,10].
What is generally agreed upon is that no one factor explains PA levels among adolescents or predicts the decline in PA as children age, but that a reasonable approach is to examine multilevel influences PA. Social-ecological models [11] attempt to define the complexity of behavioral choices and typically include psychological, behavioral, social, home, school, and neighborhood environmental factors. Non-modifiable influences, such as demographic characteristics, are informative as the findings may highlight the need to target intervention strategies or develop differential intervention strategies based on the composition of the target group. An ecolo-gical model used to examine levels of PA in youth might reasonably examine intrapersonal factors (for example, attitudes and opinions youth hold about being active), their own behavioral experiences (for example, the extent to which being physically active is part of their behavioral routine), their social environment (for example the types of role models and encouragement that they receive from others to be active) and factors in the physical environments of their neighborhoods (such as how safe it is to play outside or the availability of parks and recreational areas) A social ecological model would suggest that all of these factors hold some impor-tance in understanding PA behavior and that the factors are inter-related.
Previously, we published the influences of individual, social and environmental correlates of PA using cross-sectional data [12]. Given the paucity of high-quality longitudinal research, it was important for us to exam-ine these relationships longitudinally. Therefore, the purpose of this manuscript was to assess change in PA over time in a large sample of adolescents. This adds to the limited literature in two ways. First, the longitudinal nature of the data in the adolescent cohort allowed us to examine how early exposures predict later levels of PA and second, the use of multilevel and multi-factorial models allowed us to simultaneously identify individual, social, and environmental (i.e., home, school, and neigh-borhood) predictors of change in adolescent PA. The hypothesis was that factors at each level would be pre-dictive of MVPA and that the predictors would differ by gender.
Methods
Study design
The data from this study came from two longitudinal studies comprised of adolescents (ages 10-16 at baseline) and one of their parents: the Transdisciplinary Research on Energetics and Cancer - Identifying Determinants of
Eating and Activity (TREC-IDEA) and Etiology of Child-hood Obesity (ECHO) study. Both studies were designed to examine the social and environmental influences on unhealthy weight gain in adolescents [13]. A social eco-logical model was developed to guide the research and included contextual factors from the intrapersonal and social and physical environments, their impact on weight related behaviors including levels of PA, and the impact of the contextual factors and behaviors on body composition [13]. The TREC-IDEA and ECHO studies used identical data collection instruments and measure-ment protocol and recruited from the same target popu-lation. Both studies were approved by the University of Minnesota Institutional Review Board.
For the TREC-IDEA study, youth were recruited from a preexisting cohort, [14] a permit application listing from the Minnesota Department of Motor Vehicles, and a convenience sample from the St. Paul-Minneapolis metropolitan area. Baseline data collection (n = 349 ado-lescent/parent dyads) began in October, 2006, and con-cluded in May, 2007. Annual data collection was timed for each participant such that the measurements were taken at the same time of year for 24 month follow-up. Ninety-four percent of the baseline sample (n = 328) was re-measured 24-months post baseline.
For the ECHO study, 374 youth and a parent were recruited from the membership of Health Partners (HP) health plan within the seven-county metropolitan area of Minneapolis, St. Paul, Minnesota between June 2007 and March 2008. We used a recruitment procedure that targeted a range of overweight and healthy weight youth and parents and that oversampled minorities. To be eli-gible for enrollment, adolescents were required to be current HP members, in grades 6th to 11th in the fall of 2007, residing in one of the randomly selected middle or high-school districts included in the sample, have a parent willing to participate and be willing to allow their names and contact information to be sent from HP to the study team at the University of Minnesota for further eligibility screening, consent and measurement. Baseline data collection (n = 374 adolescent/parent dyads) began in 2007; there was one additional data col-lection period in 2009. Eighty-six percent of the sample was assessed in both time periods.
approximately 45); moved (IDEA = 2; ECHO = mately 3); and unable to connect (ECHO = approxi-mately 4). The Institutional Review Board at the University of Minnesota approved both studies.
Measures
Individual-level data collection occurred at the Epide-miology Clinical Research Center (ECRC) of the Univer-sity of Minnesota by trained staff. Data collection included measured height, weight and body composition and self-report survey data by adolescents and parents. Parents completed a home-based physical activity equip-ment survey and we used Geographical Information Sys-tem (GIS) software to assess elements of the neighborhood physical environment. Details of all mea-sures are provided below.
Dependent variable: physical activity
The ActiGraph activity monitor, model 7164 (Acti-Graph, LLC, Pensacola, FL) was used to collect 7 days of PA data using 30-s epochs (data collection intervals). The monitor is an objective measure of PA and has been previously validated for use with children in laboratory and field settings [15-17]. At monitor distri-bution, trained research staff fit the monitor to each stu-dent and provided the stustu-dents with written and verbal instructions for wearing the monitor and for sending it in to study staff upon completion of the 7 days of wearing.
A custom developed software program was created by one of the authors (JRS) using Visual Basic (version 6.0, Microsoft, Corp) and modified for the current study design [18,19]. Daily inclusion criteria were established to determine days and times with acceptable acceler-ometer data. Blocks of time incorporating at least 30 continuous minutes of“0”output were considered to be times when the subject was not wearing the monitor and were eliminated. Missing data within an adolescent’s 7-day record were replaced via imputation based on the Expectation Maximization (EM) algorithm [20]. On average, approximately 22 h of data (about 13%) were imputed over the 7 days of data collection. Summary PA variables were calculated using the Freedson age-specific count cutoffs [21] distinguishing moderate and vigorous intensity based on age-adjusted MET values [22,23].
Individual level measures: covariates
Pubertal status was assessed by the self-report Pubertal Development Scale (PDS) [24]. The PDS is a five ques-tion summed score with good internal consistency (alpha = 0.77) and good correlation with physician rat-ing (0.61-0.67) [24]. Puberty was included as a covariate because different stages of pubertal development, parti-cularly among girls, have been shown to be related to participation in PA and PA decline [25]. Demographic
and socioeconomic status collected from the parents included whether the adolescent receives free or reduced cost lunch (1 = yes, 0 = no) and highest household level of parent education (1 = college or higher, 0 = less than college) and from the adolescent included age, gender (1 = female, 0 = male), and race (1 = white, 0 = other).
Adolescent height, weight and percent body fat (PBF) were measured by trained staff with the adolescent wearing a T-shirt and a pair of shorts. Height was measured using a Shorr Height Board to the nearest 0.1 cm, while the participants stood in their bare feet. Body mass and total body fat was determined using a digital bioelectrical impedance scale (Tanita TBF-300A Body Composition Analyzer/Scale, Tanita Corporation, Tokyo, Japan). Because previous findings with these data showed that percent body fat was more highly correlated with PA than was BMI, [26] we chose to include only percent body fat in the models. Weight status has been shown to be associated with lower levels of motivation to engage in PA [27], thus weight status could confound the relationship of PA change over time.
Potential predictors: intrapersonal factors
Self-efficacy was self-reported by adolescents using a previously tested scale [28]. The scale consisted of eight questions that gauged children’s confidence in their abil-ity to overcome barriers and seek support in order to be active. Responses were on a 5-point scale from 1
(strongly disagree)to 5 (strongly agree). Internal consis-tency of this scale was a= 0.82. Self-efficacy has been shown to correlate with PA in children and also mediate the relationship between social support by parents and peers [29-31].
PA enjoyment was measured using seven questions
with the stem of “When I am active...” followed by
items such as “I feel bored,” and “I dislike it” [28]. Responses were measured on a 5-point scale from 1 (strongly disagree) to 5 (strongly agree) with a higher score indicative of more enjoyment related to PA. Internal consistency of this scale was a= 0.94. Models of behavior change suggest that behavior is more likely to occur if positive outcomes are expected, such as enjoyment of PA [32], and is supported in the litera-ture [33].
Perceived barriers to PA was assessed with 12 items adapted from Dishman et al. [34] Items such as“I don’t
like to sweat” and“It would make me embarrassed”
were used to identify potential obstacles that kept the adolescent from being physically active. Items were rated on a 5-point scale, from 1 (never)to 5 (very often). A higher score reflected perceiving more barriers to PA,
with the internal consistency a= 0.83. Contrary to PA
Potential predictors: behavioral repertoire
Daily minutes of screen time was assessed as part of the self-report survey. Weekday screen time behavior was assessed asking:“On a typical weekday (Monday-Friday),
how many hours do you spend watching TV?” The
same question was asked for watching DVDs or videos, Nintendo/Play Station/computer games and internet/ computers. A similar question was used to assess week-end (Saturday-Sunday) screen time behavior [2,36]. Six
response options ranged from “none”to “6+ hours” per
day. Responses categories were set at the mid-range, weighted for weekday versus weekend, summed and divided by seven resulting in the number of daily min-utes of screen time behavior. Sedentary behavior has a mixed relationship with PA as seen in a latent class ana-lysis of PA and sedentary behavior [37]. Therefore, we included sedentary behavior as a potential confounder.
Sports team participation was measured by a self-report survey question asking,“How many team or indi-vidual sports or activities such as varsity or junior var-sity sports, intramurals, or out-of-school programs/
activities do you currently participate in” [38,39]?
Response categories were recorded to reflect yes or no to team sport participation. Differences in activity levels may be due to sports participation [40], particularly when considering healthy and overweight adolescents.
Potential predictors: social environment
Perceived parent support andperceived peer support
scales were self-reported on the survey by the adoles-cents. Adolescents indicated how often during a typical week their mother or father or one of their friends pro-vided support related to PA. Items were scored on a scale from 1 (never) to 5 (every day) and included
state-ments such as “encouraged you to do physical
activ-ities,” and “watched you participate.” Internal
consistency of these scales were also good at a = 0.76
and 0.86 for parent and peer social support, respectively [41]. Social support plays an important role in adoles-cent PA [12].
Potential predictors: the physical environment. Home and neighborhood
Thehome PA environment was evaluated using a vali-dated self-reported instrument, the Physical Activity and Media Inventory (PAMI), completed by the parents at home [42]. The intent of the PAMI was to capture both availability and accessibility of home based equipment that may support PA or sedentary behavior. The inven-tory included a list of 42 PA equipment items and 5 media equipment items. For each room within the home, parents were asked to indicate specific quantities and accessibility of each particular piece of equipment. A PA availability and accessibility score was created which reflects the product of each item quantity and accessibility. A higher score reflected greater presence
and access of PA equipment at home. Parents received the PAMI during the clinic visit with instructions to return the form after completion. The home environ-ment is associated physical activities among adolescents, with differences noted between boys and girls [43].
Two survey scales were used to characterize
adoles-cent perceptions of the neighborhood environment.
Per-ceived neighborhood safety and ease of mobilitywere based on items included in the Neighborhood Environ-ment Walkability Scales (NEWS) which indicate high test-retest reliabilities among adults from neighborhoods
with differing levels of “walkability” [44]. Perceived
neighborhood safety was measured with five items on the adolescent survey on a 4-point scale ranging from 1 (strongly disagree) to 4 (strongly agree). Examples of items included,“It is safe to walk or play in my
neigh-borhood during the day.” Responses were recorded for
consistency in direction such that higher scores reflected less perceived safety, or more safety concerns. The
inter-nal consistency was a = 0.75. The perceived ease of
mobility scale measured adolescent’s perceptions of how easy or difficult it was to navigate their neighborhood by walking and/or biking. A sample question from the five
item scale was “There are sidewalks on most of the
streets in my neighborhood”. Response categories ran-ged from 1 (strongly disagree) to 4 (strongly agree, with a high value reflected better ease of access on foot or bicycle. Reliability for the ease of mobility scale wasa= 0.78.
Finally, we calculated a ‘walkability index’from three variables available from the Geographic Information Sys-tems (GIS) software package, ArcGIS, version 9.2 (Envir-onmental Systems Research Institute, Redlands, CA) including residential, intersection and employment den-sity. Using the participant home address, residential density was calculated as the number of persons in housing units per unit of land area excluding water. Intersection density provided a measure of street con-nectivity with higher concon-nectivity providing more direct routes for pedestrians. It was calculated as the number of street intersections per unit of land area with inter-state highways removed. Employment density was calcu-lated as the total employees per of land area excluding
water. A three-componentwalkability indexwas created
walkability, traffic speed/volume, access to recreation facilities and other features of the build environment such as residential density [47].
Statistical methods
As the nature of PA differs between boys and girls, [12] we stratified all analyses a priori and present gender specific estimates for all analyses, using SAS v. 9.1 for Windows (Cary, NC: SAS Institute Inc). Given the iden-tical protocols and measurements, data for the IDEA and ECHO cohort studies were combined for analyses. Descriptive statistics included calculating proportions and variable distributions for the entire sample, gender stratified and using chi-square and t-test statistics to determine statistical differences by gender. We used baseline variables to predict PA at 24-month follow-up, adjusting for baseline PA. We used a stepped approach to statistical modeling, generalized estimating equations, using the procedure PROC GENMOD, with school indi-cated as the random effect given that some youth were nested in school (average = 2.5 students per school). We tested for differences between IDEA and ECHO
partici-pants on demographic factors (t-test and chi-square)
and conducted post-hoc regression modeling with each study sample as described above.
Results
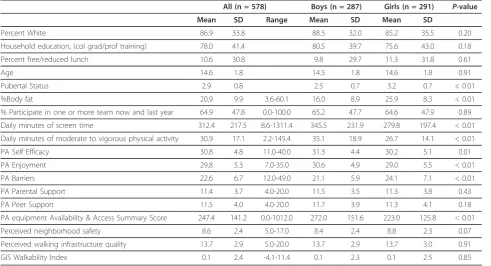
Table 1 presents the sample characteristics for the ana-lytic sample. The ECHO sample was younger, lower
income, more racial/ethnic diversity and had a higher proportion overweight compared to the IDEA sample. Given the samples were drawn from the same target population and completed the same measurement pro-tocols; this difference adequately enhanced the general-izability of the study. There were 578 adolescents included in the analysis from baseline, with an even gen-der split. The sample was predominantly white, college-educated and 11% received free or reduced cost lunch. Adolescents spent over 5 h per day in front of a screen, and 31 min per day engaged in MVPA. Psychosocial fac-tors and social and physical environment scales and variables had central tendency with good distribution. See Table 1.
Gender differences in baseline values included girls being more advanced on the pubertal scale, having more body fat, engaging in less screen time and less MVPA, enjoying PA less and reporting more PA barriers and less PA equipment available in the homes compared to boys.
Daily minutes of MVPA at baseline was 31 min and significantly increased to 37 min at follow-up. This increase was seen for boys (baseline = 35 min; follow-up = 41 min) and girls (baseline = 27 min; follow-up = 32 min). The average minutes of total activity per day (light, moderate and vigorous) decreased significantly for the whole sample (16.3 min) and decreased by 16 min for both boys and girls, driven by a decrease in light activity levels. Pearson correlation coefficients between
Table 1 Sample Characteristics, TREC IDEA and ECHO, 2006-2010
All (n = 578) Boys (n = 287) Girls (n = 291) P-value
Mean SD Range Mean SD Mean SD
Percent White 86.9 33.8 88.5 32.0 85.2 35.5 0.20
Household education, (col grad/prof training) 78.0 41.4 80.5 39.7 75.6 43.0 0.18
Percent free/reduced lunch 10.6 30.8 9.8 29.7 11.3 31.8 0.61
Age 14.6 1.8 14.5 1.8 14.6 1.8 0.91
Pubertal Status 2.9 0.8 2.5 0.7 3.2 0.7 < 0.01
%Body fat 20.9 9.9 3.6-60.1 16.0 8.9 25.9 8.3 < 0.01
% Participate in one or more team now and last year 64.9 47.8 0.0-100.0 65.2 47.7 64.6 47.9 0.89
Daily minutes of screen time 312.4 217.5 8.6-1311.4 345.5 231.9 279.8 197.4 < 0.01
Daily minutes of moderate to vigorous physical activity 30.9 17.1 2.2-145.4 35.1 18.9 26.7 14.1 < 0.01
PA Self Efficacy 30.8 4.8 11.0-40.0 31.3 4.4 30.2 5.1 0.01
PA Enjoyment 29.8 5.3 7.0-35.0 30.6 4.9 29.0 5.5 < 0.01
PA Barriers 22.6 6.7 12.0-49.0 21.1 5.9 24.1 7.1 < 0.01
PA Parental Support 11.4 3.7 4.0-20.0 11.5 3.5 11.3 3.8 0.43
PA Peer Support 11.5 4.0 4.0-20.0 11.7 3.9 11.3 4.1 0.18
PA equipment Availability & Access Summary Score 247.4 141.2 0.0-1012.0 272.0 151.6 223.0 125.8 < 0.01
Perceived neighborhood safety 8.6 2.4 5.0-17.0 8.4 2.4 8.8 2.3 0.07
Perceived walking infrastructure quality 13.7 2.9 5.0-20.0 13.7 2.9 13.7 3.0 0.91
baseline and follow-up were statistically significant (p≤
0.001) for the total sample (r = 0.46), boys (r = 0.47) and girls (r = 0.38).
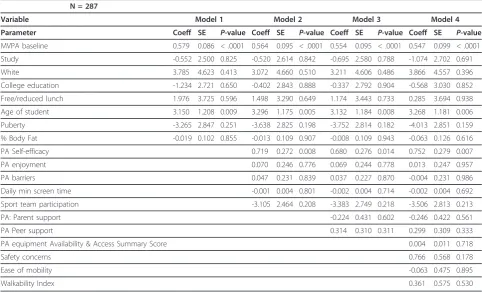
Table 2 presents the regression results for predictors of change in daily minutes of MVPA among boys. Model 1 explores the role of baseline sociodemographic, body composition and levels of MVPA at baseline as predictors of PA 24 months later and finds that MVPA at baseline and age are significantly related to MVPA at 24 months. Model 2 adds the intrapersonal and beha-vioral factors showing an additional significant relation-ship between self-efficacy and PA at 24-months follow-up. Model 3 adds elements of the social environment with no substantial change noted. Finally, model 4 adds the features of the physical environment again resulting in no additional changes in significant predictors.
For boys, three variables consistently emerge as pre-dictors of MVPA. The most consistent, positive and
sig-nificant predictor of MVPA at the follow-up
measurement time across the four models was MVPA at baseline. The age at baseline measurement was also a consistent, positive and significant predictor of MVPA across the four models. Finally, PA self-efficacy remains a statistically significant predictor of PA at 24 months in the full model with baseline levels of self-efficacy in boys predicting subsequent levels of MVPA. The
amount of variance explained in the full model for PA for boys was r2= 0.30.
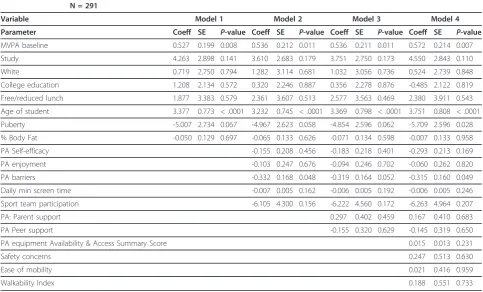
Data for girls are presented in Table 3. The full model shows that baseline MVPA and the age of the girls at baseline were positively and significantly associated with higher levels of MVPA at 24 months. In addition, earlier pubertal development was associated with lower levels of MVPA in the final model at the follow-up period. Of the intrapersonal, social and physical environmental fac-tors examined, only baseline perceptions of barriers related to being physically active were significantly and inversely related to PA at the follow-up period. The amount of variance explained in the full model for girls was r2= 0.24.
Post-hoc analysis was conducted modeling the IDEA and ECHO samples independently and stratified by gen-der. The findings were comparable with few exceptions. Among boys, the combined sample showed a significant relationship with age, but the study specific analysis showed an age effect only among IDEA participants and a relationship between change in PA and more safety concerns. This is consistent with the observed decrease in light physical activity over time. Self-efficacy and baseline PA remained significant across both samples of boys. Among girls, age, baseline PA and puberty remained significantly associated with PA at follow-up.
Table 2 Predictors of physical activity measured as average mean minutes of daily moderate to vigorous physical activity among adolescent boys, TREC IDEA and ECHO, 2006-2010
N = 287
Variable Model 1 Model 2 Model 3 Model 4
Parameter Coeff SE P-value Coeff SE P-value Coeff SE P-value Coeff SE P-value
MVPA baseline 0.579 0.086 < .0001 0.564 0.095 < .0001 0.554 0.095 < .0001 0.547 0.099 < .0001
Study -0.552 2.500 0.825 -0.520 2.614 0.842 -0.695 2.580 0.788 -1.074 2.702 0.691
White 3.785 4.623 0.413 3.072 4.660 0.510 3.211 4.606 0.486 3.866 4.557 0.396
College education -1.234 2.721 0.650 -0.402 2.843 0.888 -0.337 2.792 0.904 -0.568 3.030 0.852
Free/reduced lunch 1.976 3.725 0.596 1.498 3.290 0.649 1.174 3.443 0.733 0.285 3.694 0.938
Age of student 3.150 1.208 0.009 3.296 1.175 0.005 3.132 1.184 0.008 3.268 1.181 0.006
Puberty -3.265 2.847 0.251 -3.638 2.825 0.198 -3.752 2.814 0.182 -4.013 2.851 0.159
% Body Fat -0.019 0.102 0.855 -0.013 0.109 0.907 -0.008 0.109 0.943 -0.063 0.126 0.616
PA Self-efficacy 0.719 0.272 0.008 0.680 0.276 0.014 0.752 0.279 0.007
PA enjoyment 0.070 0.246 0.776 0.069 0.244 0.778 0.013 0.247 0.957
PA barriers 0.047 0.231 0.839 0.037 0.227 0.870 -0.004 0.231 0.986
Daily min screen time -0.001 0.004 0.801 -0.002 0.004 0.714 -0.002 0.004 0.692
Sport team participation -3.105 2.464 0.208 -3.383 2.749 0.218 -3.506 2.813 0.213
PA: Parent support -0.224 0.431 0.602 -0.246 0.422 0.561
PA Peer support 0.314 0.310 0.311 0.299 0.309 0.333
PA equipment Availability & Access Summary Score 0.004 0.011 0.718
Safety concerns 0.766 0.568 0.178
Ease of mobility -0.063 0.475 0.895
Barriers and self-efficacy were associated with PA at fol-low-up among girls in the ECHO sample, but not the IDEA sample, which is also consistent with the older mean age of the IDEA sample.
Discussion
Our longitudinal analysis, which included the IDEA sample and adds the ECHO sample, provided another perspective examining the longitudinal relationship between early exposures and subsequent PA levels. In our longitudinal analysis, for both boys and girls, the most powerful predictor of PA at 24 months was base-line levels of PA. This is important as it re-emphasizes that many health behaviors are established early in life and become habituated. Interventions should focus on establishing strong lifestyle habits of PA prior to or in early adolescence to ameliorate the typical decline dur-ing adolescence into young adulthood. Gaindur-ing a better understanding of the forces at play that cause some children to increase activity while others to decline is key in intervening at the most appropriate age. For example, a recent longitudinal analysis showed that MVPA decreased significantly from age 9 to 15, but the linear rate of decline leveled off around age 15 [48]. In addition, developing effective interventions at the family and community level that help foster early,
enjoyable experiences with PA is an important public health goal.
Early experience with physical activity opportunities may influence how an individual feels about being active and if they self-define as an active person. Those per-ceptions may impact activity long term. For example, if an adolescent experiences low levels of self-efficacy, enjoyment and high perceptions of barriers to being active when they are younger, they may decide that being physically active is not a good option for them and that perception may persist. However, it has been found that such perceptions can be altered via targeted intervention [49]. In addition, physical activity requires some skills. If skills are not learned and practiced during early adolescent (behavioral repertoire), becoming active later in adolescence without an external intervention may be more difficult or frustrating and be an additional barrier to being active.
Among boys, the final models suggested that baseline self-efficacy or confidence to be physically active was an important predictor of positive change in PA over time; self-efficacy was a statistically significant correlate of PA in our cross-sectional analysis as well [13]. Self-efficacy is among the only consistently positively associated vari-ables with MVPA among children and adolescents [9] and has been found to mediate changes in PA in several
Table 3 Predictors of physical activity measured as average mean minutes of daily moderate to vigorous physical activity among adolescent girls, TREC IDEA and ECHO, 2006-2010
N = 291
Variable Model 1 Model 2 Model 3 Model 4
Parameter Coeff SE P-value Coeff SE P-value Coeff SE P-value Coeff SE P-value
MVPA baseline 0.527 0.199 0.008 0.536 0.212 0.011 0.536 0.211 0.011 0.572 0.214 0.007
Study 4.263 2.898 0.141 3.610 2.683 0.179 3.751 2.750 0.173 4.550 2.843 0.110
White 0.719 2.750 0.794 1.282 3.114 0.681 1.032 3.056 0.736 0.524 2.739 0.848
College education 1.208 2.134 0.572 0.320 2.246 0.887 0.356 2.278 0.876 -0.485 2.122 0.819
Free/reduced lunch 1.877 3.383 0.579 2.361 3.607 0.513 2.577 3.563 0.469 2.380 3.911 0.543
Age of student 3.377 0.773 < .0001 3.232 0.745 < .0001 3.369 0.798 < .0001 3.751 0.808 < .0001
Puberty -5.007 2.734 0.067 -4.967 2.623 0.058 -4.854 2.596 0.062 -5.709 2.596 0.028
% Body Fat -0.050 0.129 0.697 -0.065 0.133 0.626 -0.071 0.134 0.598 -0.007 0.133 0.958
PA Self-efficacy -0.155 0.208 0.456 -0.183 0.218 0.401 -0.293 0.213 0.169
PA enjoyment -0.103 0.247 0.676 -0.094 0.246 0.702 -0.060 0.262 0.820
PA barriers -0.332 0.168 0.048 -0.319 0.164 0.052 -0.315 0.160 0.049
Daily min screen time -0.007 0.005 0.162 -0.006 0.005 0.192 -0.006 0.005 0.246
Sport team participation -6.105 4.300 0.156 -6.222 4.560 0.172 -6.263 4.964 0.207
PA: Parent support 0.297 0.402 0.459 0.167 0.410 0.683
PA Peer support -0.155 0.320 0.629 -0.145 0.319 0.650
PA equipment Availability & Access Summary Score 0.015 0.013 0.231
Safety concerns 0.247 0.513 0.630
Ease of mobility 0.021 0.416 0.959
intervention studies among youth [10]. It is plausible that the younger a child is when they become involved in activity and experience success (as measured through peer approval, tangible rewards, or parental recognition) the more confident they become - leading to mainte-nance of activity over time. The nature and types of physical activities that preadolescent and adolescent boys often participate in (e.g., both free time“play”and organized sports) require a certain level of motivation and persistence, of which confidence is a key driver.
For girls, the construct of perceived barriers was the strongest predictor of change in PA across all models. In our cross-sectional analysis, barriers also emerged as a statistically significant covariate of MVPA [12]. In gen-eral, girls in this sample had higher perceived barriers, including obstacles related to physical comfort (i.e., sweating) and enjoyment (e.g., embarrassment and being chosen last for teams). Understanding the specific nat-ure of these barriers - including whether they are“real” impedances versus reactionary explanations for why one is not active - warrants further investigation. Our data do suggest that, in this sample of girls, perceived bar-riers are distinct from the perception of self-efficacy, suggesting that the barriers that girls are responding to are not related to their PA abilities. A better under-standing of how girls make decisions about the types and frequency of various activities might help to explain potential tools for overcoming such barriers.
This research expands upon our previous examination of the correlational associations found between levels of PA and factors drawn from our conceptual model based on a social ecological framework [12,13]. Our previous cross-sectional analysis, using baseline data from adoles-cents participating in the IDEA study showed that, for boys, self-efficacy, peer support, having PA equipment in the home and the average monthly temperature were all significantly related to MVPA, after adjusting for demographic characteristics. For girls, perceived barriers, distance to school and the walkability index were signifi-cantly related to MVPA, after adjustment for demo-graphics. All relationships were in the expected direction.
Consistent with previous research, neither parent nor peer support as early exposures were shown to be pre-dictive of PA among boys or girls [9]. Parental encour-agement and family support has been associated with increased PA among males and females over time in some studies, [50,51] but not in others [48]. The role that parental and peer encouragement plays appears to vary depending on whether children enter puberty early or late, particularly for boys [48]. Similarly, we saw no evidence that the elements we assessed in the home and neighborhood environments were related to PA in our longitudinal analysis. The lack of association between
environmental factors and activity levels may reflect the generally high socioeconomic status and potential for resources in our sample; the environment is adequate enough to not pose a barrier to activity. In a sample that is more restricted or limited in their resources, environmental factors may be more important in explaining behaviors [52]. Replicating this research in more diverse samples is warranted. In addition, future research examining how changes in the physical envir-onment (whether through natural experiments or trials) might influence PA is warranted.
This manuscript expands the work presented by Pat-node, which presented cross sectional findings using similar models [12]. Our longitudinal analysis was able to show differences in predictive factors by gender, which is important for intervention research. In addi-tion, our longitudinal models were able to explain nearly a third of PA variance in boys and girls. The cross-sec-tional analysis conducted by Patnode et al. on part of this sample accounted for 25% and 15% among boys and girls, [12] respectively, compared to 30% and 24% in our models. Our inclusion of baseline levels of MVPA is likely responsible for the increased variance explained. Previous research, as noted in the introduction, has explained only 5% of the variance of PA among children [53]. Therefore, despite the limited significant indepen-dent predictors in our final models, a multilevel and longitudinal analysis was a better tool to understand the complexities of adolescent physical activity participation. However, we also acknowledge and recommend work on further development and refining of existing mea-sures, particularly for youth transitioning from elemen-tary to high school and beyond.
curve modeling with multiple time points, might better elucidate factors that relate to any increase or decrease in the trajectory of PA levels among children and adolescents.
Despite these limitations, this study fulfills many of the recommendations for future research offered by Craggs and colleagues [9] in their review of determi-nants in change in PA among children and adolescents. First, our study included an objective measurement of PA across a wide age range of children and adolescents. Second, our study included a comprehensive assessment of determinants within multiple levels, including both subjective perceptions as well as objective measures of the environment. Lastly, our study included a relatively large sample with an even distribution of boys and girls during an important developmental period.
Conclusion
The lack of effectiveness of many interventions designed to increase PA among youth may, in part, be due to a poor understanding of the mechanisms responsible for behavior change [55]. Further prospective and interven-tion research, perhaps over longer periods of time, seems warranted if we are to design interventions that specifically target these potential mediators. In addition, it seems that more qualitative research to better under-stand the factors that influence children and adolescents to adopt and maintain higher levels of PA over time may prove beneficial.
Support
Transdisciplinary Research in Energetics and Cancer (TREC) Initiative. Grant # 1U54CA116849-01 and from the National Heart, Lung and Blood Institute, Grant # R01HL085978. Supported by: Etiology of Childhood Obesity (ECHO) with funding from National Heart, Lung and Blood Institute, Grant # R01HL085978.
Acknowledgements
The authors would like to thank the families that participated in the IDEA and ECHO studies. The IDEA study was supported by the National Cancer Institute’s Transdisciplinary Research in Energetics and Cancer (TREC) Initiative (1 U54 CA116849-01, Examining the Obesity Epidemic Through Youth, Family & Young Adults, PI: Robert Jeffery, PhD and Leslie Lytle, PhD). The ECHO study was supported by the National Heart, Lung, and Blood Institute (R01HL085978), Leslie Lytle, PhD.
Author details
1Division of Epidemiology and Community Health, University of Minnesota, 1300 South Second Street, Suite 300, Minneapolis, MN 55454, USA.2Kaiser Permanente Center for Health Research, Portland, OR, USA.3Curry School of Education & Kinesiology, University of Virginia, Charlottesville, VA, USA.
Authors’contributions
MH was the lead author and provided analytic oversight and responsible for the content of the manuscript; CP provided additional content expertise and writing; JS provided content expertise and editing of document; KF conducted the analysis; LL was PI of the parent studies and contributed to
the conception and editing of the document. All authors read and approved the final manuscript.
Competing interests
The authors declare that they have no competing interests.
Received: 16 August 2011 Accepted: 6 February 2012 Published: 6 February 2012
References
1. U.S. Department of Health and Human Services:Physical activity guidelines for Americans.USDHSS; 2008.
2. Nelson MC, Neumark-Stzainer D, Hannan PJ, Sirard JR, Story M:
Longitudinal and secular trends in physical activity and sedentary behavior during adolescence.Pediatrics2006,118:e1627-e1634. 3. Brodersen NH, Steptoe A, Williamson S, Wardle J:Sociodemographic,
developmental, environmental, and psychological correlates of physical activity and sedentary behavior at age 11 to 12.Ann Behav Med2005,
29:2-11.
4. Dietz WH:Health consequences of obesity in youth: childhood predictors of adult disease.Pediatrics1998,101:518-525.
5. Biro FM, Wien M:Childhood obesity and adult morbidities.Am J Clin Nutr
2010,91:1499S-1505S.
6. Sallis JF, Prochaska JJ, Taylor WC, Hill JO, Geraci JC:Correlates of physical activity in a national sample of girls and boys in grades 4 through 12. Health Psychol1999,18:410-415.
7. Dunton GF, Kaplan J, Wolch J, Jerrett M, Reynolds KD:Physical
environmental correlates of childhood obesity: a systematic review.Obes Rev2009,10:393-402.
8. van der Horst K, Paw MJ, Twisk JW, Van MW:A brief review on correlates of physical activity and sedentariness in youth.Med Sci Sports Exerc2007,
39:1241-1250.
9. Craggs C, Corder K, van Sluijs EM, Griffin SJ:Determinants of change in physical activity in children and adolescents a systematic review.Am J Prev Med2011,40:645-658.
10. Lubans DR, Foster C, Biddle SJ:A review of mediators of behavior in interventions to promote physical activity among children and adolescents.Prev Med2008,47:463-470.
11. Sallis JF, Owen N:Ecological models of health behavior.InHealth Behavior and Health Education.Edited by: Glanz K, Rimer B, Lewis F. San Francisco: Jossey-Bass; 2002:.
12. Patnode CD, Lytle LA, Erickson DJ, Sirard JR, Barr-Anderson D, Story M:The relative influence of demographic, individual, social, and environmental factors on physical activity among boys and girls.Int J Behav Nutr Phys Act2010,7:79.
13. Lytle LA:Examining the etiology of childhood obesity: The IDEA study. Am J Community Psychol2009,44:338-349.
14. Widome R, Forster JL, Hannan PJ, Perry CL:Longitudinal patterns of youth access to cigarettes and smoking progression: Minnesota Adolescent Community Cohort (MACC) study (2000-2003).Prev Med2007,45:442-446. 15. Eston RG, Rowlands AV, Ingledew DK:Validity of heart rate, pedometry,
and accelerometry for predicting the energy cost of children’s activities. J Appl Physiol1998,84:362-371.
16. Trost SG, Ward DS, Moorehead SM, Watson PD, Riner W, Burke JR:Validity of the computer science and applications (CSA) activity monitor in children.Med Sci Sports Exerc1998,30:629-633.
17. Louie L, Eston R, Rowland A:Validity of heart rate, pedometry and accelerometry for estimating the energy cost of activity in Hong Kong Chinese boys.Pediatr Exerc Sci1999,11:229-239.
18. Sirard JR, Kubik MY, Fulkerson JA, Arcan C:Objectively measured physical activity in urban alternative high school students.Med Sci Sports Exerc
2008,40:2088-2095.
19. Sirard JR, Ainsworth BE, McIver KL, Pate RR:Prevalence of active commuting at urban and suburban elementary schools in Columbia, SC. Am J Public Health2005,95:236-237.
20. Catellier DJ, Hannan PJ, Murray DM, Addy CL, Conway TL, Yang S, Rice JC:
Imputation of missing data when measuring physical activity by accelerometry.Med Sci Sports Exerc2005,37:S555-S562.
22. Harrell JS, McMurray RG, Baggett CD, Pennell ML, Pearce PF, Bangdiwala SI:
Energy costs of physical activities in children and adolescents.Med Sci Sports Exerc2005,37:329-336.
23. Sirard JR, Welk GJ, Heitzler C, Lytle L:Youth accelerometer cutoffs for moderate-to-vigorous physical activity. A sensitivity analysis.American College of Sports Medicine Annual MeetingSeattle, WA; 2009.
24. Petersen A, Crosckett L, Richards M, Boxer A:A self-report measure of pubertal status: reliability, validity, and initial norms.J Youth Adolescence
1988,17:117-133.
25. Baker BL, Davison KK:I know I can: a longitudinal examination of precursors and outcomes of perceived athletic competence among adolescent girls.J Phys Act Health2011,8:192-199.
26. Hearst MO, Sirard J, Lylte L, Dengel DR, Berrigan D:Comparison of three measures of physical activity and associations with blood pressure, HDL and body composition in a sample of adolescents.JPAH.
27. Hwang J, Kim YH:Physical activity and its related motivational attributes in adolescents with different BMI.Int J Behav Med2011, DOI 10.1007/ s12529-011-9196-z.
28. Motl RW, Dishman RK, Saunders R, Dowda M, Felton G, Pate RR:Measuring enjoyment of physical activity in adolescent girls.Am J Prev Med2001,
21:110-117.
29. Motl RW, Dishman RK, Ward DS, Saunders RP, Dowda M, Felton G, Pate RR:
Examining social-cognitive determinants of intention and physical activity among black and white adolescent girls using structural equation modeling.Health Psychol2002,21:459-467.
30. Van Der Horst K, Paw MJ, Twisk JW, Van Mechelen W:A brief review on correlates of physical activity and sedentariness in youth.Med Sci Sports Exerc2007,39:1241-1250.
31. Trost SG, Pate RR, Saunders R, Ward DS, Dowda M, Felton G:A prospective study of the determinants of physical activity in rural fifth-grade children.Prev Med1997,26:257-263.
32. Scanlan T, Carpenter P, Schmidt G:An introduction to the sport commitment model.J Sport Exerc Psychol1993,15:1-15.
33. Butt J, Weinberg RS, Breckon JD, Claytor RP:Adolescent physical activity participation and motivational determinants across gender, age, and race.J Phys Act Health2011,8:1074-1083.
34. Dishman RK, Motl RW, Sallis JF, Dunn AL, Birnbaum AS, Welk GJ, Bedimo-Rung AL, Voorhees CC, Jobe JB:Self-management strategies mediate self-efficacy and physical activity.Am J Prev Med2005,29:10-18.
35. Hsu YW, Chou CP, Nguyen-Rodriguez ST, McClain AD, Belcher BR, Spruijt-Metz D:Influences of social support, perceived barriers, and negative meanings of physical activity on physical activity in middle school students.J Phys Act Health2011,8:210-219.
36. Gortmaker SL, Peterson K, Wiecha J, Sobol AM, Dixit S, Fox MK, Laird N:
Reducing obesity via a school-based interdisciplinary intervention among youth: planet health.Arch Pediatr Adolesc Med1999,153:409-418. 37. Patnode CD, Lytle LA, Erickson DJ, Sirard JR, Barr-Anderson DJ, Story M:
Physical activity and sedentary activity patterns among children and adolescents: a latent class analysis approach.J Phys Act Health2011,
8:457-467.
38. Aaron DJ, Kriska AM, Dearwater SR, Cauley JA, Metz KF, LaPorte RE:
Reproducibility and Validity of an Epidemiologic Questionnaire to Assess Past Year Physical Activity in Adolescents.Am J Epidemiol1995,
142:191-201.
39. Aaron DJ, Kriska AM:Modifiable activity questionnaire for adolescents. Med Sci Sports Exerc1997,29:S79-S82.
40. Olds TS, Ferrar KE, Schranz NK, Maher CA:Obese adolescents are less active than their normal-weight peers, but wherein lies the difference.J Adolesc Health2011,48:189-195.
41. Saunders RP, Motl RW, Dowda M, Dishman RK, Pate RR:Comparison of social variables for understanding physical activity in adolescent girls. Am J Health Behav2004,28:426-436.
42. Sirard JR, Nelson MC, Pereira MA, Lytle LA:Validity and reliability of a home environment inventory for physical activity and media equipment.Int J Behav Nutr Phys Act2008,5:24.
43. Sirard JR, Laska MN, Patnode CD, Farbakhsh K, Lytle LA:Adolescent physical activity and screen time: associations with the physical home environment.Int J Behav Nutr Phys Act2010,7:82.
44. Saelens BE, Sallis JF, Black JB, Chen D:Neighborhood-based differences in physical activity: an environment scale evaluation.Am J Public Health
2003,93:1552-1558.
45. Frank LD, Schmid TL, Sallis JF, Chapman J, Saelens BE:Linking objectively measured physical activity with objectively measured urban form: findings from SMARTRAQ.Am J Prev Med2005,28:117-125. 46. Kligerman M, Sallis JF, Ryan S, Frank LD, Nader PR:Association of
neighborhood design and recreation environment variables with physical activity and body mass index in adolescents.Am J Health Promot2007,21:274-277.
47. Ding D, Sallis JF, Kerr J, Lee S, Rosenberg DE:Neighborhood environment and physical activity among youth a review.Am J Prev Med2011,
41:442-455.
48. Bradley R, McRitchie S, Houts R, Nader P, O’Brien M:Parenting and the decline of physical activity from age 9 to 15.Int J Behav Nutr Phys Act
2011,8:33.
49. Dishman RK, Motl RW, Saunders R, Felton G, Ward DS, Dowda M, Pate RR:
Self-efficacy partially mediates the effect of a school-based physical-activity intervention among adolescent girls.Prev Med2004,38:628-636. 50. Bauer KW, Nelson MC, Boutelle KN, Neumark-Sztainer D:Parental
influences on adolescents’physical activity and sedentary behavior: longitudinal findings from Project EAT-II.Int J Behav Nutr Phys Act2008,
5:12.
51. Dowda M, Dishman RK, Pfeiffer KA, Pate RR:Family support for physical activity in girls from 8th to 12th grade in South Carolina.Prev Med2007,
44:153-159.
52. Lytle LA:Measuring the food environment: state of the science.Am J Prev Med2009,36:S134-S144.
53. Brodersen N, Steptoe A, Williamson S, Wardle J:Sociodemographic, Developmental, Environmental, and Psychological Correlates of Physical Activity and Sedentary Behavior at Age 11 to 12.Ann Behav Med2005,
29:2-11.
54. Rosenberg D, Ding D, Sallis JF, Kerr J, Norman GJ, Durant N, Harris SK, Saelens BE:Neighborhood Environment Walkability Scale for Youth (NEWS-Y): reliability and relationship with physical activity.Prev Med
2009,49:213-218.
55. Baranowski T, Jago R:Understanding the mechanisms of change in children’s physical activity programs.Exerc Sport Sci Rev2005,33:163-168.
doi:10.1186/1479-5868-9-8
Cite this article as:Hearstet al.:Multilevel predictors of adolescent physical activity: a longitudinal analysis.International Journal of Behavioral
Nutrition and Physical Activity20129:8.
Submit your next manuscript to BioMed Central and take full advantage of:
• Convenient online submission
• Thorough peer review
• No space constraints or color figure charges
• Immediate publication on acceptance
• Inclusion in PubMed, CAS, Scopus and Google Scholar
• Research which is freely available for redistribution