R E S E A R C H
Open Access
Systolic left ventricular function is preserved during
therapeutic hypothermia, also during increases in
heart rate with impaired diastolic filling
Viesturs Kerans
1,2, Andreas Espinoza
1,3, Helge Skulstad
4, Per Steinar Halvorsen
3, Thor Edvardsen
2,4and Jan Frederik Bugge
1,5** Correspondence:
jbugge@ous-hf.no
1Department of Anesthesiology,
Rikshospitalet, Division of Emergencies and Critical Care, Oslo University Hospital, Postbox 4950, Nydalen, N-0424 Oslo, Norway
5
Department of Research and Development, Division of Emergencies and Critical Care, Oslo University Hospital, Oslo, Norway Full list of author information is available at the end of the article
Abstract
Background:Systolic left ventricular function during therapeutic hypothermia is found both to improve and to decline. We hypothesized that this discrepancy would depend on the heart rate and the variables used to assess systolic function.
Methods:In 16 pigs, cardiac performance was assessed by measurements of invasive pressures and thermodilution cardiac output and with 2D strain
echocardiography. Left ventricle (LV) volumes, ejection fraction (EF), transmitral flow, and circumferential and longitudinal systolic strain were measured. Miniaturized ultrasonic transducers were attached to the epicardium of the LV to obtain M-mode images, systolic thickening, and diastolic thinning velocities and to determine LV pressure-wall dimension relationships. Preload recruitable stroke work (PRSW) was calculated. Measurements were performed at 38 and 33°C at spontaneous and paced heart rates, successively increased in steps of 20 up to the toleration limit. Effects of temperature and heart rate were compared in a mixed model analysis.
Results:Hypothermia reduced heart rate from 87 ± 10 (SD) to 76 ± 11 beats/min without any changes in LV stroke volume, end-diastolic volume, EF, strain values, or PRSW. Systolic wall thickening velocity (S′) and early diastolic wall thinning velocity decreased by approximately 30%, making systolic duration longer through a prolonged and slow contraction and changing the diastolic filling pattern from predominantly early towards late. Pacing reduced diastolic duration much more during hypo- than during normothermia, and combined with slow myocardial relaxation, incomplete relaxation occurred with all pacing rates. Pacing did not affect S′or PRSW at physiological heart rates, but stroke volume, end-diastolic volume, and strain were reduced as a consequence of reduced diastolic filling and much more accentuated during hypothermia. At the ultimate tolerable heart rate during hypothermia, S′ decreased, probably as a consequence of myocardial hypoperfusion due to sustained ventricular contraction throughout a very short diastole.
Conclusions:Systolic function was maintained at physiological heart rates during therapeutic hypothermia. Reduced tolerance to increases in heart rate was caused by lack of ventricular filling due to diastolic dysfunction and shorter diastolic duration. Keywords:Therapeutic hypothermia; Atrial pacing; Cardiac function; Diastolic dysfunction; Echocardiography
© 2015 Kerans et al.; licensee Springer. This is an Open Access article distributed under the terms of the Creative Commons Attribution License (http://creativecommons.org/licenses/by/4.0), which permits unrestricted use, distribution, and reproduction in any medium, provided the original work is properly credited.
Background
Mild (therapeutic) hypothermia (32 to 34°C) for a limited time interval (12–72 h) seems to improve neurological outcome in several clinical conditions, including patients resuscitated after out-of-hospital cardiac arrest (OHCA) [1,2]. In a re-cently published multi center trial on OHCA patients, however, there was no dif-ference in neurological outcome between target temperatures of 36°C versus 33°C [3]. Compared to moderate (28 to 32°C) or deep (<28°C) hypothermia, therapeutic hypothermia is well tolerated with few side effects, and hemodynamic stability seems to be well preserved. However, therapeutic hypothermia affects cardiac per-formance, and the dominating effects on the normal heart may differ substantially from the effects on hearts exposed to some kind of injury. In patients with cardio-genic shock, therapeutic hypothermia has been shown to improve cardiac perform-ance assessed by increases in thermodilution cardiac index (CI) and mean arterial pressure (MAP) [4], reduce the need for vasopressors, and improve cardiac per-formance assessed by echocardiography [5]. Similarly, experimental studies have shown that therapeutic hypothermia improves cardiac performance during acute myocardial infarction [6] and post resuscitation [7] and protects the heart from is-chemic injury by reducing infarct size [8]. In unselected OHCA patients, however, therapeutic hypothermia reduced MAP and thermodilution CI and increased the need for vasopressors [9]. In patients with presumably normal hearts, both systolic and diastolic dysfunction with reduced cardiac output were demonstrated by echo-cardiography during therapeutic hypothermia [10].
Hypothermia is an integral part of cardiac surgery, and postoperative patients frequently are mildly hypothermic despite rewarming on cardiopulmonary bypass (CPB). Clinical [11] and experimental [12] studies in relation to CPB have demon-strated reduced cardiac performance during mild hypothermia which was particu-larly pronounced at increased heart rates. However, there are also opposite findings demonstrating improved left ventricular function after CPB in experimen-tal animals [13].
Conflicting results also exist regarding the physiological effect of therapeutic hypothermia on the normal heart and circulation [14,15]. In isolated myocardium, isometric force development increases during hypothermia, but the optimal fre-quency for force development is lower compared to normothermia [16]. In the in situ mammalian heart, there is general agreement that therapeutic hypothermia im-pairs diastolic heart function, but the effects on systolic function and blood pressure are contradictory. The reason for this is not clear, but may be related to the experi-mental and clinical conditions and to the methods by which cardiac performance is assessed.
Among clinicians, however, there seem to be a widespread opinion that therapeutic hypothermia has a positive inotropic effect and improves cardiac systolic perform-ance as long as heart rate is not increased [17,18]. In the present study, we tested this hypothesis in an open-chest porcine model. The effects of therapeutic hypothermia on the heart and circulation were measured both by traditional thermo-dilution and pressure-dimension relationships and by imaging techniques with 2D strain echocardiography and with small ultrasonic transducers attached to the epi-cardium of the left ventricle (LV) [19].
Methods
Preparation
A total of 16 Norwegian land race swine with mean weight of 52.2 ± 6.3 kg were in-cluded in the study. The animals were sedated by intramuscular injection of ketamine (20 mg/kg), atropine (0.02 mg/kg), and azaperone (3 mg/kg). Anesthesia was induced by intravenous (iv) injection of pentobarbital 3 mg/kg and morphine 1.0 mg/kg and maintained by iv morphine-infusion (1 to 2 mg/kg/h) and isoflurane-inhalation (1.0 to 1.5%), keeping the end-tidal concentration at the same level during normo and hypothermia within individual animals. Muscle relaxants were not used. Plasma cate-cholamines were measured in two animals and showed no difference between normo and hypothermia. The animals underwent a tracheotomy and were ventilated by air/ oxygen (FiO2= 0.4) with a tidal volume of 10 to 15 ml/kg, adjusted during hypothermia to maintain a stable PCO2.
An 8-French vascular introducer was placed in the ascending aorta through the ca-rotid artery for measurements of hydrostatic blood pressure and for placement of a micromanometer (MPC-500, Millar Instruments, Houston, TX, USA) into the LV cavity for measurements of LV pressure. For cooling and rewarming of the animals, a water-circulated catheter (Cool Line®, Zoll, Chelmsford, MA, USA) was placed in the inferior vena cava from the left femoral vein and connected to a designated thermal regula-tion system (Coolgard 3000®, Zoll). A pulmonary artery catheter (CCO, Edwards Lifesciences, Irvine, CA, USA) was put in place from the left jugular vein to measure cardiac output (CO) and central temperature. After sternotomy, epicardial ultrasonic transducers (Imasonic SA, Besançon, France) were sutured to the anterior LV wall for con-tinuous monitoring of wall thickness through the cardiac cycle. Two pacemaker leads were attached to the right atrial appendage. A snare was placed around the inferior caval vein for acute volume unloading. The preparation lasted for approximately 190 min followed by a minimum of 30 min of stabilization before measurements. All animals were handled according to international regulations. The study was approved by the Oslo University Hospital Institutional Animal Care and Use Commitee and was carried out in accordance with the Norwegian National Legislation on animal experimentation and the European Union Directive 2010/63/EU on the protection of animals used for scientific purposes.
Animal model
Measurements were made at normothermia (38°C) and during mild hypothermia (33°C) at spontaneous and paced heart rates. The water-circulated catheter was used to keep stable temperatures both during normo and hypothermia. Atrial pacing was performed at 100 beats/min, and then successively increased in steps of 20 beats/min up to the toler-ation limit. Measurements were performed after 5 min of stable hemodynamics. At each intervention, transient constriction of the inferior caval vein was performed for acute vol-ume unloading. The first 11 animals were tested for maximal toleration to increases in heart rate. The limit of toleration was set to the maximal frequency at which the animal had stable hemodynamics for 5 min and through the following recording period. Pacing was stopped immediately if hemodynamic deterioration occurred. In the other five ani-mals, pacing was stopped at 140 beats/min during normothermia and 120 beats/min dur-ing hypothermia because reliable recorddur-ings durdur-ing caval vein constriction were not obtainable at higher heart rates. Except for the testing of heart rate toleration limits,
results are therefore presented and compared within and between temperature levels up to frequencies of 140 and 120 beats/min for normo and hypothermia, respectively. In four animals, cooling was instituted during instrumentation, and hypothermic recordings were made first, followed by rewarming and normothermic recordings. In the other animals, normothermic recordings were performed first.
Measurements and calculations Hemodynamics
CO was measured in triplets by thermodilution of 10 ml of ice-cold saline. Stroke volume (SV) was calculated as CO divided by heart rate. Peak systolic LVP, end-systolic LVP (ESP), and end-diastolic LVP (EDP) were recorded. LV afterload was estimated by arterial elastance (Ea) = ESP/SV. Peak positive and negative amplitude of the time de-rivative of LVP were recorded (dP/dtmax, dP/dtmin). Duration of systole was calculated from the onset of steep upstroke of dP/dt to dP/dtmin. Diastolic duration was calculated from dP/dtmin to onset of systole (Figure 1). The LV relaxation time constant (τ) was calculated during isovolumic relaxation time according to Weiss et al. [20]. Time for complete relaxation was defined as 3.5τfrom end systole [21] and was calculated as a fraction of diastolic duration (3.5τ/DD).
Echocardiography
A Vivid 7 scanner with a 2.5/2.75 MHz probe (GE Vingmed Ultrasound, Horten, Norway) was used directly on the heart with a gel stand off for 2D echocardiography/ Doppler recordings. End-diastolic volumes (EDV) were calculated by Simpson biplane method. Ejection fraction (EF) was calculated as SV/EDV. Longitudinal and circumfer-ential strain in septum and lateral wall mid-segments were calculated by speckle track-ing in 2D grey scale images (frame rate 63 ± 11). Transmitral flow was measured from Doppler recordings with assessments of early (E) and late (A) (atrial-induced) diastolic filling velocities.
Ultrasonography
Wall thickness was measured through the cardiac cycle by M-mode recordings from the epicardial ultrasonic transducers (Figure 1). This allowed precise measurements from the exact same region during all interventions. End-systolic and end-diastolic wall dimensions were recorded. Peak systolic wall thickening velocity during ejection (S′) and early and late (atrial-induced) diastolic wall thinning velocities, (e′) and (a′) re-spectively, were measured as previously described [22].
Wall thickness through the cardiac cycle was plotted towards LVP resulting in pressure-wall thickness (P-WTh) loops for calculation of regional work. Regional pre-load recruitable stroke work (PRSW) was calculated as the relationship between P-Wth loop area and end-diastolic WTh (EDWTh) during caval constrictions.
Statistical analysis
Data are reported as mean ± SD. The data from 38 and 33°C at spontaneous and paced heart rates were compared using paired t-test. To study the effect from the interven-tions, the data were analyzed using a linear mixed model to handle the dependencies introduced by repeated measurements within in each subject. The data were analyzed
using temperature level and heart rate (HR) (spontaneous or atrially paced) as determi-nants in a model where variable =β+β1(temp) +β2(HR) +β3(temp × HR). Time of re-cording was included as a covariate to account for the order of measurements and assess the effect of time. Model selection was made choosing the covariance structure with the lowest Akaike information criteria. Predicted values and residuals were inspected for goodness of model fit. Differences were considered significant ifp≤0.05.
Results
Recordings of good quality were obtained from all experiments except from caval con-striction recordings in four animals. The cooling period lasted about 100 min, while warming in the 'cold first' animals lasted 220 min on average. The average duration of
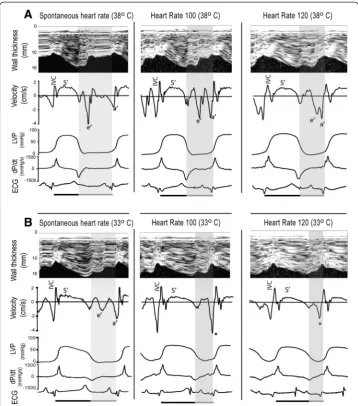
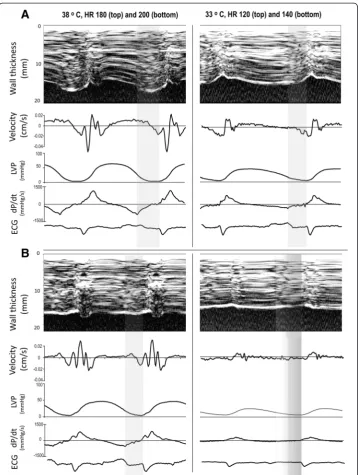
Figure 1Recordings from spontaneous and atrially paced heart rates during normo (A) and hypothermia (B).The upper images in each panel show M-mode recordings with corresponding wall thickening velocities synchronized with pressure measurements (LVP), dp/dt, and electrocardiogram (ECG) below. The shaded area represents diastole which is shortened both by pacing and hypothermia. Hypothermia reduced peak systolic thickening velocity (S′) and shifted the diastolic velocities from predominantly early (e′) towards late (atrial-induced) (a′). Pacing during hypothermia caused fusion of the e′and a′waves (marked by an asterisk). IVC, isovolumetric contraction.
each experiment was 560 min. The effects of temperature and heart rate changes were not dependent on the order of the temperature level.
Spontaneous heart rate
The results are summarized in Tables 1 and 2 and Figure 1. Reducing the temperature from 38 to 33°C decreased the spontaneous heart rate from 87 ± 10 to 76 ± 11 beats/ min. SV, EF, longitudinal and circumferential strain, PRSW, and EDV did not change. There was a small increase in EDWth. S′ and dP/dtmax decreased, demonstrating slower myocardial contraction. Systolic duration increased, and there was a small in-crease in end-systolic wall thickness (ESWth). ESP and Ea dein-creased, reflecting a reduc-tion in left ventricular afterload during hypothermia, which also was reflected by a reduction in P-Wth loop area. The peak LVP, MAP, and CO decreased while EDP in-creased, and systemic vascular resistance (SVR) did not change.
The diastolic changes have been reported in detail previously [22]. In summary, the absolute value of dP/dtmin and e′ decreased, whereasτ increased, reflecting slow and prolonged myocardial relaxation. The relative reduction in e′was not significantly dif-ferent from the relative reduction in S′, 35 ± 21 and 28 ± 15% (p= 0.24), respectively. There was a shift from predominately early to predominantly late ventricular filling with reversion of the E/A relationship (data not shown), and there was an increase in left ventricular stiffness [22], reflected by an increase in end-diastolic pressure-volume relationship (EDPVR) (Figure 2). Diastolic duration remained unchanged, making the diastole occupy a shorter part of the cardiac cycle, but allowed enough time for complete relaxation (3.5τ/DD < 1).
Paced heart rates
During normothermia, SV successively decreased at heart rates above 100 beats/min, and this was reflected by increases in EDWth at constant ESWth (Tables 1 and 2). The systolic variables PRSW, dP/dtmax, and S′did not change with increasing heart rates, whereas EF decreased at higher heart rates. During normothermia, CO increased slightly with increasing heart rates up to 120 beats/min and started to decline at heart rates above 140 beats/min. Peak LVP and MAP did not change, whereas SVR slightly decreased with increasing heart rates up to 140 beats/min (Table 1). ESP and Ea, how-ever, were unchanged up to a frequency of 120 beats/min. ESP decreased, and Ea in-creased when heart rate was inin-creased to 140 beats/min. EDP did not significantly change whereas EDV successively decreased at heart rates above 100 beats/min, making significant increases in EDPVR at higher heart rates (Figure 2).
During hypothermia, SV decreased successively with increases in heart rate, and in the mixed model analysis, heart rate had a significantly greater negative effect on SV during hypo than during normothermia (Figure 2). The changes in SV were reflected by increases in EDWth without changes in ESWth (Tables 1 and 2). PRSW did not change significantly in the mixed model analysis (Figure 2), but trended towards a de-crease. S′and dP/dtmax did not change upon increases in heart rate up to 120 beats/ min. EF decreased successively (Table 1). CO slightly increased when heart rate was in-creased to 100 beats/min, but dein-creased with further increases in heart rate (Table 1). MAP was not significantly changed whereas peak LVP slightly decreased when heart
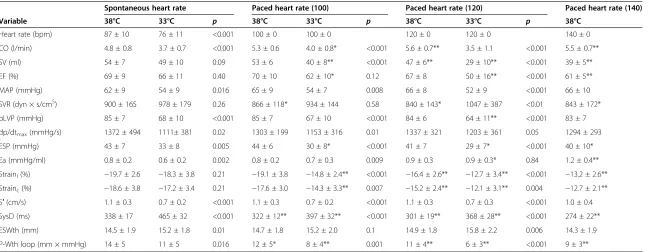
Table 1 Hemodynamic and systolic variables
Spontaneous heart rate Paced heart rate (100) Paced heart rate (120) Paced heart rate (140)
Variable 38°C 33°C p 38°C 33°C p 38°C 33°C p 38°C
Heart rate (bpm) 87 ± 10 76 ± 11 <0.001 100 ± 0 100 ± 0 120 ± 0 120 ± 0 140 ± 0
CO (l/min) 4.8 ± 0.8 3.7 ± 0.7 <0.001 5.3 ± 0.6 4.0 ± 0.8* <0.001 5.6 ± 0.7** 3.5 ± 1.1 <0.001 5.5 ± 0.7**
SV (ml) 54 ± 7 49 ± 10 0.09 53 ± 6 40 ± 8** <0.001 47 ± 6** 29 ± 10** <0.001 39 ± 5**
EF (%) 69 ± 9 66 ± 11 0.40 70 ± 10 62 ± 10* 0.12 67 ± 8 50 ± 16** <0.001 61 ± 5**
MAP (mmHg) 62 ± 9 54 ± 9 0.016 65 ± 9 54 ± 7 0.008 66 ± 8 52 ± 9 <0.001 66 ± 10
SVR (dyn × s/cm5) 900 ± 165 978 ± 179 0.26 866 ± 118* 934 ± 144 0.58 840 ± 143* 1047 ± 387 <0.01 843 ± 172*
pLVP (mmHg) 85 ± 7 68 ± 10 <0.001 85 ± 7 67 ± 10 <0.001 84 ± 6 64 ± 11** <0.001 83 ± 7
dp/dtmax(mmHg/s) 1372 ± 494 1111± 381 0.02 1303 ± 199 1153 ± 316 0.01 1337 ± 321 1203 ± 361 0.05 1294 ± 293
ESP (mmHg) 43 ± 7 33 ± 8 0.005 44 ± 6 30 ± 8* <0.001 41 ± 7 29 ± 7* <0.001 40 ± 10*
Ea (mmHg/ml) 0.8 ± 0.2 0.6 ± 0.2 0.002 0.8 ± 0.2 0.7 ± 0.3 0.009 0.9 ± 0.3 0.9 ± 0.3* 0.84 1.2 ± 0.4**
Strainl(%) −19.7 ± 2.6 −18.3 ± 3.8 0.21 −19.1 ± 3.8 −14.8 ± 2.4** <0.001 −16.4 ± 2.6** −12.7 ± 3.4** <0.001 −13.2 ± 2.6**
Strainc(%) −18.6 ± 3.8 −17.2 ± 3.4 0.21 −17.6 ± 3.0 −14.3 ± 3.3** 0.007 −15.2 ± 2.4** −12.1 ± 3.1** 0.004 −12.7 ± 2.1**
S′(cm/s) 1.1 ± 0.3 0.7 ± 0.2 <0.001 1.1 ± 0.3 0.7 ± 0.2 <0.001 1.1 ± 0.3 0.7 ± 0.3 <0.001 1.0 ± 0.4
SysD (ms) 338 ± 17 465 ± 32 <0.001 322 ± 12** 397 ± 32** <0.001 301 ± 19** 368 ± 28** <0.001 274 ± 22**
ESWth (mm) 14.5 ± 1.9 15.2 ± 1.8 0.01 14.7 ± 1.8 15.2 ± 2.0 0.1 14.9 ± 1.8 15.8 ± 2.2 0.006 14.3 ± 1.9
P-Wth loop (mm × mmHg) 14 ± 5 11 ± 5 0.016 12 ± 5* 8 ± 4** 0.001 11 ± 4** 6 ± 3** <0.001 9 ± 3**
Values are expressed as mean ± SD. *p≤0.05 for comparison with spontaneous heart rate within temperature level. **p≤0.01 for comparison with spontaneous heart rate within temperature level. CO, cardiac output; SV, stroke volume; EF, ejection fraction; MAP, mean arterial pressure; SVR, systemic vascular resistance; pLVP, peak left ventricular pressure; ESP, end-systolic pressure Ea, arterial elastance; Strainl, longitudinal strain; Strainc, circumferential strain; S′, peak systolic wall thickening velocity; SysD, systolic duration; ESWth, end-systolic wall thickness; P-Wth loop, left ventricular pressure-wall thickness loop area.
Kerans
et
al.
Intensive
Care
Medicine
Experimenta
l
(2015) 3:6
Page
7
of
Table 2 Diastolic variables
Spontaneous heart rate Paced heart rate (100) Paced heart rate (120) Paced heart rate (140)
Variable 38°C 33°C p 38°C 33°C p 38°C 33°C p 38°C
EDP (mmHg) 10 ± 3 12 ± 2 0.004 10 ± 3 12 ± 3 0.09 10 ± 2 13 ± 4 0.002 12 ± 3
EDV (ml) 79 ± 10 75 ± 11 0.26 77 ± 11 64 ± 9** 0.002 69 ± 8** 57 ± 6** <0.001 64 ± 8**
EDWth (mm) 10.6 ±1.5 11.1 ± 1.5 0.003 11.0 ± 1.4** 11.9 ± 2.0* 0.02 11.1 ± 1.5** 12.4 ± 2.2** 0.02 11.0 ± 2.0**
Tau (s) 31 ± 6 54 ± 12 <0.001 35 ± 8 61 ± 18 0.001 29 ± 4 53 ± 13 <0.001 29 ± 4
dp/dtmin(mmHg/s) −1385 ± 529 −742 ± 328 <0.001 −1190 ± 437 −773 ± 257 0.005 −1324 ± 426 −670 ± 332** <0.001 −1476 ± 555
e' (cm/s) −2.5 ± 0.9 −1.6 ± 0.7 0.002 −2.3 ± 0.5 −1.9 ± 0.6
DD (ms) 319 ± 79 299 ± 88 0.26 281 ± 11* 199 ± 35** <0.001 199 ± 14** 142 ± 25** <0.001 148 ± 23**
DD/CycleD 0.48 ± 0.05 0.38 ± 0.07 <0.001 0.47 ± 0.02 0.33 ± 0.04** <0.001 0.40 ± 0.03** 0.28 ± 0.05** <0.001 0.34 ± 0.05**
3.5tau/DD 0.36 ± 0.11 0.72 ± 0.35 0.001 0.44 ± 0.10** 1.10 ± 0.32** <0.001 0.52 ± 0.09** 1.38 ± 0.49** <0.001 0.69 ± 0.15**
Values are expressed as mean ± SD. *p≤0.05 for comparison with spontaneous heart rate within temperature level. **p≤0.01 for comparison with spontaneous heart rate within temperature level. EDP, end-diastolic pressure; EDV, end-diastolic volume; EDWth, end-diastolic wall thickness; e′, early wall thinning velocity; DD, diastolic duration; DD/CycleD, diastolic fraction of cardiac cycle duration.
Kerans
et
al.
Intensive
Care
Medicine
Experimenta
l
(2015) 3:6
Page
8
of
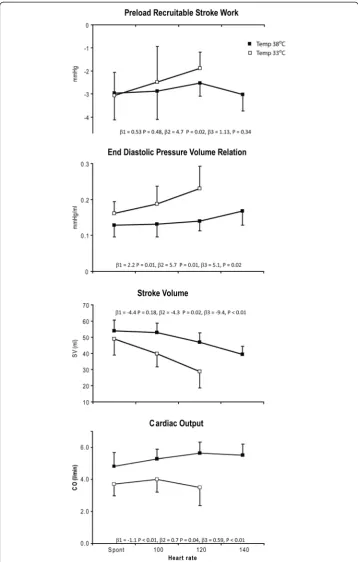
Figure 2PRSW, EDPVR, SV, and CO.Changes in preload recruitable stroke work, end-diastolic pressure volume relation, stroke volume, and cardiac output at spontaneous and paced heart rates (HR) during normo (■) and hypothermia (□). The effect of HR and temperature were analyzed in a mixed model analysis in which variable =β+β1(temperature) +β2(HR) +β3(temperature × HR). Coefficients andpvalues are
given for each variable.
rate was increased to 120 beats/min. SVR did not change, whereas Ea slightly increased with increasing heart rates. EDP did not significantly increase, but EDV decreased suc-cessively with a significantly greater effect on the EDPVR during hypo than normother-mia (Figure 2).
Both systolic and diastolic duration, diastolic fraction of the cardiac cycle, and the ab-solute values of longitudinal and circumferential strain decreased with increasing heart rate, but significantly more during hypothermia (Tables 1 and 2). The decreases in strain paralleled the decreases in diastolic filling (EDV and EDWth) and SV. The abso-lute value of dP/dtmin did not change during pacing at normothermia, but decreased when heart rate was increased to 120 beats/min during hypothermia. τ, however, was not influenced by heart rate neither during normo nor hypothermia. Due to fusion of the e′and a′waves (Figure 1), e′could not be measured during pacing at hypothermia. During normothermia, the e′ and a′waves were still separated at a frequency of 100 and partly separated at 120 beats/min, and e′was not significantly changed by pacing (Table 2). During normothermia, 3.5τ/DD < 1 at all comparable pacing rates allowing enough time to complete relaxation. During hypothermia, however, 3.5τ/DD exceeded unity at all pacing rates, making the diastole to short for complete relaxation and filling (Table 2).
The tolerance to increases in heart rate was significantly reduced during hypothermia (p= 0.01). At normothermia, all 11 pigs tolerated a paced frequency of 140, seven pigs tolerated 160, and four tolerated 180 beats/min. During hypothermia, all pigs tolerated 120 beats/min, eight pigs tolerated 140, and three tolerated 160 beats/min. Because of variations in heart rate tolerability between individual animals, we made comparisons with penultimate and ultimate tolerable heart rates to detect physiological changes oc-curring close to the toleration limit both during normo and hypothermia. These data are shown in Figure 3. S′significantly decreased both at penultimate and ultimate heart rates during hypothermia, but there were no statistically significant decrease during normothermia (p= 0.20). ESWTh was unchanged during normothermia (p= 0.54), and the decrease during hypothermia was not statistically significant (p= 0.11). There was a further, but not statistically significant (p= 0.15), increase inτat the ultimate heart rate during hypothermia, reflecting further reduction in relaxation velocity parallel to the reduction in contraction velocity. Taken together with a further increase in EDPVR, this indicates maintained ventricular contraction throughout diastole.
Discussion
Systolic contraction velocity was slowed during therapeutic hypothermia, but compen-sated for by prolongation of systolic duration, and systolic function assessed by ESWth (end-systolic volume (ESV)) and PRSW was well preserved, but not increased at any heart rate. Therapeutic hypothermia impaired the tolerance to increasing heart rates in-duced by atrial pacing, by impeding diastolic filling due to slow relaxation and succes-sive shortening of diastolic duration. Pacing itself had no effect on myocardial velocities, except during hypothermia at heart rates close to the toleration limit, where contraction and relaxation velocities further decreased. The latter is probably related to impaired myocardial perfusion due to shortness of diastolic duration and incomplete diastolic relaxation with persisting myocardial contraction at end diastole.
Spontaneous heart rate
The kinetics of cardiac contraction and relaxation are tightly linked during different physiological conditions [23], and the parallel decreases in systolic and diastolic veloci-ties during hypothermia are in agreement with these findings.
During hypothermia, the slower myocardial contraction measured by systolic wall thickening velocity was compensated for by prolonged systolic duration, allowing enough time to maintain SV, EF, and strain. Reduced afterload may have facilitated ven-tricular ejection as indicated by a small increase in ESWth and thus masked a systolic dysfunction, but no change in the load independent variable PRSW indicated preserved pump function. This is in contrast to improved systolic function found by Post and co-workers [14]. Going into their study in more detail reveals that their conclusion of in-creased inotropy at 33°C was based on a leftward shift of the end-systolic pressure volume relationship (end-systolic elastance) during ventricular unloading at a paced heart rate of
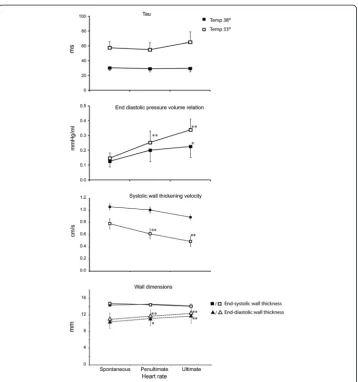
Figure 3Tau, end-diastolic pressure volume relation, systolic wall thickening velocity, and left ventricular wall dimensions.Changes in tau, end-diastolic pressure volume relation, systolic wall thickening velocity, and left ventricular wall dimensions during spontaneous, penultimate, and ultimate tolerable heart rates at normo- (closed symbols) and hypothermia (open symbols). *p≤0.05 for comparison with spontaneous heart rate within temperature level. **p≤0.01 for comparison with spontaneous heart rate within temperature level.
100 beats/min. There was no change in PRSW. Similar to our present and previous study [22], they found that hypothermia increased passive ventricular stiffness and increased ventricular stiffness increases end-systolic elastance even at depressed contractility [24]. Increased ventricular stiffness may also resist dynamic ventricular contraction and thus obscure a hypothermia-induced increase in contractile force.
This may, at least partly, explain the difference between the in situ heart and isolated cardiac trabeculae which have little supportive tissue and where only isometric con-tractile force is measured [16].
Although slow relaxation was not compensated for by a corresponding increase in diastolic duration, there was enough time for complete relaxation and filling demon-strated by 3.5τ/DD < 1 and maintained EDV. EDWth, however, increased slightly, indi-cating a small reduction in diastolic filling that could not be detected by the biplane Simpson method. Increased wall stiffness is probably the cause of this small decrease in diastolic filling and is supported by the increase in EDPVR.
Paced heart rates
PRSW was not significantly reduced during pacing, and the tolerance to increases in heart rate seemed mainly to be limited by diastolic filling. Atrial pacing not only re-duced diastolic duration but also successively rere-duced the diastolic fraction of the car-diac cycle, and both absolute and relative diastolic shortening were accentuated by hypothermia (Table 2). Time for complete relaxation (3.5τ/DD < 1) was achieved during pacing at normothermia, but incomplete filling with reduced EDV and SV occurred at higher heart rates. During hypothermia, incomplete relaxation (3.5τ/DD > 1) and filling occurred at all pacing rates with a much greater impact on EDV and SV than during normothermia (Figure 2 and Table 2). The changes in longitudinal and circumferential strain paralleled the changes in EDV and SV in agreement with the findings of others [25]. These changes were accompanied by reductions in EF which occurred already at a heart rate of 100 beats/min during hypothermia. During normothermia, a significant reduction in EF was observed at 140 beats/min. Clinically, EF is mainly used to evaluate systolic performance, and a reduced EF is a measure of systolic dysfunction. In the present setting, however, it mainly represents diastolic filling. The ESWTh was un-changed during pacing at both temperatures indicating adequate emptying of the LV and a constant ESV. At constant ESV, EF is only dependent on EDV and implies that any reduction in EDV will result in a reduction in EF. Comparing the frequency of 100 beats/min during hypothermia with the frequency of 140 during normothermia demon-strates similar EDV, SV, and hence EF.
With the possible exception for the ultimate tolerable heart rate, the slower S′during hypothermia did not significantly affect systolic emptying, demonstrating that systolic duration was long enough to adequately empty the heart from the actual EDV. This prolongation of systole at the expense of diastole during hypothermia seems to be an inappropriate response to pacing induced increases in heart rate. Successive shortening of diastolic duration with incomplete relaxation and persisting myocardial contraction throughout diastole as demonstrated by successive increases in EDPVR (Figure 3) could jeopardize myocardial perfusion and thus be responsible for the further slowing of S′at the penultimate and ultimate tolerable heart rates and the parallel increase in τ. This is
in accordance with results from isolated myocardial muscle strips from both experi-mental animals and explanted failing human hearts where increased diastolic force was demonstrated during hypothermia [16,26]. In explanted human hearts at a temperature of 33°C, increased diastolic force occurred already at a frequency of 1 Hz [26]. In ex-perimental animals, diastolic force occurred at supra-physiological frequencies accom-panied by reductions in developed force during systole [16] which approximated zero as diastolic force continued to increase towards ultimate tolerable heart rates [27]. EDP did not change in the present study, and the increase in EDPVR is only due to reduced EDV. Diastolic LVP has to be lower than peak atrial pressure for the mitral valve to open, and diastolic filling approaches zero when these two pressures almost equals dur-ing ultra-short diastolic duration and maintained diastolic contraction. An M-mode picture of the not tolerated heart rate is shown in Figure 4 demonstrating almost ab-sence of diastolic wall thinning both during normo and hypothermia.
Methodological considerations
The regional measurements from the epicardial transducers were used to estimate glo-bal myocardial changes. There is no data to indicate that therapeutic hypothermia should have different effects in various regions of the healthy myocardium and there was accordance between the epicardial and global 2D echocardiographic recordings as also demonstrated previously [22]. The parallel changes in strain and SV also support the global nature of the hypothermic changes. The epicardial transducer was also used to obtain serial recordings during transient volume unloading, and PRSW were esti-mated from these recordings. Glower and co-workers [28] demonstrated highly linear relationships between stroke work and preload whether preload was measured as global EDV or regional end-diastolic segment length by sonomicrometry. Even if the magni-tude of systolic wall thickening is substantially greater than segment length shortening [29], the linearity of responses to variations in preload was equivalent (r2= 0.88 ± 0.11), making the P-Wth loops good estimates of myocardial work.
Clinical implications
Cardiac performance was well maintained during hypothermia at spontaneous heart rate, but at a less afterload and, hence, stroke work. Reduced workload may be import-ant for the injured or failing heart, and therapeutic hypothermia may thus have favor-able effects on both cardiac and systemic oxygen supply-demand balance and contribute to the good outcome observed in patients with cardiogenic shock after OHCA [30]. Similarly, for hearts suffering from post cardiac surgery dysfunction, thera-peutic hypothermia for the first postoperative hours might be beneficial provided that heart rate is not inadequately increased by pacing. Even not intended, patients are often mildly hypothermic immediately after cardiac surgery. These patients are often paced by an epicardial pacemaker when bradycardia occurs. The present study indicates that mild bradycardia is probably acceptable. One should, however, be cautious to increase the frequency above the normal resting heart rate range.
The Doppler recordings demonstrated diastolic dysfunction at spontaneous heart rate, and 2D echocardiography showed reduced EF at increased heart rates during hypothermia. These findings indicate that interpretation of echocardiographic assessments of cardiac
function is more complicated in hypothermic patients. The echocardiographic findings may at least partly be due to the hypothermia itself and will be reversed during rewarming.
Limitations
We did not obtain pre-hypothermia and post-hypothermia recordings at 38°C in each animal, but we did perform the intervention in reverse order in four of the animals. The effects of hypothermia returned to normal after warming to 38°C, and the order of the intervention did not prove significant in the mixed model analysis. Deep
Figure 4Recordings from the ultimate tolerable (A) and the following not tolerable heart rate (B) during normo (left) and hypothermia (right).For explanation, see Figure 1.
hypothermia reduces both systolic and diastolic function, and in a similar pig model, systolic function was only partially reversed after rewarming from 25°C. Diastolic func-tion, however, reversed completely [31]. In our study, systolic performance estimated by PRSW was minimally affected by hypothermia, and thus, little to reverse. Both sys-tolic and diassys-tolic velocities increased to anticipated values when the four animals were warmed from therapeutic hypothermia.
Deep anesthesia reduces the sympathetic response to hypothermia, and no changes in plasma catecholamines were observed, similar to the findings of Filseth and co-workers [31]. However, we do not know if the cardiodepressive effects of anesthesia are different during hypothermia. The use of volatile anesthetics is based on continuous measurements of alveolar concentrations and is easily adjusted. Hence, it is not influ-enced by metabolic effects of hypothermia, but the plasma morphine concentrations may have increased despite adjustments. However, deep anesthesia including opiates is routinely used during therapeutic hypothermia after OHCA and during cardiac surgery, making this experimental study close to these clinical settings.
Conclusions
Therapeutic hypothermia during anesthesia reduces velocities of contraction and relax-ation. Slow contraction is compensated for by prolongation of systole at all heart rates maintaining adequate emptying of the LV, and the ability to generate work is not re-duced. Slow relaxation leads to diastolic dysfunction with reduced tolerance to pacing induced increases in heart rate because of reduced diastolic filling and sustained dia-stolic contraction at higher heart rates. Echocardiographic measurements of cardiac function in hypothermic patients should be interpreted cautiously because apparent systolic and diastolic dysfunction may at least partly, be due to effects caused by transi-ent hypothermia.
For the following variables, a more detailed explanation is given as follows:
Abbreviation/variable/measurement/meaning
Ea/arterial elastance/calculated: Ea = ESP / SV/estimation of LV afterload
EF/ejection fraction/calculated: EF = SV / EDV/the fraction of EDV ejected during systole EDV/end-diastolic volume/2D echocardiography (Simpson's biplane method)/marker of cardiac filling at end of diastole.
EDWth/end-diastolic wall thickness/ultrasonography (miniaturized transducer)/LV wall thickness at end of diastole as a marker of cardiac filling
ESWth/end-systolic wall thickness/ultrasonography (miniaturized transducer)/LV wall thickness at end of systole as a marker of systolic emptying of LV
P-Wth loop/pressure-wall thickness loop/micromanometer and ultrasonography/the relationship between LV pressure and wall thickness through one cardiac cycle. The loop area is an estimate of regional myocardial stroke work
PRSW/preload recruitable stroke work/micromanometer and ultrasonography/the relationship between EDWth and P-Wth loop area during diastolic unloading (caval vein constriction) as a marker of myocardial force (inotropy).
e′/early LV wall thinning velocity/ultrasonography (miniaturized transducer)/LV wall thinning velocity during early diastolic filling as a marker of diastolic function
a′/late LV wall thinning velocity/ultrasonography (miniaturized transducer)/LV wall thinning velocity during atrial contraction
S′/peak systolic LV wall thickening velocity/ultrasonography (miniaturized transducer)/ a marker of contractile function
τ/tau: left ventricular relaxation time constant/micromanometer/a measure of LV myocardial relaxation during diastole
Abbreviations
CI:cardiac index; CO: cardiac output; CPB: cardiopulmonary bypass; DD: diastolic duration; EDP: end-diastolic pressure; ESP: end-systolic pressure; HR: heart rate; LV: left ventricle; LVP: left ventricular pressure; MAP: mean arterial pressure; OHCA: out-of-hospital cardiac arrest; SV: stroke volume.
Competing interests
The authors declare that they have no competing interests.
Authors' contributions
VK participated in planning and performing the experiments, analysis of results, and drafting of the manuscript. AE participated in performing the experiments, recording and analysis of miniaturized ultrasound data, and statistical analysis, and critically reviewed the manuscript. HS participated in performing the experiments and recording and analysis of 2D echocardiography data, and critically reviewed the manuscript. PSH participated in planning and performing the experiments and critically reviewed the manuscript. TE participated in planning of the study and critically reviewed the manuscript. JFB conceived the study, participated in planning and performing the experiments, and recording and analysis of data, and helped in drafting the manuscript. All authors read and approved the final manuscript.
Acknowledgements
The work was performed at the Intervention Centre at Rikshospitalet, Oslo University Hospital. Departmental funds from the Intervention Centre and the Department of Anesthesiology, Oslo University Hospital, supported the costs of the experiments.
Author details
1Department of Anesthesiology, Rikshospitalet, Division of Emergencies and Critical Care, Oslo University Hospital,
Postbox 4950, Nydalen, N-0424 Oslo, Norway.2Institute of Clinical Medicine, Faculty of Medicine, University of Oslo,
Oslo, Norway.3The Intervention Centre, Rikshospitalet, Oslo University Hospital, Oslo, Norway.4Department of
Cardiology, Rikshospitalet, Oslo University Hospital, Oslo, Norway.5Department of Research and Development, Division
of Emergencies and Critical Care, Oslo University Hospital, Oslo, Norway.
Received: 26 September 2014 Accepted: 15 January 2015
References
1. Bernard SA, Gray TW, Buist MD, Jones BM, Silvester W, Gutteridge G, Smith K (2002) Treatment of comatose survivors of out-of-hospital cardiac arrest with induced hypothermia. N Engl J Med 346:557–563
2. Hypothermia after cardiac arrest study group (2002) Mild therapeutic hypothermia to improve the neurologic outcome after cardiac arrest. N Engl J Med 346:549–556
3. Nielsen N, Wetterslev J, Cronberg T, Erlinge D, Gasche Y, Hassager C, Horn J, Hovdenes J, Kjaergaard J, Kuiper M, Pellis T, Stammet P, Wanscher M, Wise MP, Aneman A, Al-Subaie N, Boesgaard S, Bro-Jeppesen J, Brunetti I, Bugge JF, Hingston CD, Juffermans NP, Koopmans M, Kober L, Langorgen J, Lilja G, Moller JE, Rundgren M, Rylander C, Smid O, Werer C, Winkel P, Friberg H (2013) Targeted temperature management at 33 degrees C versus 36 degrees C after cardiac arrest. N Engl J Med 369:2197–2206
4. Schmidt-Schweda S, Ohler A, Post H, Pieske B (2013) Moderate hypothermia for severe cardiogenic shock (COOL Shock Study I & II). Resuscitation 84:319–325
5. Zobel C, Adler C, Kranz A, Seck C, Pfister R, Hellmich M, Kochanek M, Reuter H (2012) Mild therapeutic hypothermia in cardiogenic shock syndrome. Crit Care Med 40:1715–1723
6. Schwarzl M, Huber S, Maechler H, Steendijk P, Seiler S, Truschnig-Wilders M, Nestelberger T, Pieske BM, Post H (2012) Left ventricular diastolic dysfunction during acute myocardial infarction: effect of mild hypothermia. Resuscitation 83:1503–1510
7. Schwarzl M, Steendijk P, Huber S, Truschnig-Wilders M, Obermayer-Pietsch B, Maechler H, Pieske B, Post H (2011) The induction of mild hypothermia improves systolic function of the resuscitated porcine heart at no further sympathetic activation. Acta Physiol 203:409–418
8. Dae MW, Gao DW, Sessler DI, Chair K, Stillson CA (2002) Effect of endovascular cooling on myocardial temperature, infarct size, and cardiac output in human-sized pigs. Am J Physiol Heart Circ Physiol 282:H1584–H1591
9. Bergman R, Braber A, Adriaanse MA, Van VR, Tjan DH, Van Zanten AR (2010) Haemodynamic consequences of mild therapeutic hypothermia after cardiac arrest. Eur J Anaesthesiol 27:383–387
10. Kuwagata YM, Oda JM, Ninomiya NM, Shiozaki TM, Shimazu TM, Sugimoto HM (1999) Changes in left ventricular performance in patients with severe head injury during and after mild hypothermia. J Trauma 47:666–672 11. Lewis ME, Al Khalidi AH, Townend JN, Coote J, Bonser RS (2002) The effects of hypothermia on human left
ventricular contractile function during cardiac surgery. J Am Coll Cardiol 39:102–108
12. Greene PS, Cameron DE, Mohlala ML, Dinatale JM, Gardner TJ (1989) Systolic and diastolic left ventricular dysfunction due to mild hypothermia. Circulation 80:III44–III48
13. Weisser J, Martin J, Bisping E, Maier LS, Beyersdorf F, Hasenfuss G, Pieske B (2001) Influence of mild hypothermia on myocardial contractility and circulatory function. Basic Res Cardiol 96:198–205
14. Post H, Schmitto J, Steendijk P, Christoph J, Holland R, Wachter R, Schondube FW, Pieske B (2010) Cardiac function during mild hypothermia in pigs: increased inotropy at the expense of diastolic dysfunction. Acta Physiol 199:43–52 15. He X, Su F, Taccone FS, Maciel LK, Vincent JL (2012) Cardiovascular and microvascular responses to mild
hypothermia in an ovine model. Resuscitation 83:760–766
16. Hiranandani N, Varian KD, Monasky MM, Janssen PML (2006) Frequency-dependent contractile response of iso-lated cardiac trabeculae under hypo-, normo-, and hyperthermic conditions. J Appl Physiol 100:1727–1732 17. Polderman KH (2009) Mechanisms of action, physiological effects, and complications of hypothermia. Crit Care
Med 37:S186–S202
18. Moore EM, Nichol AD, Bernard SA, Bellomo R (2011) Therapeutic hypothermia: benefits, mechanisms and potential clinical applications in neurological, cardiac and kidney injury. Injury 42:843–854
19. Espinoza A, Halvorsen PS, Hoff L, Skulstad H, Fosse E, Ihlen H, Edvardsen T (2010) Detecting myocardial ischaemia using miniature ultrasonic transducers—a feasibility study in a porcine model. Eur J Cardiothorac Surg 37:119–126 20. Weiss JL, Frederiksen JW, Weisfeldt ML (1976) Hemodynamic determinants of the time-course of fall in canine left
ventricular pressure. J Clin Invest 58:751–760
21. Weisfeldt ML, Frederiksen JW, Yin FC, Weiss JL (1978) Evidence of incomplete left ventricular relaxation in the dog: prediction from the time constant for isovolumic pressure fall. J Clin Invest 62:1296–1302
22. Espinoza A, Kerans V, Opdahl A, Skulstad H, Halvorsen PS, Bugge JF, Fosse E, Edvardsen T (2013) Effects of therapeutic hypothermia on left ventricular function assessed by ultrasound imaging. J Am Soc Echocardiogr 26:1353–1363
23. Janssen PML (2010) Kinetics of cardiac muscle contraction and relaxation are linked and determined by properties of the cardiac sarcomere. Am J Physiol Heart Circ 299:H1092–H1099
24. Borlaug BA, Paulus WJ (2011) Heart failure with preserved ejection fraction: pathophysiology, diagnosis, and treatment. Eur Heart J 32:670–679
25. Weidemann F, Jamal F, Sutherland GR, Claus P, Kowalski M, Hatle L, De Scheerder I, Bijnens B, Rademakers FE (2002) Myocardial function defined by strain rate and strain during alterations in inotropic states and heart rate. Am J Physiol Heart Circ 283:H792–H799
26. Jacobshagen C, Pelster T, Pax A, Horn W, Schmidt-Schweda S, Uns+Âld B, Seidler T, Wagner S, Hasenfuss G, Maier L (2010) Effects of mild hypothermia on hemodynamics in cardiac arrest survivors and isolated failing human myocardium. Clin Res Cardiol 99:267–276
27. Slabaugh JLB (2012) Contractile parameters and occurrence of alternans in isolated rat myocardium at supra-physiological stimulation frequency. Am J Physiol Heart Circ 302:H2267–H2275
28. Glower DD, Spratt JA, Snow ND, Kabas JS, Davis JW, Olsen CO, Tyson GS, Sabiston DC, Rankin JS (1985) Linearity of the Frank-Starling relationship in the intact heart: the concept of preload recruitable stroke work. Circulation 71:994–1009
29. Rademakers FE, Rogers WJ, Guier WH, Hutchins GM, Siu CO, Weisfeldt ML, Weiss JL, Shapiro EP (1994) Relation of regional cross-fiber shortening to wall thickening in the intact heart Three-dimensional strain analysis by NMR tagging. Circulation 89:1174–1182
30. Hovdenes J, Laake JH, Aaberge L, Haugaa H, Bugge JF (2007) Therapeutic hypothermia after out-of-hospital cardiac arrest: experiences with patients treated with percutaneous coronary intervention and cardiogenic shock. Acta Anaesthesiol Scand 51:137–142
31. Filseth OM, How OJ, Kondratiev T, Gamst TM, Tveita T (2010) Post-hypothermic cardiac left ventricular systolic dysfunction after rewarming in an intact pig model. Crit Care 14:R211
Submit your manuscript to a
journal and benefi t from:
7Convenient online submission
7Rigorous peer review
7Immediate publication on acceptance
7Open access: articles freely available online
7High visibility within the fi eld
7Retaining the copyright to your article
Submit your next manuscript at 7 springeropen.com