H O W I D O I T A R T I C L E
Open Access
Accurate assessment of LV function using
the first automated 2D-border detection
algorithm for small animals - evaluation
and application to models of LV
dysfunction
Jana Grune
1,2, Daniel Ritter
2,3, Kristin Kräker
2,4,5,6,12, Kathleen Pappritz
2,7, Niklas Beyhoff
2,3, Till Schütte
2,3,5,12,
Christiane Ott
2,8, Cathleen John
2,8, Sophie van Linthout
2,7,9, Carsten Tschöpe
2,7,9, Ralf Dechend
2,4,5,6,10,
Dominik N. Muller
2,4,5,6,12, Nadine Haase
2,4,5,6,12, Tilman Grune
2,8,11, Ulrich Kintscher
2,3and
Wolfgang M. Kuebler
1,2,13*Abstract
Echocardiography is the most commonly applied technique for non-invasive assessment of cardiac function in small animals. Manual tracing of endocardial borders is time consuming and varies with operator experience. Therefore, we aimed to evaluate a novel automated two-dimensional software algorithm (Auto2DE) for small animals and compare it to the standard use of manual 2D-echocardiographic assessment (2DE). We hypothesized that novel Auto2DE will provide rapid and robust data sets, which are in agreement with manually assessed data of animals.
2DE and Auto2DE were carried out using a high-resolution imaging-system for small animals. First, validation cohorts of mouse and rat cine loops were used to compare Auto2DE against 2DE. These data were stratified for image quality by a blinded expert in small animal imaging. Second, we evaluated 2DE and Auto2DE in four mouse models and four rat models with different cardiac pathologies.
Automated assessment of LV function by 2DE was faster than conventional 2DE analysis and independent of operator experience levels. The accuracy of Auto2DE-assessed data in healthy mice was dependent on cine loop quality, with excellent agreement between Auto2DE and 2DE in cine loops with adequate quality. Auto2DE allowed for valid detection of impaired cardiac function in animal models with pronounced cardiac phenotypes, but yielded poor performance in diabetic animal models independent of image quality.
Auto2DE represents a novel automated analysis tool for rapid assessment of LV function, which is suitable for data acquisition in studies with good and very good echocardiographic image quality, but presents systematic problems in specific pathologies.
Keywords:Echocardiography, Automated border detection, LV systolic function, Small animals
© The Author(s). 2019Open AccessThis article is distributed under the terms of the Creative Commons Attribution 4.0 International License (http://creativecommons.org/licenses/by/4.0/), which permits unrestricted use, distribution, and reproduction in any medium, provided you give appropriate credit to the original author(s) and the source, provide a link to the Creative Commons license, and indicate if changes were made. The Creative Commons Public Domain Dedication waiver (http://creativecommons.org/publicdomain/zero/1.0/) applies to the data made available in this article, unless otherwise stated.
* Correspondence:[email protected] 1
Institute of Physiology, Charité-Universitätsmedizin Berlin, Charitéplatz 1, 10117 Berlin, Germany
2German Centre for Cardiovascular Research (DZHK), partner site Berlin,
10117 Berlin, Germany
Introduction
Echocardiography is the standard of use for the assess-ment of left ventricular (LV) function in clinical routine
and basic research [1, 2]. Despite recommendations for
the use of three-dimensional echocardiography (3DE)
[3], two-dimensional echocardiography (2DE) still
pre-sents a relatively inexpensive, straightforward and time saving method for the non-invasive assessment of LV function as compared to 3DE and gold-standard cardiac magnetic resonance imaging (CMR) and is therefore
often the method of choice [1,2]. Typically, 2DE analysis
in small animals is based on the traditional monoplane
Simpson’s method of discs where endocardial border
regions are traced in a single image plane, usually the
max-imum dimension of the LV [4]. The procedure of
endocar-dial border tracing has to be repeated in end-systolic and end-diastolic frames to allow the calculation of e.g. LV ejection fraction (EF), a key parameter for diagnosis,
man-agement and treatment of cardiac pathologies [2, 3, 5].
Despite the seeming simplicity of 2DE analysis, large inter-individual variabilities have been reported for this analysis
in both humans and small animals [6–8]. Moreover,
quanti-tative analysis of 2DE is highly dependent on operator ex-perience and analysis of imaging data requires a significant investment of time, especially for basic research studies with large n-numbers [9].
Required operator experience and time consumption, the major drawbacks of conventional 2DE analysis, might be overcome with the use of novel automated software tools. Automated software approaches have been used earlier in clinical research and demonstrated rapid and reproducible assessment of LV function with very good agreements between automated software tools and
manually assessed results [2, 9–12]. Advancements in
ultrasound technology recently also paved the way for the first automated 2D-border detection algorithm (Auto2DE, FUJIFILM VisualSonics, Toronto, Ontario, Canada) for the assessment of LV systolic function in small animals. Auto2DE represents a clinically proven edge-matching algorithm trained with a library of over 200 expertly curated LV analysis traces. Cine loops of choice are automatically tested against this library, resulting in the generation of a potentially user-modifiable tracing of LV endocardial borders across an automatically selected series
of frames (Fig. 1a). While the advantages of such a novel
automated algorithm for basic research cannot be over-stressed, its usefulness critically depends on its ability to yield valid and reproducible data and its ability for rapid data analysis independent of observer experience.
To our knowledge, this automated software approach for small animals has not been evaluated to date. In the present study we therefore utilized novel Auto2DE for the assessment of LV function and compared obtained values with manually 2DE-assessed data in healthy and
diseased animals. We hypothesized that Auto2DE is able to rapidly provide accurate data, which correlate well with 2DE values. We also speculated that the strength of this relationship is likely dependent on image quality, which may limit Auto2DE performance in severe cardiac pathologies.
Material and methods
All animal procedures were performed in accordance with the German Law on Protection of Animals and according to the European legislation (Directive 2010/ 63/EU) and were approved by the local authorities (Landesamt für Gesundheit und Soziales, Berlin, Germany). Animals used in this study served as controls in on-going projects or were partly already described in re-cent publications (transverse aortic constriction (TAC), Isoproterenol-induced subendocardial fibrosis (Fib) and a double-transgenic rat model of heart failure with preserved ejection fraction (HFpEF; dTGR cohorts)) [7,13,14].
Validation cohorts in mice and rats
Animals were kept under identical housing conditions (12 h light/dark cycle, standard diet ad libitum, 21 °C room temperature) prior to echocardiographic assessment.
Echocardiographic data sets from 13 healthy male
con-trol mice (strain: Ncor1tm1Anh/J (the Jackson Laboratory,
JAX stock #017632) were used as murine validation cohort. Each individual mouse was imaged fourfold at the age of 8, 12, 15, and 18 weeks. From the resulting 52 echocardiographic data sets 2 were rated with image quality Q4 (for details see Assessment of image quality-section below) and therefore excluded from further analysis, the remaining 50 data sets entered further analysis.
For the rat validation cohort, a set of 14 echocardio-graphic cine loops from 14 healthy rats (strain: sprague dawley rat, Max-Delbrück Center; 7 and 18 weeks of age) was used.
Cardiovascular disease models
For induction of type I diabetes mellitus (DM), male Ncor1tm1Anh/J mice (8–9 weeks) were injected with
streptozotocin (50 mg/kg/d STZ,n= 12) or vehicle (Ctrl,
n = 14) for 5 consecutive days. Animals were starved
prior to STZ- or vehicle injections for 4 h. Blood glucose levels were determined with a Contour XT glucose meter (Bayer Health Care; Leverkusen, Germany). Echo-cardiography and blood glucose measurements were performed 12 weeks after DM induction.
As model of type II DM, homozygous BKS.Cg-m
+/+Leprdb/BomTac (db+/db+, n = 15) mice (Taconic;
Skensved, Denmark) carrying a leptin receptor mutation
were used. Heterozygous (db+/db−) littermates served as
was performed and blood glucose levels were determined by Accu-Chek Aviva® (Roche Diabetes Care Deutsch-land GmbH; Mannheim, Germany) after 4 h fasting.
With respect to Table2, values for heart weight (HW),
body weight (BW) and Heart-weight-to-body-weigh-t-ratios (HW/BW) were reported at 24 weeks of age.
Subendocardial fibrosis was modeled as described previ-ously by us [13,15]. In brief, 6–8 weeks old male 129/Sv
mice (n = 9, Janvier Labs; LeGenest-Saint-Isle, France)
were injected s.c. with isoproterenol (Fib, 25 mg/kg/d; dissolved in saline) or vehicle (saline,n= 10) for four con-secutive days. Echocardiographic examinations were
per-formed 12–13 days after the final treatment, and final
necropsy was performed on day 14.
Mechanical loading as a model of LV failure was
induced in male C57BL/6 J mice (8–9 weeks, n = 9)
by transverse aortic constriction (TAC) as previously
reported by us [7, 16]. SHAM-operated animals
Auto2DE Expert Trained Beginner
1 2 4 8 16 32 64 128 256
Mouse
T
raci
n
g
T
im
e
(sec
)
(32)
3.8
41.2
(18) (81) (37)
24.7
175
2DE
Auto2DE Expert Trained Beginner
1 2 4 8 16 32 64
Rat
T
raci
ng
Time
(sec
)
(26) (20) (26) (64)
2.6
31.5 19.6
48.4
2DE
M ouse Rat
A
B
C
D
E
Basal
Merge 2DE
End-Diastole Mid-Systole End-Systole
Auto2DE
7 frames 7 frames
Mouse Rat
End-Diastole Mid-Systole End-Systole
4 frames 3 frames
Basal
Merge 2DE Auto2DE
5.1%
-3.2%
-13.2%
-9.9% -17.7%
-13.5%
0 10 20 30 40 50 60 70 ESV (µl)
EDV (µl)
SV (µl)
EF (%) FS (%)
CO (ml/min)
Auto2DE 2DE
(n=52)
66.8%
29.0%
4.5%
-22.7% -35.4%
4.0%
0 100 200 300 400 500
ESV (µl)
EDV (µl)
SV (µl)
EF (%) FS (%)
CO (ml/min)
Auto2DE 2DE
(n=14)
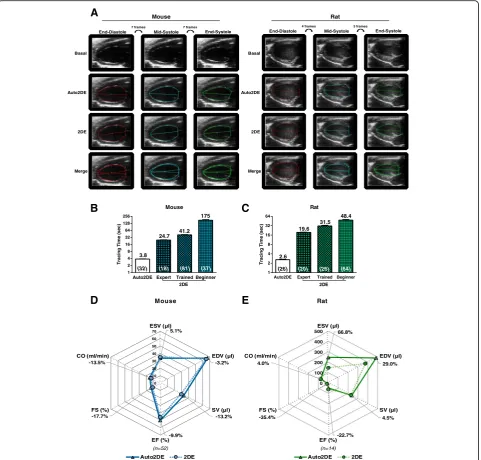
Fig. 1Automated assessment of LV function in healthy mice and rats.aExemplary cine loops +/−tracings by conventional 2DE and novel
Auto2DE in healthy mice and rats.bMean tracing time for mouse andcrat cine loops by operators of distinct experience levels. Numbers in
brackets indicate numbers of tracings.dAverage Auto2DE-assessed LV function parameters in comparison to standard 2DE-assessed data sets in
cohorts of 52 mouse cine loops ande14 rat cine loops. Bold printed numbers indicate the percentage mean difference between Auto2DE and
without banding served as controls (n = 7). Echocar-diography was performed 10 weeks after TAC or SHAM-surgery, and final necropsy was performed one day later.
Generation of the inducible transgenic rat model for
DM was described previously by us [17]. In brief, male
tetO-shIR rats (TetO, 18 weeks) received 2 mg/kg/d doxycycline (DOX) via drinking water until blood
glu-cose levels reached 300–400 mg/dl (n = 10). Baseline
measurements of tetO-shIR served as controls (n= 10).
Afterwards, we administered 0.5 mg/kg/d DOX over an entire period of 8 weeks. Echocardiographic image ac-quisition was carried out 8 weeks after initial DM in-duction. Same experimental protocol was performed using age-matched hypertensive Ren-2 transgenic TGR
(mREN2)27 rats (mRen) [18] and a cross breeding of
them with tetO-shIR (TetO/mRen), suffering from the metabolic syndrome.
The double-transgenic rat (dTGR) model of experimen-tal HFpEF, a cross-breed of TGR(hRen)L10 J (female breeder) and TGR(hAogen)L1623 (male breeder) (dTGR,
10% transcutol, 20% cremophor, 70% water n = 8) and
nontransgenic SD control rats (n= 5) were treated by oral
gavage once daily [14]. Treatment was started at the age
of 4 weeks until the end of the study. Echocardiographic image acquisition was performed directly before euthan-asia at week 6.5.
Echocardiographic image acquisition
Echocardiography was carried out as recently described by us [7,13,14]. Briefly, we used ultra-high frequency
lin-ear array transducers (mice: MX400 18–38 MHz, center
transmit: 30 MHz, axial resolution: 50μm; rats: MX250
13–24 MHz, center transmit: 21 MHz, axial resolution:
75μm) coupled to a Vevo® 3100 (mice) or a Vevo® 2100
(rats) high-resolution Imaging System (all FUJIFILM VisualSonics; Toronto, Ontario, Canada). Animals were anesthetized with 3% isoflurane (Baxter International, Deerfield, Illinois, USA) and fixed in supine position on a heatpad at 37 °C (FUJIFILM VisualSonics, Toronto, On-tario, Canada). Isoflurane concentrations were further
re-duced to a minimum of 1–2% to achieve constant and
comparable heart rates during image acquisition. B-Mode cine loops were generated visualizing the maximum di-mension of the LV from apex to base in a parasternal long axis view. All acquired images were digitally stored in raw format (DICOM) for further offline-analyses.
Analysis with conventional 2D-echocardiography
2DE analysis was performed using the semi-automated LVtrace-Tool of the dedicated software package
Vevo-LAB Version 3.0 (FUJIFILM VisualSonics; Toronto,
Ontario, Canada), which is based on the monoplane
Simpson’s method of discs. Semi-automated 2DE
tracings were generated by manual selection of
end-diastolic and end-systolic dimension of the LV by each observer. To avoid variations due to sinus cycle length and respiration artifacts the observer reviewed several cardiac cycles of a cine loop and selected a suit-able cycle prior to the tracing. 2DE tracings followed the endocardial border regions, covering the whole LV from apex to base. All B-Mode cine loops were traced twice with gold standard 2DE to account for interbeat variabil-ity, and resulting values were averaged for the final 2DE data set. Details regarding the assessment of tracing time
can be found in the Additional file1.
Automated assessment of LV function
The same set of B-Mode cine loops was used for con-ventional 2DE and novel Auto2DE analysis (Vevo Lab Version 3.1.0 (Build 13,029), FUJIFILM VisualSonics; Toronto, Ontario, Canada). 2DE tracings were carried out prior to Auto2DE analysis, ensuring adequate blinding of the manual evaluation. 2DE-derived tracings and data were not visible to the operator performing Auto2DE. For analysis of Auto2DE, B-Mode cine loops of the LV were manually navigated to an R-wave of the simultaneously re-corded electrocardiogram by visually running through the cine loop. If this procedure was hampered by pathophysi-ologic alterations of the electrocardiogram, the maximum dimension of the LV was manually visualized by the obser-ver. The automated tracing was realized by using the AutoLV-tool of theVevoLab software (further referred to as Auto2DE). The chosen image is automatically tested against a library to produce a tracing of the LV endocar-dial borders across a series of frames. The tool was developed by adapting the clinically accepted modified
Simpson’s monoplane method of disks approach for LV
analysis. Clicking theAutoLV-button in the measurement
panel automatically produces a tracing of the LV endocar-dial border on each frame from the starting R-wave (diastole) forward to the next P-wave (systole). Hence, au-tomated analysis of the same frame twice, would result in identical values of cardiac function parameters, guarantee-ing observer-independence. To account for interbeat variability, all B-Mode cine loops were traced twice with Auto2DE, choosing two different frames for analysis. The resulting values were subsequently averaged in the final Auto2DE data set.
Assessment of image quality
visible, no apex foreshortening; Q2 = slightly diffuse endocardial visualization, occasional minor rib shadows or artifacts in apex or base regions; Q3 = diffuse endo-cardial border delineation combined with moderate arti-facts or rib shadows or apex foreshortening; Q4 = insufficient endocardial visualization or one or more seg-ments covered by artifacts or rib shadows.
Statistics
All analyses were done using Prism 7 software (Graph-Pad Software, La Jolla, CA). Results are shown as mean ± standard error of the mean (SEM) with/without indi-vidual scatters. Statistical analyses were performed using one-way-ANOVA for multiple comparisons followed by
Uncorrected Fisher’s LSD posttest. Correlation of
vari-ables of diseased cohorts was tested using Pearson’s
cor-relation coefficient (r). Corcor-relation between methods was defined as follows: r > .8 very good, r > .6 good, r > .4
moderate and r < .4 poor. Ap-value of <.05 was assumed
as statistically significant. 2DE and Auto2DE were com-pared by Bland-Altman plots and results expressed as bias and limits of agreement (LOA). Post-hoc power analysis was computed based on effect size, sample
size and type I errorα, using the G*Power 3.1.9.4
free-ware tool (Heinrich Heine University, Duesseldorf, Germany).
Results
Automated assessment of LV function is faster than conventional 2DE analysis
One of the major benefits to be expected from auto-mated software algorithms is time effectiveness. To this end, we compared the average time required for LV trac-ings with conventional 2DE from observers with distinct experience levels and novel Auto2DE in mice and rats
(Fig. 1b, c). Tracing times for rat cine loops were
con-sistently shorter than tracing times in mice, independent of experience levels. For both rats and mice, observer experience level had expectedly a strong effect on tra-cing time, with less trained observers requiring longer tracing times. Direct comparison of both software tools demonstrated that mean tracing times of novel Auto2DE
were 6.5–7.5 fold faster than the fastest observer and
18–46 fold faster than the slowest observers for each
species. To assess accuracy of Auto2DE, we analyzed data sets from 52 healthy mouse cine loops and 14 healthy rat cine loops (validation cohorts) with both software tools and compared average values for cardiac
function parameters in spider plots (Fig. 1d, e), which
revealed excellent agreement between 2DE and
conven-tional Auto2DE in mice (Fig. 1d). LV function patterns
of rat cine loops shared main characteristics, however, absolute values differed, especially when focusing on absolute end-systolic volume (ESV) and end-diastolic
volume (EDV) and the resulting relative measure EF. A post-hoc power analysis regarding both validation
co-horts can be found in the Additional file1.
The accuracy of Auto2DE-assessed data is dependent on cine loop quality
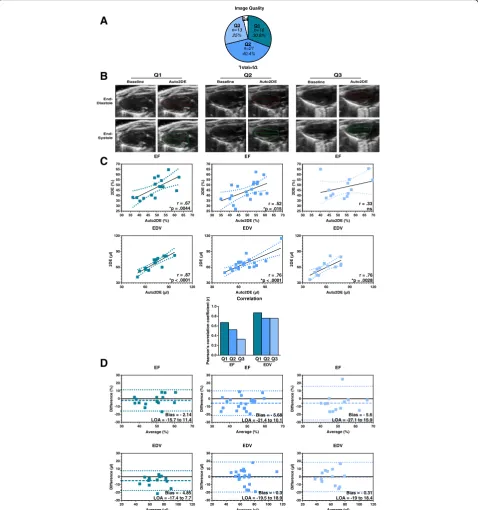
To investigate the degree to which image quality affects the performance of Auto2DE analysis, cine loops of the murine validation cohort were graded into four distinct quality levels (Q1 good, Q2 fair, Q3 poor, or Q4 -insufficient) by an expert in small animal
echocardiog-raphy (Fig. 2a). Two cine loops showed inferior image
quality (Q4) due to poor endocardial border delineation or segment visibility and were excluded from further analyses. Exemplary images of quality levels and corre-sponding manual and automated tracings indicate the increasing challenge of endocardial border tracing with
decreasing image quality (Fig. 2b). Next, we correlated
values derived from both methods and calculated the correlation coefficient for the stratified data sets (Table1,
Fig. 2c). The results were in line with the exemplary
tracings in that correlation between manual and auto-mated tracings decreased as a function of image quality. For example, for Q1-stratified cine loops, all LV function parameters showed good to very good correlations
be-tween both methods (Table 1). Correlation coefficients
decreased in Q2 and even further in Q3 stratified im-ages, indicating that poor image quality caused enhanced variabilities regarding cardiac function analysis between
both techniques (Fig.2c). In contrast, correlation
coeffi-cients for EDV remained stable independent of image quality. However, correlations were still best for cine loops of Q1 stratified data.
As a next step, we displayed data from both analysis tools as Bland-Altman plots to calculate bias and LOA
(Limits of Agreement) (Table 1, Fig. 2d). As compared
to mean absolute values (Fig. 1d) bias levels were small
and largely independent from image quality, indicating the absence of systematic errors. LOA levels, however, increased with poorer image quality. This is again exem-plary shown for the clinically important metrics EF and EDV (Fig.2d).
Auto2DE performance is accurate in severe pathologic cardiac phenotypes
To test whether automated tracing is suitable to de-tect pathologic alterations in cardiac performance, we applied Auto2DE in small animal models of distinct cardiac pathologies. Physiological validation of the phenotype of individual models including mean values
of echocardiographic data are shown in Table 2, and
Additional file 1: Tables S3-S4, but will not be
We investigated four mouse models (STZ: Type I DM, db+/db+: Type II DM, Fib: subendocardial fibrosis, TAC: LV failure) and four rat models (TetO: genetically-induced DM, mRen: hypertension, TetO/mRen: metabolic syn-drome, dTGR: HFpEF) with 2DE and novel Auto2DE
and correlated the obtained data sets. Color-coded heat maps of correlation coefficients and corresponding bar graphs of averaged correlation coefficient from all seven cardiac function parameters (ESV, EDV, SV (stroke volume), EF, FS (fractional shortening), CO (cardiac
Q1 Q2 Q3
Baseline Auto2DE Baseline Auto2DE Baseline Auto2DE
End-Systole End-Diastole
30 35 40 45 50 55 60 65 70 25 30 35 40 45 50 55 60 65 70 EF Auto2DE (%) 2D E (% )
r = .67 *p = .0044
30 35 40 45 50 55 60 65 70 25 30 35 40 45 50 55 60 65 70 EF Auto2DE (%) 2D E (% )
r = .52 *p = .015
30 35 40 45 50 55 60 65 70 25 30 35 40 45 50 55 60 65 70 EF Auto2DE (%) 2D E (% )
r = .33 ns
30 60 90 120 30 60 90 120 EDV Auto2DE (µl) 2D E (µ l)
r = .87 *p < .0001
30 60 90 30 60 90 120 EDV Auto2DE (µl) 2D E (µ l)
r = .76 *p < .0001
30 60 90 120 30 60 90 120 EDV Auto2DE (µl) 2D E (µ l)
r = .76 *p = .0028
20 40 60 80 100 120 -30 -20 -10 0 10 20 30 EDV Average (µl) Di ffer en c e( µl )
Bias = - 4.85 LOA = -17.4 to 7.7
20 40 60 80 100 120 -30 -20 -10 0 10 20 30 EDV Average (µl) Differen ce (µ l)
Bias = - 0.3 LOA = -19.5 to 18.9
20 40 60 80 100 120 -30 -20 -10 0 10 20 30 EDV Average (µl) D iffe ren c e (µ l)
Bias = - 0.31 LOA = -19 to 18.4
30 40 50 60 70 -30 -20 -10 0 10 20 30 EF Average (%) D if fer e n c e (% )
Bias = - 2.14 LOA = -15.7 to 11.4
30 40 50 60 70 -30 -20 -10 0 10 20 30 EF Average (%) Dif fe re n c e (% )
Bias = - 5.68 LOA = -21.4 to 10.1
30 40 50 60 70 -30 -20 -10 0 10 20 30 EF Average (%) D if fer e n c e( %)
Bias = - 5.6 LOA = -27.1 to 15.9
B
C
D
Total=52 n=13 25% n=21 40.4% n=16 30.8% Q1 Q4 Q2 Q3 Image QualityA
0.0 0.2 0.4 0.6 0.8 1.0 Correlation Pearson's co rrela tio n co efficien t (r ) EFQ1Q2Q3
EDV
Q1 Q2 Q3
Fig. 2Analysis of murine cine loop data with 2DE and Auto2DE stratified by image quality.aColor-coded distribution of cine loops with distinct
image quality (Q1-Q4) in a cohort of 52 mouse cine loops.bExemplary cine loops +/−tracings by Auto2DE stratified by image qualities (Q1-Q3).
cPearson’s correlation analysis anddBland-Altman analysis of Q1-images (left panel), Q2-images (middle panel) and Q3-images (right panel) of
Auto2DE and 2DE-assessed EF and EDV data. Numbers in brackets indicate n-numbers. Mean + SEM. r: Pearson’s correlation coefficient. LOA:
Table 1Validity of automated tracings is dependent on image quality
Pearson’s r 95% CI p-value Equation Bias LOA Significance of Bias
Q1 (n= 16) EF (%) .67* .26 to .88 .0044 Y = 0.8312x + 6.223 −2.14 −15.7 to 11.4 n.s.
FS (%) .77* .44 to .92 .0005 Y = 2.082x-15.3 −1.20 −8.9 to 6.4 n.s.
EDV (μl) .87* .66 to .95 <.0001 Y = 0.8465x + 6.08 −4.85 −17.4 to 7.7 n.s.
ESV (μl) .73* .38 to .90 .0012 Y = 0.8159x + 5.644 −1.05 −15.6 to 13.5 n.s.
SV (μl) .88* .68 to .96 <.0001 Y = 0.9732x-2.87 −3.81 −10.8 to 3.2 n.s.
CO (μl) .88* .68 to .96 <.0001 Y = 0.9543x-1.024 −1.71 −4.7 to 1.3 n.s.
HR (bpm) .99* .96 to 1.0 <.0001 Y = 0.01201x + 7.861 2.73 −9.2 to 14.6 n.s.
Q2 (n= 21) EF (%) .52* .12 to .78 .015 Y = 0.6419x + 12.26 −5.68 −21.4 to 10.1 n.s.
FS (%) .24 −.22 to .61 .2977 Y = 0.2597x + 7.213 −2.21 −9.2 to 4.8 n.s.
EDV (μl) .76* .49 to .90 <.0001 Y = 0.7203x + 18.6 −0.30 −19.5 to 18.9 n.s.
ESV (μl) .60* .23 to .82 .0039 Y = 0.6607x + 14.98 3.61 −10.9 to 18.1 n.s.
SV (μl) .74* .45 to .88 .0001 Y = 0.7098x + 5.966 −3.91 −17.0 to 9.6 n.s.
CO (μl) .77* .50 to .90 <.0001 Y = 0.7843x + 1.646 −1.64 −7.4 to 4.1 n.s.
HR (bpm) .92* .80 to .97 <.0001 Y = 0.04046x-20.08 −1.91 −27.8 to 23.9 n.s.
Q3 (n= 13) EF (%) .33 −.27 to .75 .2726 Y = 0.3706x + 27.93 −5.60 −27.1 to 15.9 n.s.
FS (%) .56* .02 to .85 .0452 Y = 0.9746x-2.26 −2.60 −12.9 to 7.7 n.s.
EDV (μl) .76* .35 to .92 .0028 Y = 0.7182x + 16.49 −0.31 −19.0 to 18.4 n.s.
ESV (μl) .64* .15 to .88 .0175 Y = 0.734x + 10.66 3.13 −14.1 to 20.4 n.s.
SV (μl) .27 −.33 to .72 .3687 Y = 0.2637x + 19.62 −3.44 −19.7 to 12.8 n.s.
CO (μl) .27 −.33 to .71 .3757 Y = 0.2304x + 9.395 −1.80 −8.5 to 4.9 n.s.
HR (bpm) .92* .76 to .98 <.0001 Y = -0.08216x + 43 4.76 −26.0 to 35.5 n.s.
ESVEnd-Systolic Volume,EDVEnd-diastolic Volume,SVStroke Volume,EFEjection Fraction,FSFractional Shortening,COCardiac Output,HRHeart Rate,LOALimits of Agreement. *Data in bold are statistically significant
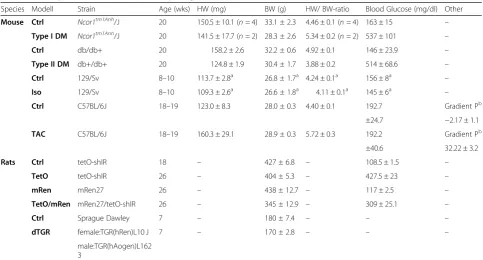
Table 2Phenotypic characteristics of pathophysiological small animal models
Species Modell Strain Age (wks) HW (mg) BW (g) HW/ BW-ratio Blood Glucose (mg/dl) Other
Mouse Ctrl Ncor1tm1Anh/J 20 150.5 ± 10.1 (n= 4) 33.1 ± 2.3 4.46 ± 0.1 (n= 4) 163 ± 15 –
Type I DM Ncor1tm1Anh/J 20 141.5 ± 17.7 (n= 2) 28.3 ± 2.6 5.34 ± 0.2 (n= 2) 537 ± 101 –
Ctrl db/db+ 20 158.2 ± 2.6 32.2 ± 0.6 4.92 ± 0.1 146 ± 23.9 –
Type II DM db+/db+ 20 124.8 ± 1.9 30.4 ± 1.7 3.88 ± 0.2 514 ± 68.6 –
Ctrl 129/Sv 8–10 113.7 ± 2.8a 26.8 ± 1.7a 4.24 ± 0.1a 156 ± 8a
–
Iso 129/Sv 8–10 109.3 ± 2.6a
26.6 ± 1.8a 4.11 ± 0.1a 145 ± 6a –
Ctrl C57BL/6J 18–19 123.0 ± 8.3 28.0 ± 0.3 4.40 ± 0.1 192.7 Gradient Pb
±24.7 −2.17 ± 1.1
TAC C57BL/6J 18–19 160.3 ± 29.1 28.9 ± 0.3 5.72 ± 0.3 192.2 Gradient Pb
±40.6 32.22 ± 3.2
Rats Ctrl tetO-shIR 18 – 427 ± 6.8 – 108.5 ± 1.5 –
TetO tetO-shIR 26 – 404 ± 5.3 – 427.5 ± 23 –
mRen mRen27 26 – 438 ± 12.7 – 117 ± 2.5 –
TetO/mRen mRen27/tetO-shIR 26 – 345 ± 12.9 – 309 ± 25.1 –
Ctrl Sprague Dawley 7 – 180 ± 7.4 – – –
dTGR female:TGR(hRen)L10 J 7 – 170 ± 2.8 – – –
male:TGR(hAogen)L162 3
HWHeart weight,BWBody weight,HW/BW-ratioheart weight/Bodyweight-ratio.a
Data published previously in [13].b
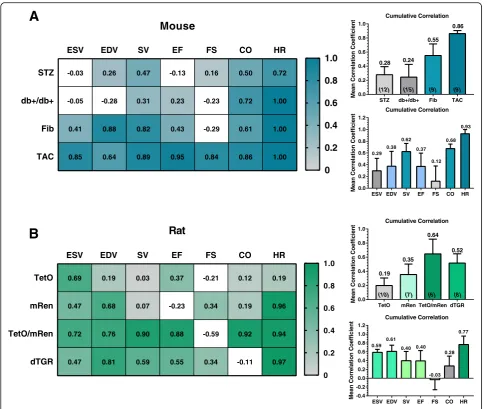
output), HR (heart rate)) or from all four animal models, respectively, reflect the suitability of Auto2DE in individual animal models or with respect to meas-urement of individual cardiac parameters, respectively (Fig. 3a, b).
Surprisingly, similar patterns of correlations emerged for individual animal models in both species, in that
dia-betic models (mice: STZ, db+/db+; rats: TetO) yielded
the poorest cumulative correlation. In contrast and against our original hypothesis that strong phenotypes would be less suitable for an automated analysis algo-rithm, in both species models with pronounced cardiac phenotypes and markedly impaired LV function showed good to very good correlations (TAC: r = .86; TetO/
mRen: r = .64) (Fig.3a, b). Individual LV function
param-eters also differed with respect to their accurate assess-ment by Auto2DE. Heart rate was by far the parameter with best agreement between methods in both species (mice: r = .93; rats: r = .77). In mice the relative metrics SV and CO correlated well between software tools. In rats, analysis of LV dimensions yielded good cumulative correlations for the absolute volumes ESV and EDV, while correlation was poor for relative metrics SV and EF.
A closer look at the method comparison in pronounced cardiac pathologies revealed that Auto2DE is in general suitable to detect strong phenotypes, defined as impaired LV function in terms of reduced EF accompanied by significant cardiac remodeling (e.g. endocardial fibrosis, -0.03 -0.05 0.41 0.85 0.26 -0.28 0.88 0.64 0.47 0.31 0.82 0.89 -0.13 0.23 0.43 0.95 0.16 -0.23 -0.29 0.84 0.50 0.72 0.61 0.86 0.72 1.00 1.00 1.00
ESV EDV SV EF FS CO HR
STZ db+/db+ Fib TAC
Mouse
0 0.2 0.4 0.6 0.8 1.0 0.69 0.47 0.72 0.47 0.19 0.68 0.76 0.81 0.03 0.07 0.90 0.59 0.37 -0.23 0.88 0.55 -0.21 0.34 -0.59 0.34 0.12 0.19 0.92 -0.11 0.19 0.96 0.94 0.97ESV EDV SV EF FS CO HR
TetO mRen TetO/mRen dTGR
Rat
0 0.2 0.4 0.6 0.8 1.0ESV EDV SV EF FS CO HR
0.0 0.2 0.4 0.6 0.8 1.0 1.2 Mea nC o rr e lat io n Co ef ficien
t Cumulative Correlation
0.29 0.38 0.62 0.37 0.12 0.68 0.93
A
B
STZ db+/db+ Fib TAC
0.0 0.2 0.4 0.6 0.8 1.0 Mea nC o rr e lation C o ef ficien t
(12) (15) (9) (9)
0.28 0.24
0.55 0.86 Cumulative Correlation
TetO mRen TetO/mRen dTGR
0.0 0.2 0.4 0.6 0.8 1.0 Mea n C o rr elat io n C o e ff icien t
(10) (7) (6) (8)
0.19 0.35
0.64
0.52 Cumulative Correlation
ESV EDV SV EF FS CO HR
-0.4 -0.2 0.0 0.2 0.4 0.6 0.8 1.0 1.2 Me an C o rre lati o nC o e ff ic ien
t Cumulative Correlation
0.59 0.61 0.40 0.40 -0.03 0.28 0.77
Fig. 3Correlation analysis of 2DE and Auto2DE-assessed data in cardio-pathophysiological conditions.aColor-coded heat map of correlation
analysis between the two methods of interest in four mouse models andbfour rat models with cardiac phenotypes. Bar graphs next to the heat
maps indicate the averaged correlation coefficientrfor animal models or cardiac function parameters, demonstrating applicability of Auto2DE to
analyze an individual animal model or cardiac function parameter. Bold-printed numbers indicate meanr-values of correlation analysis. Numbers
1 0 2 0 3 0 4 0 5 0 6 0 7 0 8 0 9 0 E F (% )
* p < 0 .0 0 0 1 - 2 6 .6 1 %
* p < 0 .0 0 0 1 - 3 4 .2 3 %
A u t o 2 D E 2 D
C t r l T e t O / m R e n C t r l T e t O / m R e n
( 9 ) ( 6 ) ( 9 ) ( 6 ) 4 5 5 0 5 5 6 0 6 5 7 0 - 4 0
- 3 0 - 2 0 - 1 0 0 1 0 2 0 3 0 4 0
E F ( C t r l)
A v e r a g e
D iffe r e n c e
B ia s = - 6 .8 6 L O A = - 2 2 .5 to 8 .7
2 0 2 5 3 0 3 5 4 0
- 4 0 - 3 0 - 2 0 - 1 0 0 1 0 2 0 3 0 4 0
E F ( T e t O /m R e n )
A v e r a g e
Di ff e r e n c e
B ia s = 0 .7 6 L O A = - 4 .1 t o 5 .6
0 3 0 6 0 9 0 1 2 0 1 5 0
C O (m l/ m in )
A u t o 2 D E 2 D
C t r l T e t O / m R e n C t r l T e t O / m R e n ( 9 ) ( 6 ) ( 9 ) ( 6 )
*p < 0 .0 0 0 1 - 4 1 .7 1 m l/ m in
* p < 0 .0 0 0 1 - 3 7 . 8 m l/ m in
7 0 8 0 9 0 1 0 0 1 1 0
- 5 0 - 4 0 - 3 0 - 2 0 - 1 0 0 1 0 2 0 3 0 4 0 5 0
C O ( C tr l)
A v e r a g e
Di ff e r e n c e
B ia s = 6 .3 8 L O A = - 3 1 .0 t o 4 3 .8
0 2 0 4 0 6 0 8 0 1 0 0
- 4 0 - 3 0 - 2 0 - 1 0 0 1 0 2 0 3 0 4 0
C O ( T e t O /m R e n )
A v e r a g e
Di ff e r e n c e
B ia s = 2 .4 7 L O A = - 1 2 .5 t o 1 7 .5
0 1 0 2 0 3 0 4 0 5 0 6 0 7 0 8 0 9 0 E F (% )
p = 0 .0 5 3 7 - 1 0 .6 7 %
* p = 0 .0 0 6 5 - 1 5 .5 6 %
A u t o 2 D E 2 D S H A M T A C S H A M T A C
( 7 ) ( 9 ) ( 7 ) ( 9 ) 3 5 4 0 4 5 5 0 5 5 6 0 - 3 0
- 2 0 - 1 0 0 1 0 2 0 3 0
E F (S H A M )
A v e r a g e
D iff er en c e
B ia s = - 1 .7 3 L O A = - 1 0 .8 t o 7 .3
0 2 0 4 0 6 0
- 3 0 - 2 0 - 1 0 0 1 0 2 0 3 0
E F ( T A C )
A v e r a g e
Di ff e r e n c e
B ia s = - 3 .1 6 L O A = - 1 0 .6 t o 4 .2
1 2 1 4 1 6 1 8 2 0
- 3 0 - 2 0 - 1 0 0 1 0 2 0 3 0
C O ( S H A M )
A v e r a g e
Di ff e r e n c e
B ia s = 0 .2 L O A = - 3 .3 t o 2 .5
0 5 1 0 1 5 2 0
- 3 0 - 2 0 - 1 0 0 1 0 2 0 3 0
C O ( T A C )
A v e r a g e
Di ff e r e n c e
B ia s = - 0 .4 1 L O A = - 3 .2 t o 3 .6
0 5 1 0 1 5 2 0 2 5 3 0 C O (m l/ m in )
A u t o 2 D E 2 D S H A M T A C S H A M T A C ( 7 ) ( 9 ) ( 7 ) ( 9 )
* p = 0 .0 4 9 7 - 2 . 7 6 m l/ m in
* p = 0 .0 1 8 3 - 3 . 3 7 m l/ m in
A
B
C
D
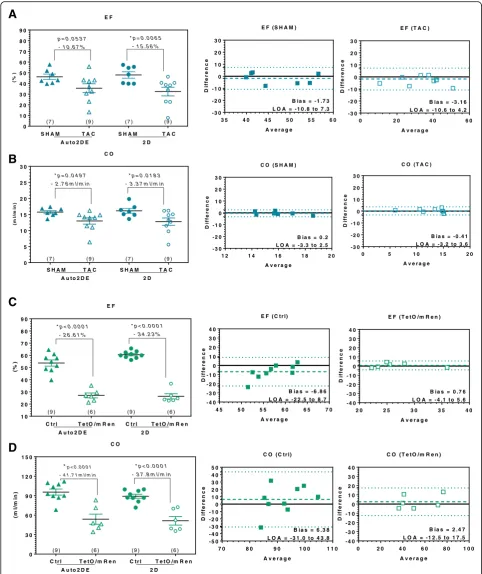
Fig. 4Method comparison of Auto2DE and 2DE in pathologies with pronounced alterations of LV function.aMean EF- andbCO-difference between SHAM-mice and TAC-mice assessed with novel Auto2DE and 2DE. Bland-Altman analysis was stratified by healthy and diseased mice.
cMean EF- anddCO-difference between Ctrl-rats and TetO/mRen-rats assessed with novel Auto2DE and 2DE. Bland-Altman analysis was
stratified by healthy and diseased rats. Numbers in brackets indicate the n-numbers. LOA: Limits of Agreement. *p< .05 vs. corresponding
inflammation, hypertrophy). However, when directly com-paring TAC-mice to their corresponding SHAM-controls, Auto2DE failed to detect significant reduced EF, while conventional 2DE reliably detected the expected decreased
EF (Fig. 4a). The concomitant decrease in the clinically
relevant parameter CO in TAC-mice as compared to SHAM-controls was detected with statistical significance by both techniques, indicating the general capacity of Auto2DE for detection of impaired cardiac
perform-ance (Fig.4b). Bland-Altman analysis of TAC mice and
SHAM-controls showed very good agreement and minimal bias between automated and semi-automated software tools and no differences in the analysis of
healthy or diseased mice (Fig. 4b, c). These results were
corroborated by data from TetO/mRen-rats as a model of
metabolic syndrome (Fig. 4c, d). Both Auto2DE and
con-ventional 2DE detected a highly significant reduced EF and CO in diseased as compared to control rats (Fig.4c).
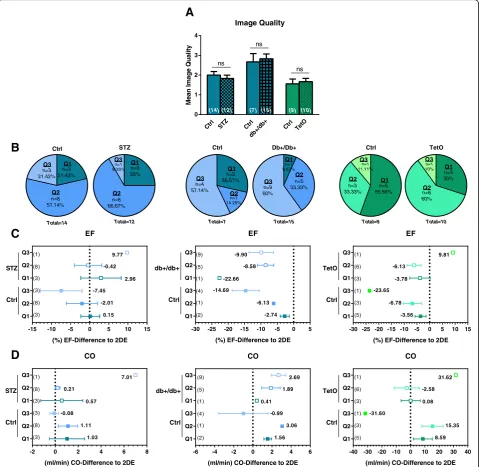
Poor image quality is not the cause for poor performance of Auto2DE in diabetic animal models
In contrast to our original hypothesis that pronounced cardiac phenotypes would in general be less suitable for automated analysis tools, we found Auto2DE analysis to be specifically hampered in three diabetic animal models. Based on the impact of image quality on Auto2DE per-formance shown previously in this study, we speculated that diabetic cardiomyopathy may result in poor image quality per se. To test this notion, we compared mean image quality of diabetic animals and their corresponding
healthy controls of the same study (Fig.5a). While
individ-ual studies differed in averaged image qindivid-uality, no differ-ences in image quality were detected between healthy and diabetic animals, indicating that diabetic conditions did
not worsen image quality per se (Fig.5a, b). Next, we
cal-culated the mean difference between Auto2DE and 2DE for the parameters EF and CO for healthy and diseased animals stratified by image quality, to probe whether Auto2DE is similarly image quality-dependent in diabetic conditions as previously shown for healthy animals (vide
supra) (Fig.5c, d). Mean differences and standard
devia-tions between Auto2DE and 2DE increased as a function of quality level in healthy controls, corroborating the re-sults from the murine validation cohort. A similar pattern was observed in diabetic animals, suggesting that poor image quality had similar effects on the performance of Auto2DE in both healthy and diseased animals. Taken together, these findings exclude poor image quality as the predominant cause for the poor performance of Auto2DE in diabetic animal models.
Discussion
In the present study, we evaluated a novel automatic soft-ware tool for LV function assessment against the manual
2DE standard of use method. Our results revealed that (1) data analysis with Auto2DE is rapid, straightforward and independent of observer experience levels, (2) Auto2DE-assessed data correlated with manually Auto2DE-assessed 2DE data with negligible mean differences or bias and within reason-able LOAs in healthy mice, yet less so in rats, (3) correla-tions between both techniques were dependent on image quality, indicating that Auto2DE performance decreases as a function of image quality, (4) pronounced cardiac phenotypes showed in general good agreement be-tween methods, with the notable exception of diabetic animal models which seem less suitable for analysis with Auto2DE.
A major advantage of novel Auto2DE is the independ-ence of observer experiindepend-ence level and hindepend-ence, a small intra- and interobserver variability, which became evi-dent when tracing the same cardiac cycle twice with Auto2DE, beginning with the same frame, always leads to the same data set (data not shown). In contrast, ob-server variabilities and operator experience levels are known as major drawback of manually analyzed
echo-cardiographic data sets [19–21]. The requirement for
extensive training, and the remaining time-consuming task of manual tracing have fuelled interest within the basic research community into automated software ap-proaches for the assessment of echocardiographic data that can rapidly generate data sets with high reproduci-bility and independent of observer experience. However, there seem to be differences regarding the tracing with Auto2DE between mice and rats, since absolute values of Auto2DE-assessed LV function parameters differed
more in rats compared to mice. Due to the rat’s larger
size, physiological noise originating from cardiac and re-spiratory motion is larger as compared to mice. As cardio-respiratory noise is well known to cause severe artifacts, such an effect may hamper the proper analysis of rat cine
loops by Auto2DE [22–24]. Another explanation for this
finding could be an underrepresentation of rats among the 200 expertly curated LV analysis traces used to train the Auto2DE algorithm (which is unknown as the original tracing library is not public domain).
Yet, automated analyses may be critically hampered by observer-independent factors such as poor image quality; however, this problem applies equally to conventional analyses. Previous studies have highlighted the impact of image quality on the reliability of the produced data for
both manually assessed 2DE [25] or 3DE [26] data sets.
approaches, we decided to include all cine loops with adequate quality for Auto2DE and 2DE and performed no further preselection based on image quality in order to realistically mimic experimental routines of animal studies
[10, 11]. Future studies may consider possible exclusion
criteria for cine loops with poor image quality to increase reliability of Auto2DE when utilized in murine studies.
We originally hypothesized that phenotypes with se-verely altered cardiac function may not be suitable for
Auto2DE analysis, as such pathologies may be associated with poor image quality. Conversely, we observed that pronounced cardiac phenotypes, namely a mouse model of LV failure and a rat model of metabolic syndrome, were suitable for the analysis with Auto2DE and showed the best correlation with 2DE-derived data of all tested animal models. In contrast, subtle alterations of cardiac phenotypes, caused by DM, fibrosis or hypertension showed less convincing results, when assessed with
-15 -10 -5 0 5 10 15
Q1 Q2 Q3 Q1 Q2 Q3 EF
(%) EF-Difference to 2DE Ctrl STZ 0.15 -2.01 -7.45 2.96 -0.42 9.77 (1) (8) (3) (3) (8) (3)
Ctrl STZ Ctr l
db+ /db+ Ctr
l TetO 0 1 2 3 4 Image Quality Mean Im a g e Q u a li ty ns ns ns
(14) (12) (7) (15) (9) (10)
n=3 21.42% n=8 57.14% n=3 21.43% Q1 Q2 Q3 Ctrl Total=14 n=1 8.33% n=8 66.67% n=3 25% Q1 Q2 Q3 STZ Total=12 n=4 57.14% n=1 14.29% n=2 28.57% Q1 Q2 Q3 Ctrl Total=7 n=9 60% n=5 33.33% n=1 6.67% Q1 Q2 Q3 Db+/Db+ Total=15 n=1 11.11% n=3 33.33% n=5 55.56% Q1 Q2 Q3 Ctrl Total=9 n=1 10% n=6 60% n=3 30% Q1 Q2 Q3 TetO Total=10
A
B
C
-30 -25 -20 -15 -10 -5 0 5
Q1 Q2 Q3 Q1 Q2 Q3 EF
(%) EF-Difference to 2DE (9) (5) (1) (4) (1) (2) Ctrl db+/db+ -2.74 -6.13 -14.69 -22.66 -8.58 -9.90
-30 -25 -20 -15 -10 -5 0 5 10 15
Q1 Q2 Q3 Q1 Q2 Q3 EF
(%) EF-Difference to 2DE (1) (6) (3) (1) (3) (5) Ctrl TetO -3.56 -6.78 -23.65 -3.78 -6.13 9.81
-2 0 2 4 6 8
Q1 Q2 Q3 Q1 Q2 Q3 CO
(ml/min) CO-Difference to 2DE (1) (8) (3) (3) (8) (3) 1.03 1.11 -0.08 0.57 0.21 7.01 Ctrl STZ
-6 -4 -2 0 2 4 6
Q1 Q2 Q3 Q1 Q2 Q3 CO
(ml/min) CO-Difference to 2DE (9) (5) (1) (4) (1) (2) 1.56 3.06 -0.99 0.41 1.89 2.69 Ctrl db+/db+
-40 -30 -20 -10 0 10 20 30 40
Q1 Q2 Q3 Q1 Q2 Q3 CO
(ml/min) CO-Difference to 2DE (1) (6) (3) (1) (3) (5) Ctrl TetO 8.59 15.35 -31.60 0.08 -2.58 31.62
D
Fig. 5Method comparison of Auto2DE and 2DE of cine loops stratified by image quality in diabetic animal models.aMean image quality of
diabetic cohorts and their corresponding study-controls.bDistribution of image quality levels in healthy and diabetic mice and rats.cMean
difference between Auto2DE and 2DE absolute EF anddCO values in diabetic animals and corresponding controls. The data was stratified by
Auto2DE. Along similar lines, Auto2DE was not able to show the expected significant reduction of EF in TAC-mice as compared to SHAM-controls, pointing towards a lower sensitivity of novel Auto2DE compared to manual 2DE. The observed results underline the importance of sen-sitivity in diagnostic imaging technologies with echo-cardiographic results building the basis for clinical decision-making and research interpretation, respect-ively. Notably, none of the clinical approaches with automated 2DE software tools have yet addressed the question whether automated software tools may be less or more suitable for individual pathologies despite
their use in individual clinical studies [11,12,27]. We
conclude from our data that the current version of the Auto2DE software tool is sufficiently sensitive for quantitative diagnosis of pronounced cardiac patholo-gies and associated severe alterations in cardiac func-tion, while its usefulness for the analysis of early cardiac damage or subclinical disease stages such as seen in diabetic animal models is still limited.
Clinical approaches of automated software tools dem-onstrated very good agreement rates for the clinically relevant parameter EF, with partially similar or better
ac-curacy as established control methods [9,11, 12]. In the
present study, we can only speculate as to the reasons for the poor agreement rates of EDV and ESV in mice. One confounding factor might be the choice of two
murine diabetic models, namely STZ and db+/db+,
which demonstrated poor outcome in correlation ana-lysis of all cardiac function parameters. When excluding diabetic mouse models (just Fib and TAC) from the cu-mulative correlation analysis, ESV and EDV parameters reach good correlations, which are comparable to SV and EF calculated correlations. This murine effect was replicated in a diabetic rat model (TetO) which again showed the worst outcome in correlation analysis of all included animal models. As such, our data suggest that the safe and valid use of automated software tools is spe-cifically hampered in diabetic disease conditions. Not-ably, both type I and II DM cause pathologic heart rate
variabilities in mice [28, 29]. In line with this notion,
Stables and colleagues reported previously a relative re-duction of sympathetic control of HR for type I DM STZ model and an altered circadian rhythm of
sympa-thetic HR-control for db+/db+-mice [29]. Notably, our
own data yield a poor correlation of HR measured with Auto2DE as compared to manually assessed HR in STZ and TetO animal models, yet not in animal models of other cardiac pathologies. HRs measured via an electro-physiological signal, i.e. R-wave (end-diastole) and P-wave (end-systole), are the basis for the novel Auto2DE tech-nique, which automatically searches for the end-systolic frame based on the electrocardiography (ECG)-signal. In contrast, experienced observers often visualize primarily
the maximum and minimum dimension of the LV in the B-mode cine loop and use the ECG-signal only in a sec-ondary manner for the manual analysis of LV function. Analysis of B-mode images by the automated software tool or manual tracing of the observer is therefore based on different parameters (ECG-signal vs. B-mode image). When we compared the amount of frames analyzed by au-tomated and manual tracings, we realized that the number of analyzed frames sometimes differed between both tech-niques (data not shown), possibly leading to poor outcome of Auto2DE in diabetic animal models. Moreover, the au-tomated algorithm was probably originally not trained with cine loops from diabetic animals, therefore hamper-ing the analysis of the same (information was not access-ible from the company). Even if we cannot prove this hypothesis with the available data sets, a relationship of the type of cardiac pathology and suitability for the ana-lysis with Auto2DE seems to exist.
Our study has some limitations, which should be taken into account when interpreting the presented data set. First, mouse and rat models analyzed with 2DE and novel Auto2DE were of different age. The possibility that aging as a pathophysiological process itself could have had im-pact on cardiac performance was not investigated and cannot be ruled out in our methodological approach to compare both aforementioned imaging modalities. Future studies may address whether Auto2DE is suitable for the analysis of age-associated cardiac function decline. Sec-ond, while animals were positioned on a 37 °C heatpad during image acquisition we did not monitor body temperature directly. Therefore, we cannot fully exclude that variations in body temperature had potential con-founding effects on the assessment of cardiac performance in the present study. In the present study, we opted to use the MX400 linear array transducer due to its superior per-formance in tissue penetration for the echocardiographic examination of mice cohorts, which however comes at the cost of a slightly lower spatial resolution as compared to the MX550D linear array transducer (Visualsonics). Fur-thermore, post-hoc power analysis demonstrated that the sample size in the rat validation cohort was not sufficient to detect differences between 2DE and Auto2DE for the relative metrics EF and FS. Ongoing studies using larger sample sizes will thus be required to verify that the tested echocardiographic modalities yield similar results in rats. Lastly, it should be emphasized that correlation analyses reflect relationships rather than agreement between two imaging modalities. The latter was exemplarily addressed in detail by Bland & Altman analyses for two cardiovascu-lar disease models and two cardiac function parameters.
Conclusion
results comparable to manually assessed data in healthy mice and, albeit to a lesser degree, in rats. Auto2DE sensitively diagnoses severe cardiac pathologies with pronounced alterations of LV function in small animals. However, automated analysis by Auto2DE is hampered by poor image quality and in pathologies with subtle al-tered LV function such as diabetic cardiomyopathies.
Additional file
Additional file 1:Online Supplement. (DOCX 511 kb)
Abbreviations
2DE:Two-dimensional echocardiography; 3DE: Three-dimensional
echocardiography; Auto2DE: Automated 2D-border detection algorithm; BW: Body weight; CMR: Cardiac magnetic resonance imaging;
ECG: Electrocardiography; EDV: End-diastolic volume; EF: Ejection fraction; ESV: End-systolic volume; fps: Frames per second; FS: Fractional shortening; HR: Heart rate; HW: Heart weight; LOA: Limits of agreement; LS: Global longitudinal peak strain; LV: Left-ventricular or left ventricle; SEM: Standard error of mean; SV: Stroke volume; TAC: Transverse aortic constriction
Acknowledgements
Dr. Magdalena Steiner, Dr. Katrin Suppelt and Dr. Dieter Fuchs (FUJIFILM VisualSonics) for helpful support during image analysis and software supply.
Funding
JG, TG and CO were supported by DynAge, FU Berlin. CJ and TG were supported by NZOcardio (100290384, DZHK) and the Gesundheitscampus Brandenburg. UK was supported by the DFG (KFO 218/2), the Else Kröner-Fresenius Stiftung (2014_A100), and the DZHK (BER 5.4 PR). WMK was supported by the Deutsche Forschungsgemeinschaft (DFG), the Canadian Institutes for Health Research (CIHR), and the Heart & Stroke Foundation of Canada (HSFC). TS was supported by BIH Twinning Research Grant (reference number 1.2.5.). CT was supported by the European 7th Framework Consortium REDDSTAR.
Availability of data and materials
The datasets used and/or analysed during the current study are available from the corresponding author on reasonable request.
Authors’contributions
JG: conception and design of study, animal treatment, echocardiographic
data acquisition and–analyses, statistics, preparation of manuscript. DR, KK,
KP, NB and TS: echocardiographic data acquisition and -analyses. CO and CJ: animal treatment, funding, preparation/review of manuscript. SvL, CT, RD, DM, NH, TG and UK: review of manuscript, funding. WMK: conception and design of study, preparation/review of manuscript, funding. All authors read and approved the final manuscript.
Ethics approval
All animal procedures were performed in accordance with the guidelines of the German Law on the Protection of Animals and were approved by the local authorities (Landesamt für Gesundheit und Soziales, Berlin, Germany).
Consent for publication
Not applicable.
Competing interests
The authors declare that they have no competing interests.
Publisher’s Note
Springer Nature remains neutral with regard to jurisdictional claims in published maps and institutional affiliations.
Author details
1Institute of Physiology, Charité-Universitätsmedizin Berlin, Charitéplatz 1,
10117 Berlin, Germany.2German Centre for Cardiovascular Research (DZHK),
partner site Berlin, 10117 Berlin, Germany.3Institute of Pharmacology, Center for Cardiovascular Research, Charité - Universitaetsmedizin Berlin, Hessische Straße 3-4, 10115 Berlin, Germany.4Experimental and Clinical Research
Center, a joint cooperation of Max-Delbrück Center for Molecular Medicine and Charité - Universitätsmedizin Berlin, 13125 Berlin, Germany.5Berlin Institute of Health (BIH), Berlin, Germany.6Max-Delbrück Center for Molecular
Medicine, 13125 Berlin, Germany.7Berlin–Brandenburger Center for
Regenerative Therapies (BCRT), Charité–Universitätsmedizin Berlin, Campus Virchow Klinikum (CVK), Berlin, Germany.8Department of Molecular Toxicology, German Institute of Human Nutrition Potsdam-Rehbruecke (DIfE), 14558 Nuthetal, Germany.9Department of Internal Medicine and Cardiology,
Charité–Universitätsmedizin Berlin, Campus Virchow Klinikum (CVK), Berlin, Germany.10HELIOS-Klinikum, Berlin, Germany.11German Center for Diabetes Research (DZD), 85764 Muenchen-Neuherberg, Germany.12Charité–
Universitätsmedizin Berlin, Freie Universität Berlin, Humboldt-Universität zu Berlin and BIH, Berlin, Germany.13Departments of Surgery and Physiology,
University of Toronto and Keenan Research Centre for Biomedical Science of St. Michael’s, Toronto, Canada.
Received: 14 February 2019 Accepted: 26 March 2019
References
1. Ram R, Mickelsen DM, Theodoropoulos C, Blaxall BC. New approaches in
small animal echocardiography: imaging the sounds of silence. Am J
Physiol Heart Circ Physiol. 2011;301:H1765–80.
2. Szulik M, Pappas CJ, Jurcut R, Magro M, Peeters E, Goetschalckx K, et al.
Clinical validation of a novel speckle-tracking–based ejection fraction
assessment method. J Am Soc Echocardiogr. 2011;24:1092–100.
3. Lang RM, Badano LP, Mor-Avi V, Afilalo J, Armstrong A, Ernande L, et al.
Recommendations for cardiac chamber quantification by echocardiography in adults: an update from the American Society of Echocardiography and the European Association of Cardiovascular Imaging. J Am Soc
Echocardiogr. 2015;28:1–39 e14.
4. Heinen A, Raupach A, Behmenburg F, Hölscher N, Flögel U, Kelm M, et al.
Echocardiographic analysis of cardiac function after infarction in mice: validation of single-plane long-Axis view measurements and the bi-plane
Simpson method. Ultrasound Med Biol. 2018;44:1544–55.
5. Ponikowski P, Voors AA, Anker SD, Bueno H, Cleland JGF, Coats AJS, et al.
2016 ESC guidelines for the diagnosis and treatment of acute and chronic heart failure: the task force for the diagnosis and treatment of acute and chronic heart failure of the European Society of Cardiology (ESC)developed with the special contribution of the heart failure association (HFA) of the
ESC. Eur Heart J. 2016;37:2129–200.
6. Dorosz JL, Lezotte DC, Weitzenkamp DA, Allen LA, Salcedo EE. Performance
of 3-dimensional echocardiography in measuring left ventricular volumes
and ejection fraction. J Am Coll Cardiol. 2012;59:1799–808.
7. Grune J, Blumrich A, Brix S, Jeuthe S, Drescher C, Grune T, et al. Evaluation
of a commercial multi-dimensional echocardiography technique for ventricular volumetry in small animals. Cardiovasc Ultrasound. 2018;16:10.
8. Hoffmann R, Barletta G, von Bardeleben S, Vanoverschelde JL, Kasprzak J,
Greis C, et al. Analysis of left ventricular volumes and function: a multicenter comparison of cardiac magnetic resonance imaging, cine Ventriculography, and unenhanced and contrast-enhanced two-dimensional and
three-dimensional echocardiography. J Am Soc Echocardiogr. 2014;27:292–301.
9. Muraru D, Badano LP, Piccoli G, Gianfagna P, Del Mestre L, Ermacora D,
et al. Validation of a novel automated border-detection algorithm for rapid and accurate quantitation of left ventricular volumes based on three-dimensional echocardiography. Eur Heart J Cardiovasc Imaging. 2010;11:
359–68.
10. Barbosa D, Heyde B, Dietenbeck T, Houle H, Friboulet D, Bernard O, et al.
Quantification of left ventricular volume and global function using a fast automated segmentation tool: validation in a clinical setting. Int J
Cardiovasc Imaging. 2013;29:309–16.
11. Cannesson M, Tanabe M, Suffoletto MS, McNamara DM, Madan S, Lacomis
JM, et al. A novel two-dimensional echocardiographic image analysis system using artificial intelligence-learned pattern recognition for rapid
12. Knackstedt C, Bekkers SCAM, Schummers G, Schreckenberg M, Muraru D, Badano LP, et al. Fully automated versus standard tracking of left ventricular
ejection fraction and longitudinal strain. J Am Coll Cardiol. 2015;66:1456–66.
13. Beyhoff N, Brix S, Betz IR, Klopfleisch R, Foryst-Ludwig A, Krannich A, et al.
Application of speckle-tracking echocardiography in an experimental model of
isolated subendocardial damage. J Am Soc Echocardiogr. 2017;30:1239–1250.e2.
14. Wilck N, Markó L, Balogh A, Kräker K, Herse F, Bartolomaeus H, et al. Nitric
oxide–sensitive guanylyl cyclase stimulation improves experimental heart
failure with preserved ejection fraction. JCI Insight 2018 [cited 2018 Aug 9];
3. Available from:https://insight.jci.org/articles/view/96006.
15. Grune J, Beyhoff N, Smeir E, Chudek R, Blumrich A, Ban Z, et al. Selective
mineralocorticoid receptor cofactor modulation as molecular basis for
Finerenone’s Antifibrotic ActivityNovelty and significance. Hypertension.
2018;71:599–608.
16. Grune J, Benz V, Brix S, Salatzki J, Blumrich A, Höft B, et al. Steroidal and
nonsteroidal mineralocorticoid receptor antagonists cause differential cardiac gene expression in pressure overload-induced cardiac hypertrophy.
J Cardiovasc Pharmacol. 2016;67:402–11.
17. Kotnik K, Popova E, Todiras M, Mori MA, Alenina N, Seibler J, et al. Inducible
transgenic rat model for diabetes mellitus based on shRNA-mediated gene knockdown. Joly E, editor. PLoS One 2009;4:e5124.
18. Langheinrich M, Lee MA, Böhm M, Pinto YM, Ganten D, Paul M. The
hypertensive Ren-2 transgenic rat TGR (mREN2)27 in hypertension research.
Characteristics and functional aspects. Am J Hypertens. 1996;9:506–12.
19. Johnson TV, Symanski JD, Patel SR, Rose GA. Improvement in the
assessment of diastolic function in a clinical echocardiography laboratory following implementation of a quality improvement initiative. J Am Soc
Echocardiogr. 2011;24:1169–79.
20. Zhang Q, Liang Y-J, Zhang Q-H, Li R-J, Chua Y, Xie J-M, et al. Impact of
a dedicated training program on the reproducibility of systolic Dyssynchrony measures using tissue Doppler imaging. J Am Soc
Echocardiogr. 2012;25:210–7.
21. McGowan JH, Cleland JG. Reliability of reporting left ventricular systolic
function by echocardiography: a systematic review of 3 methods. Am Heart
J. 2003;146:388–97.
22. Brau ACS, Hedlund LW, Johnson GA. Cine magnetic resonance microscopy
of the rat heart using cardiorespiratory-synchronous projection
reconstruction. J Magn Reson Imaging. 2004;20:31–8.
23. Brinegar C, Y-JL W, Foley LM, Hitchens TK, Ye Q, Ho C, et al. Real-time
cardiac MRI without triggering, gating, or breath holding. Conf Proc IEEE
Eng Med Biol Soc. 2008;2008:3381–4.
24. Pais-Roldán P, Biswal B, Scheffler K, Yu X. Identifying respiration-related
aliasing artifacts in the rodent resting-state fMRI. Front Neurosci. 2018; 12:788.
25. Nagata Y, Kado Y, Onoue T, Otani K, Nakazono A, Otsuji Y, et al. Impact of
image quality on reliability of the measurements of left ventricular systolic function and global longitudinal strain in 2D echocardiography. Echo Res
Pract. 2018;5:27–39.
26. Tighe DA, Rosetti M, Vinch CS, Chandok D, Muldoon D, Wiggin B, et al.
Influence of image quality on the accuracy of real time three-dimensional echocardiography to measure left ventricular volumes in unselected patients: a
comparison with gated-SPECT imaging. Echocardiography. 2007;24:1073–80.
27. Maret E, Brudin L, Lindstrom L, Nylander E, Ohlsson JL, Engvall JE.
Computer-assisted determination of left ventricular endocardial borders reduces variability in the echocardiographic assessment of ejection fraction. Cardiovasc
Ultrasound 2008 [cited 2018 Aug 11];6. Available from:http://
cardiovascularultrasound.biomedcentral.com/articles/10.1186/1476-7120-6-55.
28. Arroyo-Carmona RE, López-Serrano AL, Albarado-Ibañez A, Mendoza-Lucero
FMF, Medel-Cajica D, López-Mayorga RM, et al. Heart rate variability as early biomarker for the evaluation of diabetes mellitus Progress. J Diabetes Res.
2016;2016:1–8.
29. Stables CL, Auerbach DS, Whitesall SE, D’Alecy LG, Feldman EL. Differential
impact of type-1 and type-2 diabetes on control of heart rate in mice.
Auton Neurosci. 2016;194:17–25.
30. Garcia-Menendez L, Karamanlidis G, Kolwicz S, Tian R. Substrain specific
response to cardiac pressure overload in C57BL/6 mice. Am J Physiol Heart
Circ Physiol. 2013;305:H397–402.
31. Zhao M, Fajardo G, Urashima T, Spin JM, Poorfarahani S, Rajagopalan V, et al.
Cardiac pressure overload hypertrophy is differentially regulated by -adrenergic