R E S E A R C H A R T I C L E
Open Access
Hydrogen mobility in transition zone
silicates
Razvan Caracas
1*and Wendy R. Panero
2Abstract
We study the hydrogen mobility in ringwoodite and wadsleyite considering multiple charge-balanced defects, including Mg < = > 2H, Si < = > Mg + 2H, and the hydrogarnet defect, Si < = > 4H, using molecular dynamics simulations based on the density functional theory at transition zone pressures and temperatures between 1500 and 2500 K. We determine the diffusion coefficients and study in detail the mechanism of hydrogen mobility during lengthy simulations. Our results show that temperature, water concentration, and defect mechanism have a significant effect on mobility. We find that the fastest diffusion is for the Mg < = > 2H defect, while H is more mobile when incorporated as Si < = > Mg + 2H than as hydrogarnet defects. The computed diffusivities for ringwoodite are larger than for wadsleyite: at 2000 K, diffusivity is 1.13 × 10−09m2/s for ringwoodite compared to 0.93 × 10−09m2/s for wadsleyite. In general, the hydrogen atoms spend on the order of tens of picoseconds or more trapped in or around the vacancy sites with net migration between sites over timescales of tens of femtoseconds. At 2500 K, some of these hydrogen excursions take place over several angstroms, while at 2000 K, they do not always result in net diffusion. At 1500 K, most of the defects fail to make excursions from their defect sites resulting in diffusion.
Keywords:Diffusion, Transition zone, Wadsleyite, Ringwoodite, Transport, Electrical conductivity, Defects, Hydrogen
Introduction
The incorporation of water in major mantle minerals af-fects the physical properties of these minerals, even with low concentrations of water. The introduction of water as hydrogen defects reduces seismic wave velocities (e.g., Jacobsen and Smyth 2006), enhances deformation (Kavner 2003), and increases electrical conductivity (Huang et al. 2005; Yoshino et al. 2009).
The transition zone is dominated by polymorphs of oliv-ine, in which wadsleyite (I2/m) is stable from 410–520 km depth, transforming to ringwoodite (Fd3m), stable from 520–660 km depth. As synthesized in the laboratory, each of these polymorphs can store water in excess of 2 wt%, making them the primary focus for detecting water in the deep mantle. Wadsleyite incorporates hydrogen predom-inantly through Mg < = > 2H defects (Smyth et al. 1997) while ringwoodite accommodates hydrous defects through multiple defect mechanisms, dominated by the same Mg < = > 2H defect, but also with the hydrogarnet
defect, Si < = > 4H, and minor Si < = > Mg + 2H (Panero 2010; Panero et al. 2013).
The amount of water actually stored in the transition zone, however, may be significantly less than the total capacity. While an inclusion of ringwoodite in diamond suggests that localized regions of hydrated ringwoodite are possible (Pearson et al. 2014), seismic velocity and phase boundaries (Houser 2016) and electrical conduct-ivity of the transition zone are more consistent with a mantle significantly undersaturated in water.
Electrical conductivity of the Earth’s mantle varies sig-nificantly with depth and tectonic regime, including in the transition zone, in which the conductivity at the base of the transition zone is greater than the upper part of the transition zone (e.g., Kelbert et al. 2009; Shimizu et al. 2010). This variability is likely a complex function of temperature, composition (particularly H, Fe, and redox), and tectonic history. Indeed, the electrical conductivity of ringwoodite and wadsleyite vary as a function of water and iron content (e.g., Huang et al. 2005; Yoshino et al. 2009), with likely significant contributions from both pro-ton and polaron conductivities. While disagreement re-mains as to the absolute values of conductivity in these
* Correspondence:[email protected]
1CNRS, Ecole Normale Supérieure de Lyon, Université Claude Bernard Lyon 1,
Laboratoire de Géologie de Lyon, CNRS UMR 5276, Lyon, France Full list of author information is available at the end of the article
materials, the electrical conductivity of hydrous ringwoo-dite is consistently found to be greater than hydrous wad-sleyite for comparable water contents and experimental conditions but with different dependencies on absolute water content.
Direct measurements of hydrogen diffusivity in wad-sleyite and ringwoodite under transition zone pressures and conditions are limited (Hae et al. 2006; Ohtani and Zhao 2009; Sun et al. 2015), in which these measurements include the complicating effects of iron that appears to enhance electrical conductivity through proton-polaron exchange mechanisms. The hydrogen diffusivity data are consistent with the electrical conductivity in which the H conductivity in ringwoodite exceeds that of wadsleyite.
We therefore calculate the diffusivity of hydrogen in ringwoodite at mantle-relevant conditions from ab initio molecular dynamics. While this is a well-established standard technique for melts and fluids (e.g., Tse 2002; Schweiger et al. 2008; Mookherjee et al. 2008), it is an unusual approach for solids due to the length of required calculations for appropriate statistics. For the latter, the large majority of the previous calculations (e.g., Bunson et al. 1999; Ammann et al. 2011) instead resolved to determine the activation energy along an assumed diffusion path, which combined with the con-centration of vacancies, allowed to estimate the diffusion coefficients. Our approach is more daring: we insert hydrogen in the structures as defects in exchange for cations and obtain the self-diffusion coefficients directly from long molecular dynamics simulations; consequently, we also capture the diffusion path.
With these considerations, we investigate in detail the mobility of hydrogen in ringwoodite as a function of temperature, defect mechanism, and defect geometry. We compare our results to calculations in wadsleyite and further consider the effects of shear and strain on wadsleyite. We also examine the pathway through which hydrogen diffuses to suggest the consequences of inter-actions with point defects and dislocations in hydrogen diffusivity. We estimate the effect of hydrogen on the electrical conductivity of the major minerals of the Earth’s transition zone through the Nernst-Einstein relation and assess the contribution of hydrogen to the measured mantle conductivity.
Methods/experimental
We perform first-principles molecular dynamics simula-tions. We allow the atoms to move in a crystal according to the Newtonian dynamics (molecular dynamics) under the action of interatomic forces computed within the density functional theory (DFT) (first principles). We use the planar-augmented wavefunction (PAW) formulation (Blochl 1994) of the DFT the VASP implementation (Kresse and Hafner 1993; Kresse and Joubert 1999) to
compute the forces. The exchange-correlation energy is expressed in the Perdew-Burke-Ernzerhof form (Perdew et al. 1996) of the generalized gradient approximation. We employ a 500 eV cutoff for the kinetic energy, 700 eV for the augmented cutoff, and the Γ point to sample the reciprocal space.
We use isokinetic NVT ensembles, where the velocity of the atoms is rescaled at each time step to fit the temperature,T, at fixed volume,V, and number of atoms, N, in the simulation box. The isokinetic NVT can be seen as an extreme version of the Nose-Hoover thermostat where the oscillation period of the temperature is set to the time step. We perform the simulations at volumes corresponding to transition zone pressures.
In all our calculations, we allow for long simulation times, between 70 and 200 ps at each condition with a time step of 1 fs. A 70 ps simulation requires the equivalent of about 500 processor days of computing time.
For ringwoodite, we consider several hydrogen incorp-oration mechanisms (Panero 2010): Mg2+< = > 2H+, Si4+ < = > Mg2++ 2H+, and the hydrogarnet substitution, Si4+ < = > 4H+. We consider two different H/O atomic ratios per simulation cell: 1/32 and 2/32 each in two different geometries: a 2 × 1 × 1 supercell of the conventional cell and a 2 × 2 × 2 supercell of the primitive cell, with 16 Mg2SiO4formula units. The simulations are run at 1500,
2000, and 2500 K with the same initial specific volume of ringwoodite, corresponding to about 25 GPa. Temperature and the substitution mechanisms affect the actual pressure of the simulations, but in all cases, the pressure remains in an interval of about 23 to 33 GPa. Over this pressure range, we do not expect the values of the diffusivity to change significantly.
We compare the ringwoodite diffusivities to the Mg2+ < = > 2H+ defect on the M3 site in wadsleyite, the only active defect mechanism (Tsuchiya and Tsuchiya 2009), in a simulation box of one unit cell, or eight molecular units. To accelerate the diffusion, we also study the effect of strain. In order to compensate for the smaller simulation sizes, the simulation times of wadsleyite are longer, on the order of 100 ps.
The diffusion coefficient of hydrogen, D0, in each
calculation is obtained as the slope of the mean square displacements, MSD, as a function of time:
D¼MSD=6t ð1Þ
where, t is time, and 6 is a geometric factor describing motion in three dimensions. MSD is the mean square displacement defined as:
MSD¼<½r tð Þ−r tð Þ0
^
2> ð2Þthermalization type of at least 2 ps, and t-t0 window
glides over the entire remaining simulation time. Values less than ~1.0 × 10⁻¹⁰ m2/s are an indication that the hydrogen atoms jump on a timescale similar to or greater than the total simulation time, and we include diffusivities for calculations only when the MSD is a lin-ear function of time. Otherwise, we interpret that there are insufficient statistics to obtain reliable diffusion coefficients.
The diffusivity is a function temperature and can be modeled with D0 as prefactor and the activation
en-thalpyH,
D¼D0expð−H=RTÞ ð3Þ
Where Ris the gas constant and T is temperature in Kelvin.
We estimate the contribution proton conductivity makes to the apparent electrical conductivity,σ, with the Nernst-Einstein relation,
σ¼ F2=R Dq2c=T ð4Þ
whereFis Faraday's constant,qis the charge on the ion (+1), andcis concentration.
Results and discussion
Typical mean square displacement plots as a function of time are shown in Fig. 1 at both 2000 and 2500 K. Other MSD plots at 2000 K show larger irregularities; in those cases only the slope in the second half of the diagram was considered, which is linear. If the MSD is unchan-ging with time (e.g., for Mg, Si, and O in Fig. 1), this was a sign for no diffusion during the duration of our simu-lation and those points were discarded.
Table 1 summarizes the diffusion results of all the sim-ulations performed for the Mg2+< = > 2H+, Si4+< = > Mg2++ 2H+, and Si4+< = > 4H+substitutions in ringwoo-dite and different H concentrations, and 2000 and 2500 K, and for the Mg2+< = > 2H+substitution in wad-sleyite, at 1500 and 2000 K. There is no net diffusion in ringwoodite at 1500 K. The calculations span a range of temperatures greater than the entire transition zone. For each simulation, we also indicate the average pressure of the constant volume calculations.
Based on the computed diffusion coefficients, we fit the prefactor D0and the activation enthalpy, H, for each
defect mechanism, concentration and phase according to Eq. (3). The values are listed in Table 2. They should be taken with care, as pressure increases with temperature in these isochoric calculations.
a
b
c
d
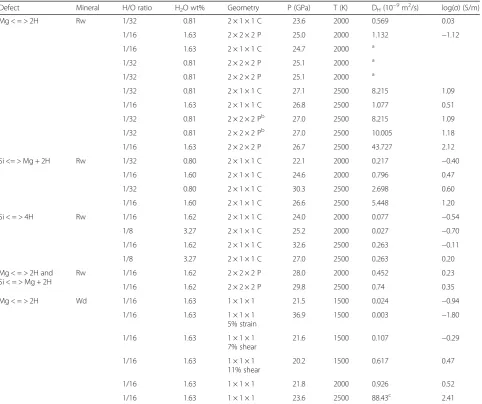
Table 1Calculations on H-bearing ringwoodite and wadsleyite
Defect Mineral H/O ratio H2O wt% Geometry P (GPa) T (K) DH(10−
9
m2/s) log(σ) (S/m)
Mg < = > 2H Rw 1/32 0.81 2 × 1 × 1 C 23.6 2000 0.569 0.03
1/16 1.63 2 × 2 × 2 P 25.0 2000 1.132 −1.12
1/16 1.63 2 × 1 × 1 C 24.7 2000 a
1/32 0.81 2 × 2 × 2 P 25.1 2000 a
1/32 0.81 2 × 2 × 2 P 25.1 2000 a
1/32 0.81 2 × 1 × 1 C 27.1 2500 8.215 1.09
1/16 1.63 2 × 1 × 1 C 26.8 2500 1.077 0.51
1/32 0.81 2 × 2 × 2 Pb 27.0 2500 8.215 1.09
1/32 0.81 2 × 2 × 2 Pb 27.0 2500 10.005 1.18
1/16 1.63 2 × 2 × 2 P 26.7 2500 43.727 2.12
Si <= > Mg + 2H Rw 1/32 0.80 2 × 1 × 1 C 22.1 2000 0.217 −0.40
1/16 1.60 2 × 1 × 1 C 24.6 2000 0.796 0.47
1/32 0.80 2 × 1 × 1 C 30.3 2500 2.698 0.60
1/16 1.60 2 × 1 × 1 C 26.6 2500 5.448 1.20
Si < = > 4H Rw 1/16 1.62 2 × 1 × 1 C 24.0 2000 0.077 −0.54
1/8 3.27 2 × 1 × 1 C 25.2 2000 0.027 −0.70
1/16 1.62 2 × 1 × 1 C 32.6 2500 0.263 −0.11
1/8 3.27 2 × 1 × 1 C 27.0 2500 0.263 0.20
Mg < = > 2H and Si < = > Mg + 2H
Rw 1/16 1.62 2 × 2 × 2 P 28.0 2000 0.452 0.23
1/16 1.62 2 × 2 × 2 P 29.8 2500 0.74 0.35
Mg < = > 2H Wd 1/16 1.63 1 × 1 × 1 21.5 1500 0.024 −0.94
1/16 1.63 1 × 1 × 1
5% strain
36.9 1500 0.003 −1.80
1/16 1.63 1 × 1 × 1
7% shear
21.6 1500 0.107 −0.29
1/16 1.63 1 × 1 × 1
11% shear
20.2 1500 0.617 0.47
1/16 1.63 1 × 1 × 1 21.8 2000 0.926 0.52
1/16 1.63 1 × 1 × 1 23.6 2500 88.43c 2.41
Summary of all the simulations performed on ringwoodite (R) and wadsleyite (W). Temperatures (T) and pressures (P) are also indicated. The 2 × 1 × 1 C and 2 × 2 × 2 P geometries represents supercell of the respectively Conventional and Primitive unit cells of ringwoodite
Rwringwoodite structure,Wdwadsleyite structure a
There is no net diffusion observed during the duration of the simulation b
The two values are for two different simulations c
Wadsleyite at 2500 K is molten; the value is given here only as reference
Table 2Hydrogen diffusivity
Defect Mineral H/O ratio H2O wt% Geometry D0(m2/s) H (kJ/mol)
Mg < = > 2H R 1/16 1.63 2 × 2 × 2 P 9.73E-02 303.8
1/32 0.81 2 × 1 × 1 C 4.16E-04 224.5
Si < = > Mg + 2H R 1/16 1.60 2 × 1 × 1 C 1.19E-05 159.9
1/32 0.80 2 × 1 × 1 C 6.44E-05 209.5
Si < = > 4H R 1/8 1.62 2 × 1 × 1 C 5.05E-04 260.9
1/16 3.27 2 × 1 × 1 C 2.26E-06 188.3
Mg < = > 2H and Si < = > Mg + 2H R 1/16 1.62 2 × 2 × 2 P 5.32E-04 232.4
Mg < = > 2H W 1/16 1.63 1 × 1 × 1 5.62E-05 183.2
The hydrogen atoms typically spend several tens of pi-coseconds in one given cation vacancy site in between the diffusion jumps. The shape of their local trajectory depends on this site. Diffusion is realized in rapid (<100 fs) transfers between stable defect sites. During a time that is on the order of up to a tenth of a picosec-ond, the hydrogen atoms may undergo an excursion that can be up to several angstroms long. There are cases, es-pecially at low temperature (1500 K) when the outcome of such an excursion is cut short and the atoms return to the initial cage. But at 2000 and 2500 K, most of these excursions result in a net displacement. This is the mechanism of the diffusion. The diffusion trajectory is a function of defect.
H migration in ringwoodite
In ringwoodite, the hydrogen atoms that are part of the Si < = > 4H defects and the Si < = > Mg + 2H defects rap-idly switch between the predicted lowest energy posi-tions on the outside face of each polyhedron, generally maintaining maximum distance between the hydrogen atoms associated with each defect. Their trajectory re-sults in apparent crosses on the faces of the tetrahedra (Figs. 2 and 3).
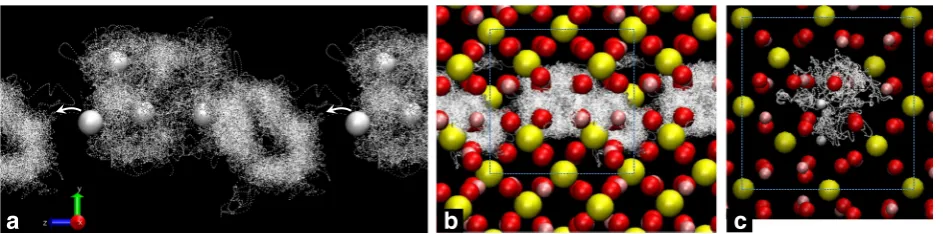
Figure 2 shows a part of the trajectories of the four H atoms that substitute one Si atom for the Si < = > 4H defect. The H atoms remain around the initial vacancy. After 11 ps in the simulation one of them exits the va-cancy, moves away around an O atom (Fig. 2) to be trapped in an empty adjacent octahedron, inside which it moves around describing a donut shape. Finally, the H atom undergoing the excursion falls back into a Si va-cancy close to the other three hydrogen atoms but situ-ated at a distance of one unit cell from the initial defect. During this time, it covers the equivalent net distance of one lattice parameter. The case analyzed here corre-sponds to one substituted Si in a 2 × 1 × 1 conventional
supercell. As expected, the H diffuses along the shortest path, they-orz-axis. In Fig. 2b, c, it is clearly seen a dif-fusion pattern similar to a channel. An increase in temperature by 500 K leads to an increase in diffusion by more than one order of magnitude.
In case of the Si < = > Mg + 2H substitution, an excess Mg lies on the Si vacancy site; the H atoms are on the outer parts of the SiO6tetrahedra. The pathway to
initi-ate diffusion passes through an empty interoctahedral space. Not all H excursions result in net diffusion (Fig. 3) at 2000 K.
For the Mg < = > 2H defect mechanism, the hydrogen atoms migrate rapidly within a plane of the vacant Mg octahedron defined by the direction perpendicular to the edge-sharing Mg octahedra and sub-parallel to the plane defined by corner-sharing Si tetrahedra (Fig. 4) mapping out a “donut” shape about the octahedral vacancy. This plane reflects the crystallographic equivalent sites with the lowest energy positions as predicted by Panero (2010). The pair of hydrogen atoms is oriented such that their distance to the neighboring Mg octahedra is maxi-mized, which also carry a positive charge. The actual trajectory is easily identified due to its donut shape.
All Mg < = > 2H defects exchange H atoms during the course of the simulations; their diffusion paths follow not only the directions of the unit cell axis, as in the cases discussed above, but also along a diagonal.
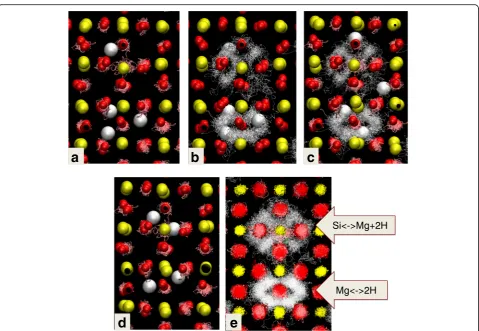
Finally, the simulation of two adjacent defects of dif-ferent types (Mg < = > 2H and Si < = > Mg + 2H) in the 2 × 2 × 2 primitive supercell shows how these defects interact. About 34.7 ps into the simulation, three hydro-gen atoms are found around the Mg vacancy, and one H atom around the Si vacancy. Figure 5a shows the trajectory of the Mg atoms over about 0.8 ps and a snapshot of the position of the other atoms before the diffusion jump. It is clearly seen that the defect Mg stays inside the Si vacancy. The same snapshot with the H trajectory over 2 ps is
a
b
c
shown in Fig. 5b: the characteristic donut and cross shapes are clearly identifiable. One hydrogen atom is shown dur-ing its jump in snapshot in Fig. 5c. The jump requires just a few tens of femtoseconds. Eventually, the H falls into the neighboring vacancy, each of which containing now two H atoms (Fig. 5d). A similar but reverse process was respon-sible for obtaining the three H atoms in the Mg vacancy site. Figure 4e shows a 20 ps duration of trajectories of all the atoms from the same structural fragment.
H migration in wadsleyite
In wadsleyite, static calculations of H defects show that pairs of H in the Mg < = > 2H defect tend to align with the OH dipoles parallel to thez-axis (Tsuchiya and Tsuchiya 2009). In our dynamical simulations at the lowest temper-atures in our simulations (1500 K), the H atoms explore the vacancy site, intranspositions. At 2000 K, they escape easily from their initial sites and wander around to realize a net diffusion.
a
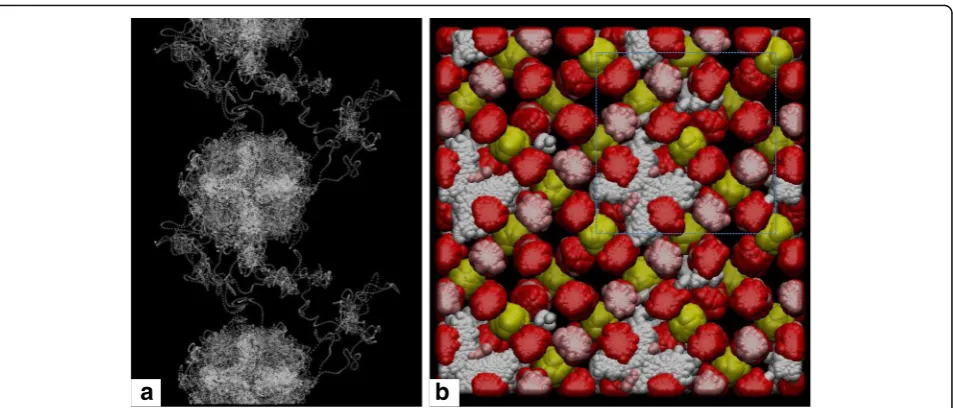
b
Fig. 3H diffusion for the Si⇔Mg + 2H defects at 2500K. They are computed in a 2 × 1× 1 convention supercell with one defect (a) and in a 2× 2× 2 primitive supercell containing two defects (b).aOnly the trajectory of H is shown, with all the other atoms omitted for clarity. H atoms describe crosses-like patterns on the outside parts of the SiO4tetrahedra. H atoms undergo lengthy excursions before falling back into the vacancy site.bThe trajectory described by all the atoms during 35 ps is represented here.Pink,yellow,redandwhiterepresent respectively the Mg, Si, O, and H atoms. Not all excursions of H result in net diffusion, as seen from the defect in thelower leftpart of the image: H falls back into the initial site after escaping into the adjacent empty octahedron for a short time. The unit cell is outlined withdashed line
Comparable simulations on wadsleyite were performed in one unit cell, with eight formula units, so that water concentrations are comparable between the wadsleyite and ringwoodite simulations. The diffusion of hydrogen is realized in channel-like trajectories continuous along the z-axis and interconnected along the y-axis (Fig. 6). The H atoms, as in ringwoodite, diffuse by hopping between the O atoms and avoiding the Mg sites. They move around the SiO4 tetrahedra but prefer the vacant
inter-tetrahedral space.
At 2500 K and 23.6 GPa in wadsleyite (Table 1), MSD shows net displacements for all oxygen, silicon, and magnesium atoms in the structure, and therefore, we interpret that this calculation reflects a melt, consistent with the melting temperature of wadsleyite. The hydro-gen diffusivity calculated in this simulation, 88.10−9m2/ s, then reflects the diffusivity of H in a molten system. Our hydrogen-bearing calculations show the presence of melt of lower temperatures than both previous freezing simulations on anhydrous liquid Mg2SiO4 (De Koker et
al. 2008) and recent static experimental data (Liebske and Frost 2012) consistent with melting-point depression for hydrated materials.
Energy considerations
There is no obvious relation between the position of the hydrogen atoms along their diffusion path and the fluc-tuation in total energy of the system. There are examples when the local energy maximum corresponds to migra-tion of one H atom between sites, but in these cases, the energy profile does not resemble that of a saddle point. Furthermore, the next local energy maximum corre-sponds to H inside or around its new host site. This behavior reflects the complex relationship between the position of all the atoms in the lattice and the total energy of the lattice, not just the hydrogen positions. The energy fluctuations that we compute include contri-butions from not only the position of the diffusing atoms but also the vibrational contributions. For example, Fig. 7a shows the fluctuations in total energy computed
a
b
d
e
c
during several picoseconds for the Si < = > 4H substitu-tion in ringwoodite. These fluctuasubstitu-tions are regularly ob-served during NVT simulations. Details in Fig. 7b are shown prior, during, and after the escape of the H atom in the Si < = > 4H substitution depicted in Fig. 2 and dis-cussed in detail above. There is no clear relation be-tween the position of the hydrogen atoms along the diffusion path and the total energy of the system. This
might also raise questions about the validity of the acti-vation energy approach within a partially fixed lattice in static (i.e., 0 K) or nudged-elastic band simulations.
Factors affecting diffusion rate: phase, substitution mechanism, concentration, and temperature
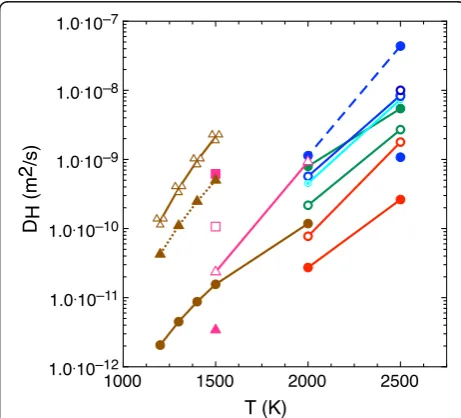
For ringwoodite, we find no statistically significant net migration of hydrogen at 1500 K in any of the calcula-tions. Figure 8 shows the diffusion rates we obtained for each calculation in Table 1, with fits to Eq. (3) in Table 2. In ringwoodite, the Mg < = > 2H defect leads to the greatest H diffusivities at both 2000 and 2500 K signifi-cantly increasing with increased water concentration. We find that the apparent diffusivity is greater in the 2 × 2 × 2 primitive cell than in the 2 × 1 × 1 conventional cell, and that for constant temperature and geometry, the diffusivity increases with increasing defect density. The largest values of diffusion are greater than 10−9m2/ s at 2000 K and increase to 4.4 × 10⁻⁸ at 2500 K. Such high values of the H diffusion are comparable to the ones obtained in cold hydrous MgSiO3 silicate melts
(Karki et al. 2010): on the order of 2 × 10⁻⁸ m2/s at
Fig. 8Hydrogen diffusion coefficients in ringwoodite and wadsleyite as a function of temperature. Mg < = > 2H, Si < = > Mg + 2H, and Si < = > 4H defect mechanisms are respectively plotted inblue,green, andred. Ringwoodite results are represented with one (open circles) and two (solid circles) defects per simulation supercell in the 2 × 2 × 2 primitive (dashed lines) and 2 × 1 × 1 conventional (solid lines) supercells. The combined Mg < = > 2H and Si < = > Mg + 2H defects in the same 2 × 2 × 2 supercell is shown withdotted circles. Wadsleyite is inpurple:empty trianglesfor Mg < = > 2H defect,empty squareswith 7% shear,solid squareswith 15% shear,solid trianglewith 5% uniaxial strain.Brown circlesare extrapolated experimental data from Sun et al. (2015) for ringwoodite,brown trianglesfrom Hae et al. (2006) for wadsleyite. Triple emptytrianglesare for experiments in polycrystalline wadsleyite (Ohtani and Zhao 2009)
Fig. 6Diffusion of H in the wadsleyite structure at 2000 K. The structural fragment shown here represents the H trajectories during 60 picoseconds after thermalization at 2000 K spanning several unit cells. The diffusion is realized in the (010) plane, containing the shortest lattice parameters
2500 K and 0 GPa, and 3 × 10⁻⁸ m2/s at 3000 K and 20 GPa. This suggests that either solid hydrous ringwoo-dite at 2500 K is superheated or that the hydrous melts at 3000 K are supercooled.
Consistently, lower hydrogen diffusivities are found in the other two defects. Hydrogen in the Si < = > Mg + 2H defect diffuse faster at each temperature than hydrogen in Si < = > 4H defects for all concentrations and supercell geometries calculated. Doubling the water content in each calculation changes the inferred hydrogen diffusivity by a factor of two but with opposite effect: it increases mobility of hydrogen associated with the Si < = > Mg + 2H defect yet decreases when associated with the Si < = > 4H defect.
The simulations with the combined Mg < = > 2H and Si < = > Mg + 2H defects yield diffusion coefficients that fall, as expected, between the equivalent concentration Mg < = > 2H calculations and the Si < = > Mg + 2H calcu-lations. While each defect is active in ringwoodite, the Mg < = > 2H defect is dominant, particularly at concentrations below 1 wt% (Panero et al. 2013). Therefore, as the mech-anism with both the greatest hydrogen diffusivity and greatest concentration, we consider the diffusivity of hydrogen in the Mg < = > 2H defect to control the diffu-sivity of hydrogen in ringwoodite.
The experimental hydrogen diffusion data for ring-woodite extrapolated to 2000 K falls in the middle of the range of values we obtained in our simulations (Ohtani and Zhao 2009; Sun et al. 2015). The inferred activation enthalpy in 2000–2500 K for ringwoodite in the fastest mechanism is 300 kJ/mol, significantly greater than the experimental value for iron-bearing polycrystalline and single-crystal ringwoodite, 140 and 101 kJ/mol, respect-ively. In contrast, the activation enthalpy in wadsleyite, 180 kJ/mol, is more similar to the polycrystalline, iron-bearing experimental measurements in wadsleyite of 123 kJ/mol. The presence of iron, additional defects, or experimental strain may explain the difference. Our computed activation enthalpies are larger than the ones obtained from static simulations (Verma and Karki 2009), by almost one order of magnitude in case of ring-woodite. Table 2 lists the diffusivity fits to our computed diffusion coefficients.
For wadsleyite however, the extrapolated experimental data (Hae et al. 2006) are greater than our theoretical results. As with the Ohtani and Zhao (2009) data, these experiments are measured in an iron-bearing polycrystal-line sample, which may explain their faster diffusivities values.
At 2000 K, the H diffusion in wadsleyite for the Mg < = > 2H defect is 0.93 × 10⁻⁹ m2/s. This is 16% less than the fastest value of 1.13 × 10⁻⁹m2/s computed for ringwoodite for the same defect and at the same temperature, consistent to the experimental hydrogen
diffusivity data (Hae et al. 2006; Ohtani and Zhao 2009) (Table 1).
To explore if the discrepancies with previously pub-lished diffusivities as discussed above are due to lattice strain, we calculated the diffusion under various systems of strains applied to the wadsleyite structure at 1500 K. We found that a 5% uniaxial strain along the x-axis re-duces the diffusivity by one order of magnitude accord-ing to the mean square-displacement analysis. However, as the values are already below 10−10 m2/s, they do not show diffusion; rather, they reflect an enhancement of the H localization. When pure sheared is applied, the values increase by about one order of magnitude for 7% shear and almost two orders for 10% shear. It is only this last case where actual net hydrogen transfers between the lattice sites is observed. While large strain values are highly unlikely to exist in a natural setting, we show that residual strains in experiments may lead to an underesti-mate of diffusivity due to H localization.
Electrical conductivity of the transition zone
Finally, we use the Nernst-Einstein relation to obtain the electrical conductivity from the diffusion coefficients. The values are reported on the last column of Table 1. They correspond to diffusivity inside single crystals.
The last column of Table 1 lists the computed conduct-ivities for each simulation. For ringwoodite, the highest values computed at 2500 K are on the order of 1.1 to 2.1 log(σ) (S/m). They correspond to the Mg < = > 2H defect that dominate the transport properties. Values at 2000 K are one order of magnitude lower. For wadsleyite, the computed log values of the conductivity are on the order of 0.5 log(σ) (S/m) at 2000 K.
Our values fall between the same order of magnitude down to two orders of magnitude below experimental values (Huang et al. 2005; Sun et al. 2015). This is most probably due to crystallinity: the diffusion along the grain boundaries plays a major role in the total transport. Measurements on real crystals show values order of magnitude higher as obtained for single crystal (Sun et al. 2015) than polycrystalline samples (Ohtani and Zhao 2009).
ringwoodite, is the hydrogen atoms associated with the dominant Mg < = > 2H defect.
We find that the associated inferred conductivity of ringwoodite is greater than that of wadsleyite at realistic mantle conditions. The computed values of the conductiv-ity and the difference between ringwoodite and wadsleyite are fully consistent with an increase in conductivity at the base of the Earth’s mantle (Kelbert et al. 2009; Shimizu et al. 2010) and may help signal the presence of significant (~1 wt%) water in the transition zone.
Conclusions
We study the main three mechanisms of incorporating hydrogen into the ringwoodite structure via chemical substitutions: Mg < = > 2H, Si < = > Mg + 2H, and the hydrogarnet defect, Si < = > 4H. We perform first-principles molecular dynamics simulations lasting up to a couple hundred picoseconds. Three Mg < = > 2H calcu-lations at 2000 K did not yield sufficient migration statis-tics to results in a reliable diffusivity in 200 ps of simulation time, which highlights that the starting con-ditions and the thermal history of the calculations may play a factor in the quantitative results.
We find that temperature and defect concentration increase the rate of the H diffusion. More isometric geometries, like the 2 × 2 × 2 primitive supercell also show faster diffusion than more anisotropic, like the 2 × 1 × 1 conventional supercell, similar to the reduction of diffusivity found in wadsleyite for 5% strain. We find that the Mg < = > 2H defect mechanism yields the great-est H diffusion rates, with the hydrogarnet substitution, Si < = > 4H, showing the slowest diffusion.
During the simulation time of several tens of picosec-onds, the H atoms travel over several lattice sites. However, during their path, they spend a considerable amount of time pinned in the defect sites. The diffusion is realized via jumps between the vacancy sites; during these jumps, the hydrogen atoms move around the neighboring O atoms, such as to continuously form OH bonds. They try to avoid at all cost the Mg cations, which are also positively charged; usually they stay in the void octahedral space. There is no obvious relation in the energy fluctuations dur-ing the simulations and the positions of the hydrogen atoms in the lattice—be they in the vacancy sites or during the diffusive jumps.
The Mg < = > 2H defects are more mobile in ringwoo-dite than wadsleyite. This result agrees with the proton conductivity inferences of Yoshino et al. (2009) and Huang et al. (2005), as well as the observed increase in electrical conductivity with depth through the transition zone (e.g., Khan et al. 2011; Olsen 1998).
Abbreviations
MSD:Mean square displacements
Acknowledgements
The calculations were performed on the ADA machine at the IDRIS Supercomputing Center, France, under eDARI grant x2016106368.
Funding
RC was funded by the Extreme Physics and Chemistry directorate of the Deep Carbon Observatory. WRP was funded by NSF via grant EAR 09-55647.
Authors’contributions
RC and WRP proposed the topic, conceived and designed the study, analyzed the data, and constructed the manuscript. RC ran the calculations. Both authors read and approved the final manuscript.
Competing interests
The authors declare that they have no competing interests.
Publisher’s Note
Springer Nature remains neutral with regard to jurisdictional claims in published maps and institutional affiliations.
Author details
1CNRS, Ecole Normale Supérieure de Lyon, Université Claude Bernard Lyon 1,
Laboratoire de Géologie de Lyon, CNRS UMR 5276, Lyon, France.2School of
Earth Sciences, Ohio State University, Columbus, OH 43210, USA.
Received: 31 August 2016 Accepted: 27 February 2017
References
Ammann MW, Brodholt JP, Dobson DP (2011) Ferrous iron diffusion in ferro-periclase across the spin transition. Earth Planet Sci Lett 302:393–402. doi:10.1016/j.epsl. 2010.12.031
Blochl PE (1994) Projector augmented-wave method. Phys Rev B 50:17953–17979 Bunson PE, Di Ventra M, Pantelides ST, Schrimpf RD, Galloway KF (1999) Ab initio
calculations of H+energetics in SiO
2: implications for transport. IEEE Trans Nuclear Sci 46:1568–1573
De Koker NP, Stixrude L, Karki BB (2008) Thermodynamics, structure, dynamics, and freezing of Mg2SiO4liquid at high pressure. Geoch Cosmochimica Acta 72:1427–1441. doi:10.1016/j.gca.2007.12.019
Hae R, Ohtani E, Kubo T, Koyama T, Utada H (2006) Hydrogen diffusivity in wadsleyite and water distribution in the mantle transition zone. Earth Planet Sci Lett 243:141–148. doi:10.1016/j.epsl.2005.12.035
Houser C (2016) Global seismic data reveal little water in the mantle transition zone. Earth Planet Sci Lett 448:94–101. doi:10.1016/j.epsl.2016.04.018 Huang X, Xu Y, Karato SI (2005) Water content in the transition zone from
electrical conductivity of wadsleyite and ringwoodite. Nature 434:746–749. doi:10.1038/nature03426
Jacobsen SD, Smyth JR (2006). Effect of water on the sound velocities of ringwoodite in the transition zone. Earth's Deep Water Cycle. In: Jacobsen SD, van der Lee S. Geophys Monogr Ser, vol. 168. pp. 131-145, AGU, Washington, DC
Karki BB, Bhattarai D, Mookherjee M, Stixrude L (2010) Visualization-based analysis of structural and dynamical properties of simulated hydrous silicate melt. Phys Chem Minerals 37:103–117
Kavner A (2003) Elasticity and strength of hydrous ringwoodite at high pressure. Earth Planet Sci Lett 214:645–654. doi:10.1016/S0012-821X(03)00402-3 Kelbert A, Schultz A, Egbert G (2009) Global electromagnetic induction constraints
on transition-zone water content variations. Nature 460:1003–1006 Khan A, Kuvshinov A, Semenov A (2011) On the heterogeneous electrical
conductivity structure of the Earth’s mantle with implications for transition zone water content. J Geophys Res Solid Earth 116:B01103. doi:10.1029/ 2010JB007458
Kresse G, Hafner J (1993) Ab initio molecular dynamics for liquid metals. Phys Rev B 47:558
Kresse G, Joubert D (1999) From ultrasoft pseudopotentials to the projector augmented-wave method. Phys Rev B 59:1758
Liebske C, Frost DJ (2012) Melting phase relations in the MgO–MgSiO3 system between 16 and 26GPa: implications for melting in Earth's deep interior. Earth Planet Sci Lett 345–348(C):159–170. doi:10.1016/j.epsl.2012.06.038 Mookherjee M, Stixrude L, Karki BB (2008) Hydrous silicate melt at high pressure.
Ohtani E, Zhao D (2009) The role of water in the deep upper mantle and transition zone: dehydration of stagnant slabs and its effects on the big mantle wedge. Russian Geol Geophys 50:1073–1078. doi:10.1016/j.rgg. 2009.11.006
Olsen N (1998) The electrical conductivity of the mantle beneath Europe derived from C-responses from 3 to 720 hr. Geophys J Int 133:298–308
Panero WR (2010) First principles determination of the structure and elasticity of hydrous ringwoodite. J Geophys Res 115:B03203. doi:10.1029/2008JB006282 Panero WR, Smyth JR, Pigott JS, Liu Z, Frost DJ (2013) Hydrous ringwoodite to 5
K and 35 GPa: multiple hydrogen bonding sites resolved with FTIR spectroscopy. Amer Mineral 98:637–642. doi:10.2138/am.2013.3978 Pearson DG, Brenker FE, Nestola F, McNeill J, Nasdala L, Hutchison MT et al (2014)
Hydrous mantle transition zone indicated by ringwoodite included within diamond. Nature 507:221–224. doi:10.1038/nature13080
Perdew JP, Burke K, Ernzerhof M (1996) Generalized gradient approximation made simple. Phys Rev Lett 77:3865–3868
Schweiger E, Sharma M, Gygi F, Galli G (2008) Melting of ice under pressure. Proc Nat Acad Sci 105:14779–14783
Shimizu H, Utada H, Baba K, Koyama T, Obayashi M, Fukao Y (2010) Three-dimensional imaging of electrical conductivity in the mantle transition zone beneath the North Pacific Ocean by a semi-global induction study. Phys Earth Planet Inter 183:252–269
Smyth JR, Kawamoto T, Jacobsen SD, Swope RJ, Hervig RL, Holloway JR (1997) Crystal structure of monoclinic hydrous wadsleyite [β-(Mg, Fe)2SiO4]. Amer Mineral 82:270–275
Sun W, Yoshino T, Sakamoto N (2015) Hydrogen self-diffusivity in single crystal ringwoodite: implications for water content and distribution in the mantle transition zone. Geophy Res Lett 42:06448. doi:10.1002/2015GL064486 Tse JS (2002) Ab initio molecular dynamics with density functional theory. Ann
Rev Phys Chem 62:249–290. doi:10.1146/annurev.physchem.53.090401.105737 Tsuchiya J, Tsuchiya T (2009) First principles investigation of the structural and
elastic properties of hydrous wadsleyite under pressure. J Geophys Res 114: B02206. doi:10.1029/2008JB005841.
Verma, AK, Karki, BB (2009) First-principles simulations of native point defects and ionic diffusion in high-pressure polymorphs of silica. Phys Rev B 79:214115. Yoshino T, Matsuzaki T, Shatskiy A, Katsura T (2009) Earth and planetary science
letters. Earth Planet Sci Lett 288:291–300. doi:10.1016/j.epsl.2009.09.032.
Submit your manuscript to a
journal and benefi t from:
7 Convenient online submission
7 Rigorous peer review
7 Immediate publication on acceptance
7 Open access: articles freely available online
7 High visibility within the fi eld
7 Retaining the copyright to your article