Evaluating the risk of nonresponse
bias in educational large‑scale assessments
with school nonresponse questionnaires:
a theoretical study
Sabine Meinck
1*, Diego Cortes
2and Sabine Tieck
1Background
In order to ensure the validity and reliability of cross-country comparative large-scale assessments, the IEA sets high quality standards for its survey instruments, as well as sampling and data collection procedures. All these quality indicators are regarded when
Abstract
Survey participation rates can have a direct impact on the validity of the data collected since nonresponse always holds the risk of bias. Therefore, the International Associa-tion for the EvaluaAssocia-tion of EducaAssocia-tional Achievement (IEA) has set very high standards for minimum survey participation rates. Nonresponse in IEA studies varies between studies and cycles. School participation is at a higher risk relative to within-school participation; school students are more likely to cooperate than adults (i.e., university students or school teachers). Across all studies conducted by the IEA during the last decade, between 7 and 33% of participating countries failed to meet the minimum participation rates at the school level. Quantifying the bias introduced by nonresponse is practically impossible with the currently implemented design. During the last dec-ade social researchers have introduced and developed the concept of nonresponse questionnaires. These are shortened instruments applied to nonrespondents, and aim to capture information that correlates with both: survey’s main outcome variable(s), and respondent’s propensity of participation. We suggest in this paper a method to develop such questionnaires for nonresponding schools in IEA studies. By these means, we investigated school characteristics that are associated with students’ average achievement scores using correlational and multivariate regression analysis in three recent IEA studies. We developed regression models that explain with only 11 school questionnaire variables or less up to 77% of the variance of the school mean achieve-ment score. On average across all countries, the R2 of these models was 0.24 (PIRLS),
0.34 (TIMSS, grade 4) and 0.36 (TIMSS grade 8), using 6–11 variables. We suggest that data from such questionnaires can help to evaluate bias risks in an effective way. Fur-ther, we argue that for countries with low participation rates a change in the approach of computing nonresponse adjustment factors to a system were school´s participation propensity determines the nonresponse adjustment factor should be considered.
Keywords: Nonresponse bias, Multistage sample surveys, Weighting adjustments
Open Access
© The Author(s) 2017. This article is distributed under the terms of the Creative Commons Attribution 4.0 International License (http://creativecommons.org/licenses/by/4.0/), which permits unrestricted use, distribution, and reproduction in any medium, provided you give appropriate credit to the original author(s) and the source, provide a link to the Creative Commons license, and indicate if changes were made.
METHODOLOGY
*Correspondence: [email protected] 1 IEA Data Processing and Research Center, Hamburg, Germany Full list of author information is available at the end of the article
results of a study are reported and the data is made publicly available, and are meant to ensure a high quality and validity of the survey results.
Among other measures, the IEA outlines minimum participation rates. This is due to the fact that usually no or very little information is available for nonresponding units or individuals, which is why nonresponse always holds the risk of bias. Therefore, the gen-eral goal of any survey researcher is to achieve a 100% response rate. However, IEA stud-ies acknowledge the difficultstud-ies in achieving this goal. Instead, they determine specific minimum participation rates to reduce the risk of bias due to nonresponse. As a standard rule, 85% of the sampled schools within a country as well as 85% of the sampled individu-als must participate in the survey in order to accept the data and results for a final release. Participation rates in IEA studies vary among educational systems (further referred to as “countries”), target populations and surveys. Notably, highly developed western econo-mies are facing increasing problems to comply with IEA´s response rate standards. As a general rule, data from participating countries that fail to meet these standards get anno-tated in the international reports or are even reported in separated report sections, high-lighting the possibly reduced validity of the results to the readers. Interested readers are referred to the TIMSS International Report Appendix C.8 (Mullis et al. 2012a) for details on participation rates and guidelines for annotations.
A common approach to mitigate the risk of nonresponse bias in survey estimates is through adjustment cell reweighting, where participating units (schools, students, teachers etc.) carry the weight of nonresponding units. This technique is based on the assumption of a non-informative response model, that is, nonresponse occurs com-pletely at random within each adjustment cell. This weighting adjustment method is used in all IEA studies, as no—or very limited—information is available about nonre-spondent units. Explicit strata constitute, in most cases, the adjustment cells for school and class level nonresponse, while schools or classes constitute usually the adjust-ment cells for individual level nonresponse (Martin and Mullis 2013; Schulz et al. 2011; Meinck 2015). Since, there is no way to prove that the units’ nonresponse is completely at random within an adjustment cell, the IEA standards are very strict on response rate thresholds as pointed out above. This paper will propose a novel approach on how to evaluate the risk of bias due to nonresponse at the school level.
IEA surveys usually implement a two-stage stratified cluster sampling design. Normally, schools are selected first, and then individuals (or classes) are randomly selected within the sampled schools (hence, nonresponse can occur at both sampling stages). In order to vali-date our approach, we first provide evidence in this paper that school level participation is at a higher risk, relative to within-school participation. This implies that the highest bur-den for survey administrators is to convince schools to participate in these assessments, while high rates of within-school participation are usually easy to achieve. Hence, under-standing nonresponse at the school level is of great importance, and adjusting for the bias introduced by any systematic nonresponse pattern recommended.
The current state of nonresponse bias analysis in LSA
thresholds set for participation, though, vary substantially among studies as there is no universal consensus of what is the minimum participation rate acceptable. Increasing nonresponse rates motivate study centers to develop further strategies to ensure high data quality besides setting minimum requirements. However, no general standards are extant that help countries facing low participation rates to analyze their data to verify the bias risk due to poor response rates. To our knowledge there are three international comparative surveys in education which have systematically conducted nonresponse bias analysis to evaluate the risk of bias due to poor participation. In what follows we briefly summarize the different approaches implemented by these studies.
All participating countries in the Programme for the International Assessment of Adult Competences (PIAAC) (OECD 2013) were required to carry out a “basic nonre-sponse bias analysis”. This consisted in comparing survey respondents and nonrespond-ents on individual characteristics which were assumed to be associated with the main outcome variable of the survey. All countries had to include in this analysis at least the following variables: age, gender, education, employment and region. When participat-ing countries were not able to achieve an overall participation rate of 70%, they were required to perform a more in-depth nonresponse bias analysis (Mohadjer et al. 2013). Examples of such an analysis are: comparing survey total estimates with census totals, comparison of responding rates by demographic characteristics, and correlation anal-ysis of weighting adjustment variables with proficiency measures (outcome variables). To name one exemplary outcome of such analysis, in Germany, Helmschrott and Mar-tin (2014) found that age, citizenship, the level of education, the type of house the sam-pled persons live in, and municipality size were the main factors influencing response to PIAAC.
The Teaching and Learning International Study (TALIS) (OECD 2014) is a compara-tive international large-scale survey on teacher competences. The international survey and sampling design of TALIS coincides, to a larger extent, with the design of most other IEA studies. The primary sampling units are schools and the responses are also at risk at both sampling stages (in the case of TALIS schools and the teachers within sampled schools). The TALIS International Consortium invited those countries facing participa-tion problems at any sampling stage to conduct a nonresponse bias analysis to evaluate the risk of bias.
The first step proposed was to compare the weighted estimates of characteristics from the school and teacher surveys with official statistics. This was done to show that (non) response propensity is independent of teacher or school characteristics. Establishing the impact of response propensities on teachers’ characteristics was analyzed as a sec-ond step. This analysis consisted of comparing teachers’ and/or schools’ characteristics between participating schools having different within-school participation rates. The aim was to show that survey results from schools with high participation rates can be compared with those from schools with low rates of participation. Analysis results of affected countries are not publicly available.
schools). At the student level, associations between response propensities, gender and
students’ information and computer literacy (ICILS´ main outcome variable) were
explored. At the teacher level, distributions of respondents and nonrespondents were compared with respect to age, subject domain and gender. These were the only available individual characteristics for respondents and nonrespondents that ICILS collected. The analysis showed that different response patterns between boys and girls were negligible, but significant for gender, age and main subject domains of teachers (Meinck and Cortes
2015).
The approaches presented above vary significantly in the way the common goal—eval-uating potential bias introduced by nonresponse—was addressed. The common feature between PIAAC and TALIS is that they use auxiliary variables for the nonresponse anal-ysis which might have not been present on the sampling frame, therefore allowing coun-try-specific variables on the analysis. ICILS, on the other hand, exploited the very little information available for respondents and nonrespondents for all countries in a stand-ardized way. The restraints of both applied approaches are obvious: (1) the availability and reliability of auxiliary statistical information varies substantially across countries, and (2) restrictions in the array of available information on nonresponding units limit the explanatory power of the analyses. From the authors’ point of view, the approach fol-lowed by ICILS is more consistent in a cross-country comparative framework, but very limited in terms of available information.
Another approach to evaluate bias was developed in non-educational social surveys. So-called nonresponse or basic questionnaires are handed out to individuals who refuse participation, or who could not be contacted in the main data collection (e.g., Bethlehem and Kersten 1985; Lynn 2003; Stoop 2004; Matsuo et al. 2010). These questionnaires contain a significantly reduced number of survey questions. The items in the question-naires are assumed to be highly associated to survey´s main outcome variables and with unit’s participation propensity. This allows researchers to evaluate the risk of bias arising from nonresponse, determine methods of nonresponse adjustments (e.g., weight adjust-ments related with the features of nonrespondents), or identify missing data imputation models. Recent research provided evidence that it is possible to achieve high participa-tion rates in nonresponse quesparticipa-tionnaires, which is the precondiparticipa-tion for a meaningful use of the collected data (Lynn 2003; Stoop 2004; Matsuo et al. 2010). To our knowledge, nonresponse questionnaires have yet to be used in any large cross-national comparative assessment in education.
Research focus, methods and data sources
There is extensive evidence on the literature that the main outcome variables in IEA assessments (usually achievement scores in specific subject domains) are highly asso-ciated with background characteristics of the participants (Caldas and Bankston 1997; Fuller 1987; Grace and Thompson 2003), suggesting that school context explains an important portion of the variability of student achievement scores (e.g., Koretz et al. 2001; Lamb and Fullarton 2001; Baker et al. 2002; Mullis et al. 2012a, b).
We will then focus on the methodological feasibility of the development of a school-level nonresponse questionnaire by identifying items that serve as good predictors of school average achievement. We will thereby address also operational constraints by trying to keep the number of items at a minimum. Note, since the practical implemen-tation of such questionnaires is pending, we cannot yet evaluate whether the items do also correlate with response propensities. The potential content of these questionnaires will be determined through analyzing the association of school-level variables with stu-dent-level results using data of TIMSS and PIRLS 2011. Regression analysis, using only school-level characteristics, will be applied to identify the best-fitting model in predict-ing averaged student achievement scores. We will compare cross-country standardized models with country-specific models.
We accounted for the complex sample design (i.e., stratification and unequal selection probabilities of schools) by applying sampling weights for the estimation of population parameters and jackknife repeated replication for the estimation of standard errors.
Between and within‑school nonresponse rates across IEA studies
Table 1 summarizes nonresponse rates of all IEA studies within the last decade. It can be seen that the amount of nonresponse varies between studies and cycles. Overall, about 17% of the countries failed to meet the minimum participation standards at the school level when the target population was school students. In ICCS 2009 and ICILS 2013 however, even every third country could not convince at least 85% of the sampled schools to participate in the study. In contrast, countries hardly ever struggle to reach the minimum participation rates for the sampled students within participating schools. Looking through the technical documentation of IEA studies, one will find that in the majority of all countries, the student participation rates are well above 90%. Hence, even if non-participants deviate systematically from participants, the risk of bias is very low. When adults comprise the target population, achieving high participation rates at both sampling stages becomes even more challenging, as shown in the lower part of Table 1. On average, 40% of the countries failed to meet the minimum participation require-ments for the sampled schools, and more than 30% failed to meet these requirerequire-ments within participating schools.
In conclusion, IEA studies face a non-negligible amount of nonresponse, which occurs especially at school level in student surveys and at both sampling stages when adults are the target population. Therefore, enhancing methods of analyzing and addressing non-response is of general importance in order to attain evidence that study results remain unaffected by nonresponse.
Results
Association of school‑level variables with student‑level results using selected IEA survey data
The analyses and procedural steps explicated in this section were carried out with the goal to develop a shortened school questionnaire. This questionnaire would have vari-ables that could comprise a regression model with a high explanatory power on the
Table 1 Percentages of countries failing the participation rate requirements in IEA studies (last 10 years)
* Minimum participation rates are 85% for schools; 85% for individuals within schools (computed across all participating schools)
** In TEDS‑M, “schools” were institutions that offer education programs for future primary or lower‑secondary mathematics teachers
Study, cycle and
target population Number of participating countries
Countries failing participation rate requirements* at School level
(before replacement)
School level (after replacement)
Within schools (individual level) % Count % Count % Count
Studies with school students comprising the target population
ICCS 2009—grade 8 students 42 33.3 14 14.3 6 0.0 0
ICILS 2013—grade 8 students 21 33.3 7 23.8 5 9.5 2
PIRLS 2006—grade 4 students 47 12.8 6 4.3 2 4.3 2
PIRLS 2011—grade 4 students 58 13.8 8 1.7 1 1.7 1
TIMSS 2007—grade 4 students 43 20.9 9 7.0 3 0.0 0
TIMSS 2007—grade 8 students 56 14.3 8 7.1 4 0.0 0
TIMSS 2011—grade 4 students 50 20.0 10 6.0 3 0.0 0
TIMSS 2011—grade 8 students 59 6.8 4 3.4 2 0.0 0
TIMSS advanced 2008
Advanced mathematics students 10 10.0 1 10.0 1 0.0 0
TIMSS advanced 2008
Physics students 9 22.2 2 0.0 0 11.1 1
Overall 395 17.5 69 6.8 27 1.5 6
Studies with adults comprising the target population
ICCS 2009—grade 8 teachers 37 37.8 14 29.7 11 21.6 8
ICILS 2013—grade 8 teachers 21 42.9 9 38.1 8 28.6 6
SITES 2006—math teachers 22 59.1 13 40.9 9 22.7 5
SITES 2006—science teachers 22 59.1 13 40.9 9 31.8 7
TEDS-M 2008—future primary
Math teachers** 16 6.3 1 6.3 1 37.5 6
Secondary math teachers**
TEDS-M 2008—future lower 16 31.3 5 31.3 5 56.3 9
TEDS-M 2008
University educators** 16 37.5 6 37.5 6 37.5 6
school’s average achievement score. Analysis was conducted first with data of TIMSS 2011, grade 4, and repeated with data of TIMSS 2011, grade 8 and PIRLS 2011.
As the first step, we calculated mathematics or reading score averages by school (across students and plausible values) and merged these with school level data. Then, we determined the relationship between each variable from the school questionnaire with the average student achievement by running a correlation analysis for each participating country, weighted by the school level weight (SCHWGT).
Standardized Questionnaire
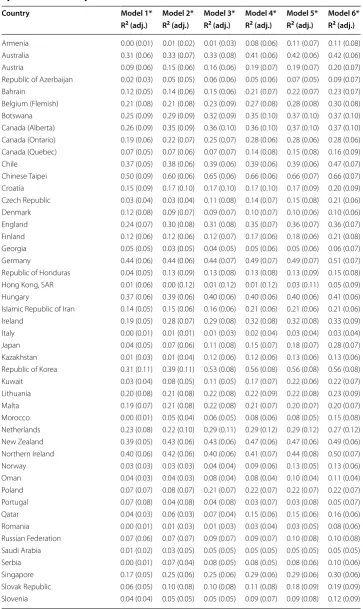
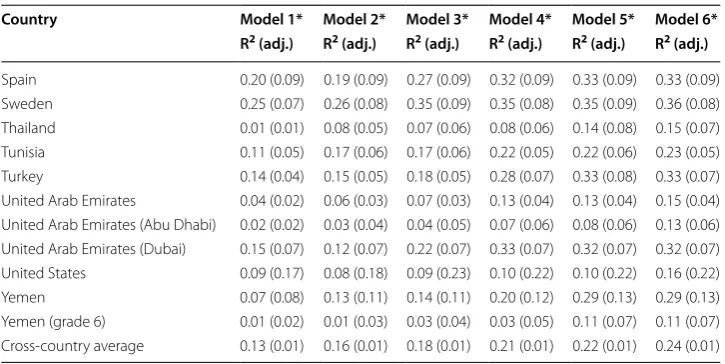
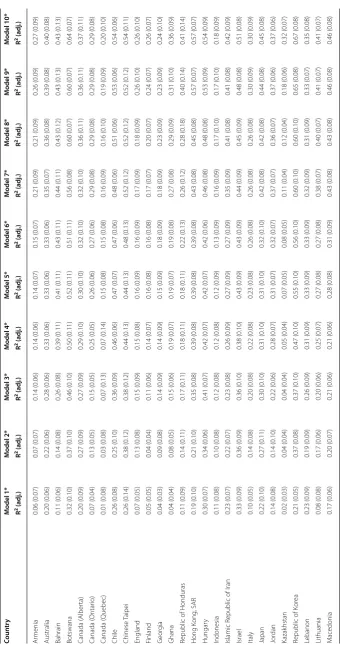
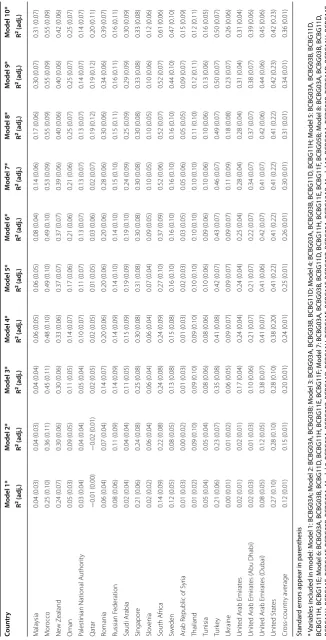
In an effort to develop a questionnaire that may work in a standardized format for any participating country, we considered now all variables with cross-country average cor-relation coefficients r ≥ ±0.2 for further analysis. Table 2 shows which variables fulfilled this condition in the considered studies. As can be seen, some variables fulfill the crite-rion in all studies; others only in one or two. In TIMSS grade 4, only six variables fulfilled the criterion while ten and eleven variables respectively were kept for TIMSS grade 8 and PIRLS. Then, we ran regression models separately for each country and study as
with y being the students’ achievement score averaged at school level, α being the inter-cept of the regression equation, β comprising the regression coefficients (assuming
lin-ear effects on the school mean scores), x the relevant school questionnaire variables, and subscript n denoting the number of variables included into the model. We estimated and reported the adjusted R2 of each model, which is the portion of the average achievement
scores’ variance explained by the model. For any given country and study, we started with a model with only one variable and added then step by step the next considered variable to the model in order to monitor the increase in R2. As expected, the explained
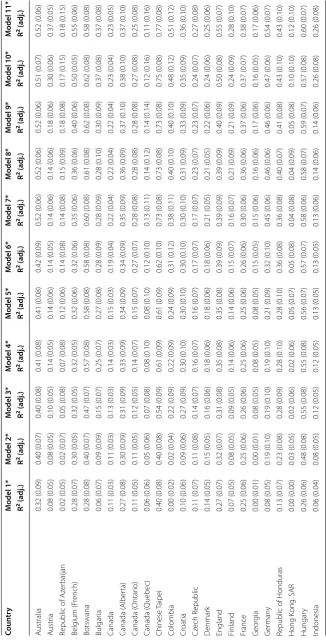
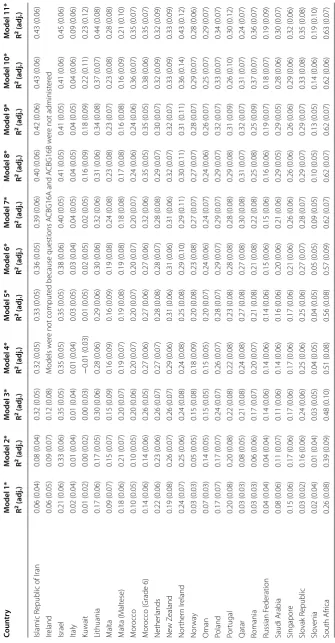
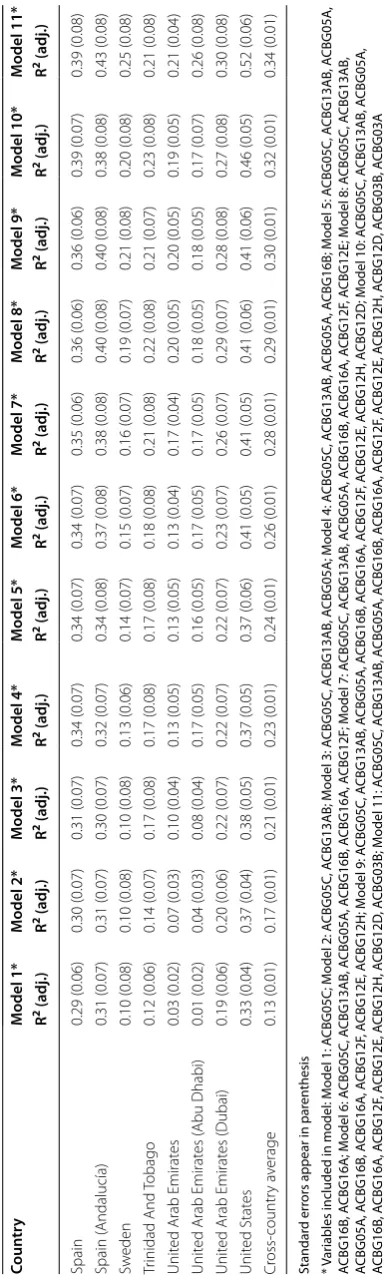
variance portion varied significantly between countries as shown in the Tables 3, 4, 5. The standard model explained as much as 77% of the achievement scores’ variance in Chinese Taipei (PIRLS), 67% in Korea (TIMSS grade 8) and 66% again in Chinese Taipei (TIMSS grade 4). To get an overview on the effectiveness of the models across coun-tries, we computed the cross-country average of R2 for each model and study (Table 6).
On average across countries, the explained variance was 34% for PIRLS (model with 11 variables), 24% for TIMSS grade 4 (model with 6 variables) and 36% for TIMSS grade 8 (model with 10 variables).
Country‑specific questionnaires
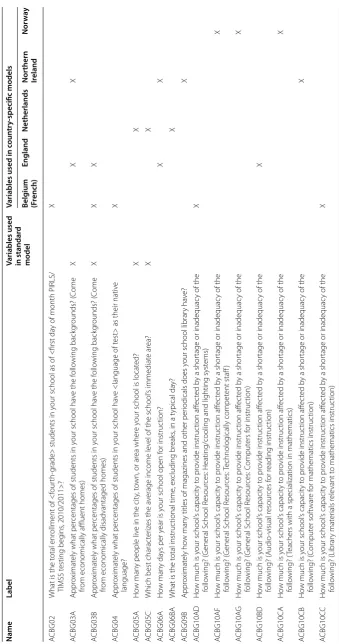
Often times, the standardized models were able to explain a relatively high level of vari-ation between the school’s student achievement averages in some countries but not always in others. Therefore, we instead considered applying tailor-cut models for spe-cific countries. We conducted respective analyses exemplarily for the five countries with the lowest participation rates in PIRLS 2011—Belgium (French), England, Neth-erlands, Northern Ireland and Norway. In order to determine the best fitting model for each country, we fitted regression models with stepwise in-/exclusion of the variables according to specific model parameters (probability of F for entry = 0.05 and of 0.1 for removal). We selected the model solution with 11 variables in order to be able to
compare the country-specific models with the standard model. As shown in Table 7 the standard model was as good as the tailor-cut model in Belgium (French) and England, while R2 of the country–specific model was higher in Northern Ireland, Netherlands and
Norway. The variables included in the country specific models are presented in Table 8.
Discussion and conclusions
We showed in this article that a significant portion of the variance of the school aver-aged student achievement scores could be explained based on relatively few variables from TIMSS and PIRLS school questionnaires. Therefore, the risk of bias due to nonre-sponse could be evaluated in effective and efficient ways when collecting this informa-tion from nonresponding schools. With the informainforma-tion at hand, one could compare the school characteristics of responding and nonresponding schools, bearing in mind that the compared characteristics are associated with the main outcome variables. Further,
Table 2 School questionnaire variables with cross‑country average correlation coeffi‑ cients r ≥ ±0.2 with the students’ achievement scores averaged at school level
* T4—TIMSS grade 4; T8—TIMSS grade 8; P4—PIRLS
Label Name Used in model*
Approximately what percentages of students in your school have the following backgrounds? (Come from economically disadvantaged homes)
BCBG03A T8—Model 1 to Model 10 ACBG03A P4—Model 11
T4—Model 1 to Model 6 Approximately what percentages of students in your school have the
following backgrounds? (Come from economically affluent homes) BCBG03BACBG03B T8—Model 2 to Model 10P4—Model 10 to Model 11 T4—Model 2 to Model 6 How many people live in the city, town, or area where your school is
located? BCBG05AACBG05A T8—Model 8 to Model 10P4—Model 3 to Model 11 Which best describes the immediate area in which your school is
located? BCBG05B T8—Model 7 to Model 10
Which best characterizes the average income level of the school’s
immediate area? BCBG05CACBG05C T8—Model 10P4—Model 1 to Model 11 T4—Model 3 to Model 6 How would you characterize each of the following within your school?
(Teachers’ expectations for student achievement) BCBG11DACBG12D T8—Model 3 to Model 10P4—Model 5 to Model 11 How would you characterize each of the following within your school?
(Parental support for student achievement) BCBG11EACBG12E T8—Model 5 to Model 10P4—Model 7 to Model 11 T4—Model 4 to Model 6 How would you characterize each of the following within your school?
(Parental involvement in school activities) BCBG11FACBG12F T8—Model 6 to Model 10P4—Model 9 to Model 11 T4—Model 5 to Model 6 How would you characterize each of the following within your school?
(Students’ desire to do well at school) BCBG11HACBG12H T8—Model 4 to Model 10P4—Model 8 to Model 11 T4—Model 6
To what degree is each of the following a problem among <fourth/
eight-grade> students in your school? (Unjustified absenteeism) BCBG12AB T8—Model 9 to Model 10ACBG13AB P4—Model 2 to Model 11 About how many of the students in your school can do the following
when they begin primary/elementary school? (Read some words) ACBG16B P4—Model 4 to Model 11 About how many of the students in your school can do the following
when they begin primary/elementary school? (Recognize most of the letters of the alphabet)
Table 3 TIMSS grade 4—explained variance of school‑averaged mathematics score by model and country
Country Model 1* Model 2* Model 3* Model 4* Model 5* Model 6* R2 (adj.) R2 (adj.) R2 (adj.) R2 (adj.) R2 (adj.) R2 (adj.)
Table 3 continued
Country Model 1* Model 2* Model 3* Model 4* Model 5* Model 6* R2 (adj.) R2 (adj.) R2 (adj.) R2 (adj.) R2 (adj.) R2 (adj.)
Spain 0.20 (0.09) 0.19 (0.09) 0.27 (0.09) 0.32 (0.09) 0.33 (0.09) 0.33 (0.09) Sweden 0.25 (0.07) 0.26 (0.08) 0.35 (0.09) 0.35 (0.08) 0.35 (0.09) 0.36 (0.08) Thailand 0.01 (0.01) 0.08 (0.05) 0.07 (0.06) 0.08 (0.06) 0.14 (0.08) 0.15 (0.07) Tunisia 0.11 (0.05) 0.17 (0.06) 0.17 (0.06) 0.22 (0.05) 0.22 (0.06) 0.23 (0.05) Turkey 0.14 (0.04) 0.15 (0.05) 0.18 (0.05) 0.28 (0.07) 0.33 (0.08) 0.33 (0.07) United Arab Emirates 0.04 (0.02) 0.06 (0.03) 0.07 (0.03) 0.13 (0.04) 0.13 (0.04) 0.15 (0.04) United Arab Emirates (Abu Dhabi) 0.02 (0.02) 0.03 (0.04) 0.04 (0.05) 0.07 (0.06) 0.08 (0.06) 0.13 (0.06) United Arab Emirates (Dubai) 0.15 (0.07) 0.12 (0.07) 0.22 (0.07) 0.33 (0.07) 0.32 (0.07) 0.32 (0.07) United States 0.09 (0.17) 0.08 (0.18) 0.09 (0.23) 0.10 (0.22) 0.10 (0.22) 0.16 (0.22) Yemen 0.07 (0.08) 0.13 (0.11) 0.14 (0.11) 0.20 (0.12) 0.29 (0.13) 0.29 (0.13) Yemen (grade 6) 0.01 (0.02) 0.01 (0.03) 0.03 (0.04) 0.03 (0.05) 0.11 (0.07) 0.11 (0.07) Cross-country average 0.13 (0.01) 0.16 (0.01) 0.18 (0.01) 0.21 (0.01) 0.22 (0.01) 0.24 (0.01)
Standard errors appear in parenthesis
* Variables included in model: Model 1: ACBG03A; Model 2: ACBG03A, ACBG03B; Model 3: ACBG03A, ACBG03B, ACBG05C; Model 4: ACBG03A, ACBG03B, ACBG05C, ACBG12E; Model 5: ACBG03A, ACBG03B, ACBG05C, ACBG12E, ACBG12F; Model 6: ACBG03A, ACBG03B, ACBG05C, ACBG12E, ACBG12F, ACBG12H
using the regression coefficients, one may estimate average achievement scores of the nonresponding schools and compare them (i.e., means, distributions) with those of the responding schools. In this case, country-specific models are preferable because they have fewer multicollinearity problems. The results of these analyses could be presented in the studies’ technical documentations and may inform sample adjudication.
A more conclusive and consequent step would be to replace the non-informative response model for nonresponse adjustments by a model that uses the information col-lected from nonresponding schools. One possibility would be to estimate the response propensities of respondents by logistic regression models and compute the weight adjustment factors based on these models (e.g., Lepidus Carlson and Williams 2001; Watson 2012). However, this approach can result in rather unstable adjustment coef-ficients (Joncas 2015, personal communication). A more robust method would be to use the results of the logistic regression analysis to define more effective adjustment cells than those used by default, since propensity rank strata can render the nonresponse adjustment more ‘stable’. To date, the only information used for school-level nonresponse adjustment in IEA studies is schools’ allocation to explicit strata. In TIMSS, PIRLS and ICCS, the variance of the achievement scores explained by the explicit stratification is however only about 5% on average (source: own computations); this is why the models presented in this paper explain five to seven times higher portions of this variance.
Table 4 TIMSS gr ade 8— explained v arianc e of scho ol ‑a ver aged ma thema tics sc or e b y mo del and c oun tr y Coun tr y M odel 1* M odel 2* M odel 3* M odel 4* M odel 5* M odel 6* M odel 7* M odel 8* M odel 9* M odel 10* R
2 (adj
.)
R
2 (adj
.)
R
2 (adj
.)
R
2 (adj
.)
R
2 (adj
.)
R
2 (adj
.)
R
2 (adj
.)
R
2 (adj
.)
R
2 (adj
.)
R
2 (adj
.) Ar menia 0.06 (0.07) 0.07 (0.07) 0.14 (0.06) 0.14 (0.06) 0.14 (0.07) 0.15 (0.07) 0.21 (0.09) 0.21 (0.09) 0.26 (0.09) 0.27 (0.09) A ustralia 0.20 (0.06) 0.22 (0.06) 0.28 (0.06) 0.33 (0.06) 0.33 (0.06) 0.33 (0.06) 0.35 (0.07) 0.36 (0.08) 0.39 (0.08) 0.40 (0.08) Bahrain 0.11 (0.06) 0.14 (0.08) 0.26 (0.08) 0.39 (0.11) 0.41 (0.11) 0.43 (0.11) 0.44 (0.11) 0.43 (0.12) 0.43 (0.13) 0.43 (0.13) Botswana 0.32 (0.10) 0.37 (0.10) 0.46 (0.10) 0.50 (0.11) 0.52 (0.11) 0.51 (0.11) 0.56 (0.08) 0.60 (0.07) 0.60 (0.07) 0.64 (0.07) Canada ( Alber ta) 0.20 (0.09) 0.27 (0.09) 0.27 (0.09) 0.29 (0.10) 0.30 (0.10) 0.32 (0.10) 0.32 (0.10) 0.36 (0.11) 0.36 (0.11) 0.37 (0.11) Canada ( Ontar io) 0.07 (0.04) 0.13 (0.05) 0.15 (0.05) 0.25 (0.05) 0.26 (0.06) 0.27 (0.06) 0.29 (0.08) 0.29 (0.08) 0.29 (0.08) 0.29 (0.08) Canada ( Quebec) 0.01 (0.08) 0.03 (0.08) 0.07 (0.13) 0.07 (0.14) 0.15 (0.08) 0.15 (0.08) 0.16 (0.09) 0.16 (0.10) 0.19 (0.09) 0.20 (0.10) Chile 0.26 (0.08) 0.25 (0.10) 0.36 (0.09) 0.46 (0.06) 0.47 (0.07) 0.47 (0.06) 0.48 (0.06) 0.51 (0.06) 0.53 (0.06) 0.54 (0.06) Chinese T aipei 0.26 (0.14) 0.38 (0.12) 0.38 (0.12) 0.44 (0.13) 0.44 (0.13) 0.48 (0.13) 0.52 (0.12) 0.52 (0.12) 0.52 (0.12) 0.54 (0.11) England 0.07 (0.05) 0.13 (0.08) 0.15 (0.09) 0.15 (0.08) 0.16 (0.09) 0.16 (0.09) 0.17 (0.09) 0.18 (0.09) 0.26 (0.10) 0.26 (0.10) Finland 0.05 (0.05) 0.04 (0.04) 0.11 (0.06) 0.14 (0.07) 0.16 (0.08) 0.16 (0.08) 0.17 (0.07) 0.20 (0.07) 0.24 (0.07) 0.26 (0.07) G eor gia 0.04 (0.03) 0.09 (0.08) 0.14 (0.09) 0.14 (0.09) 0.15 (0.09) 0.18 (0.09) 0.18 (0.09) 0.23 (0.09) 0.23 (0.09) 0.24 (0.10) Ghana 0.04 (0.04) 0.08 (0.05) 0.15 (0.06) 0.19 (0.07) 0.19 (0.07) 0.19 (0.08) 0.27 (0.08) 0.29 (0.09) 0.31 (0.10) 0.36 (0.09)
Republic of Honduras
0.11 (0.09) 0.14 (0.11) 0.17 (0.11) 0.18 (0.11) 0.18 (0.11) 0.22 (0.13) 0.26 (0.12) 0.28 (0.18) 0.40 (0.14) 0.41 (0.14) Hong K ong , SAR 0.19 (0.10) 0.21 (0.10) 0.35 (0.08) 0.39 (0.08) 0.39 (0.08) 0.39 (0.08) 0.43 (0.08) 0.45 (0.08) 0.57 (0.07) 0.57 (0.07) Hungar y 0.30 (0.07) 0.34 (0.06) 0.41 (0.07) 0.42 (0.07) 0.42 (0.07) 0.42 (0.06) 0.46 (0.08) 0.48 (0.08) 0.53 (0.09) 0.54 (0.09) Indonesia 0.11 (0.08) 0.10 (0.08) 0.12 (0.08) 0.12 (0.08) 0.12 (0.09) 0.13 (0.09) 0.16 (0.09) 0.17 (0.10) 0.17 (0.10) 0.18 (0.09) Islamic R
epublic of I
ran 0.23 (0.07) 0.22 (0.07) 0.23 (0.08) 0.26 (0.09) 0.27 (0.09) 0.27 (0.09) 0.35 (0.09) 0.41 (0.08) 0.41 (0.08) 0.42 (0.09) Israel 0.33 (0.09) 0.36 (0.09) 0.36 (0.10) 0.38 (0.10) 0.43 (0.09) 0.43 (0.09) 0.44 (0.09) 0.45 (0.09) 0.48 (0.08) 0.51 (0.08) Italy 0.10 (0.05) 0.14 (0.08) 0.20 (0.08) 0.22 (0.08) 0.23 (0.08) 0.26 (0.08) 0.26 (0.08) 0.26 (0.08) 0.30 (0.09) 0.30 (0.09) Japan 0.22 (0.10) 0.27 (0.11) 0.30 (0.10) 0.31 (0.10) 0.31 (0.10) 0.32 (0.10) 0.42 (0.08) 0.42 (0.08) 0.44 (0.08) 0.45 (0.08) Jor dan 0.14 (0.08) 0.14 (0.10) 0.22 (0.06) 0.28 (0.07) 0.31 (0.07) 0.32 (0.07) 0.37 (0.07) 0.36 (0.07) 0.37 (0.06) 0.37 (0.06) Kazak hstan 0.02 (0.03) 0.04 (0.04) 0.04 (0.04) 0.05 (0.04) 0.07 (0.05) 0.08 (0.05) 0.11 (0.04) 0.12 (0.04) 0.18 (0.06) 0.32 (0.07)
Republic of K
Table 4 c on tinued Coun tr y M odel 1* M odel 2* M odel 3* M odel 4* M odel 5* M odel 6* M odel 7* M odel 8* M odel 9* M odel 10* R
2 (adj
.)
R
2 (adj
.)
R
2 (adj
.)
R
2 (adj
.)
R
2 (adj
.)
R
2 (adj
.)
R
2 (adj
.)
R
2 (adj
.)
R
2 (adj
.)
R
2 (adj
.) M ala ysia 0.04 (0.03) 0.04 (0.03) 0.04 (0.04) 0.06 (0.05) 0.06 (0.05) 0.08 (0.04) 0.14 (0.06) 0.17 (0.06) 0.30 (0.07) 0.31 (0.07) M or occo 0.25 (0.10) 0.36 (0.11) 0.45 (0.11) 0.48 (0.10) 0.49 (0.10) 0.49 (0.10) 0.53 (0.09) 0.55 (0.09) 0.55 (0.09) 0.55 (0.09) Ne w Z ealand 0.24 (0.07) 0.30 (0.06) 0.30 (0.06) 0.33 (0.06) 0.37 (0.07) 0.37 (0.07) 0.39 (0.06) 0.40 (0.06) 0.40 (0.06) 0.42 (0.06) Oman 0.05 (0.03) 0.09 (0.05) 0.11 (0.05) 0.14 (0.07) 0.17 (0.06) 0.21 (0.06) 0.21 (0.06) 0.25 (0.07) 0.25 (0.07) 0.25 (0.07)
Palestinian National A
uthor ity 0.03 (0.04) 0.04 (0.04) 0.05 (0.04) 0.10 (0.07) 0.11 (0.07) 0.13 (0.07) 0.13 (0.07) 0.13 (0.07) 0.14 (0.07) 0.14 (0.07) Qatar − 0.01 (0.00) − 0.02 (0.01) 0.02 (0.05) 0.02 (0.05) 0.01 (0.05) 0.03 (0.06) 0.02 (0.07) 0.19 (0.12) 0.19 (0.12) 0.20 (0.11) Romania 0.06 (0.04) 0.07 (0.04) 0.14 (0.07) 0.20 (0.06) 0.20 (0.06) 0.20 (0.06) 0.28 (0.06) 0.30 (0.06) 0.34 (0.06) 0.39 (0.07) Russian F ederation 0.08 (0.06) 0.11 (0.09) 0.14 (0.09) 0.14 (0.09) 0.14 (0.10) 0.14 (0.10) 0.15 (0.10) 0.15 (0.11) 0.16 (0.11) 0.16 (0.11) Saudi Arabia 0.02 (0.04) 0.04 (0.04) 0.11 (0.05) 0.15 (0.09) 0.19 (0.09) 0.19 (0.10) 0.24 (0.09) 0.25 (0.09) 0.29 (0.09) 0.30 (0.09) Singapor e 0.21 (0.06) 0.24 (0.08) 0.25 (0.08) 0.30 (0.08) 0.31 (0.08) 0.30 (0.08) 0.30 (0.08) 0.30 (0.08) 0.33 (0.08) 0.33 (0.08) Slo venia 0.02 (0.02) 0.06 (0.04) 0.06 (0.04) 0.06 (0.04) 0.07 (0.04) 0.09 (0.05) 0.10 (0.05) 0.10 (0.05) 0.10 (0.06) 0.12 (0.06) South A frica 0.14 (0.09) 0.22 (0.08) 0.24 (0.08) 0.24 (0.09) 0.27 (0.10) 0.37 (0.09) 0.52 (0.06) 0.52 (0.07) 0.52 (0.07) 0.61 (0.06) Sw eden 0.12 (0.05) 0.08 (0.05) 0.13 (0.08) 0.15 (0.08) 0.16 (0.10) 0.16 (0.10) 0.16 (0.10) 0.16 (0.10) 0.44 (0.10) 0.47 (0.10) Arab R
epublic of Syr
ia 0.01 (0.03) 0.00 (0.02) 0.01 (0.03) 0.01 (0.03) 0.02 (0.03) 0.03 (0.05) 0.05 (0.06) 0.05 (0.05) 0.09 (0.07) 0.15 (0.09) Thailand 0.01 (0.02) 0.09 (0.10) 0.09 (0.10) 0.09 (0.10) 0.10 (0.10) 0.10 (0.10) 0.10 (0.10) 0.11 (0.10) 0.12 (0.11) 0.12 (0.11) Tunisia 0.05 (0.04) 0.05 (0.04) 0.08 (0.06) 0.08 (0.06) 0.10 (0.06) 0.09 (0.06) 0.10 (0.06) 0.10 (0.06) 0.13 (0.06) 0.16 (0.05) Tu rk ey 0.21 (0.06) 0.23 (0.07) 0.35 (0.08) 0.41 (0.08) 0.42 (0.07) 0.43 (0.07) 0.46 (0.07) 0.49 (0.07) 0.50 (0.07) 0.50 (0.07) Uk raine 0.00 (0.01) 0.01 (0.02) 0.06 (0.05) 0.09 (0.07) 0.09 (0.07) 0.09 (0.07) 0.11 (0.09) 0.18 (0.08) 0.23 (0.07) 0.26 (0.06) Unit
ed Arab Emirat
es 0.02 (0.01) 0.02 (0.01) 0.17 (0.04) 0.24 (0.04) 0.24 (0.04) 0.25 (0.04) 0.28 (0.04) 0.28 (0.04) 0.31 (0.04) 0.31 (0.04) Unit
ed Arab Emirat
es ( Abu Dhabi) 0.02 (0.03) 0.01 (0.03) 0.10 (0.06) 0.21 (0.07) 0.21 (0.07) 0.22 (0.07) 0.34 (0.07) 0.37 (0.07) 0.38 (0.07) 0.39 (0.06) Unit
ed Arab Emirat
es (Dubai) 0.08 (0.05) 0.12 (0.05) 0.38 (0.07) 0.41 (0.07) 0.41 (0.06) 0.42 (0.07) 0.41 (0.07) 0.42 (0.06) 0.44 (0.06) 0.45 (0.06) Unit ed Stat es 0.27 (0.10) 0.28 (0.10) 0.28 (0.10) 0.38 (0.20) 0.41 (0.22) 0.41 (0.22) 0.41 (0.22) 0.41 (0.22) 0.42 (0.23) 0.42 (0.23) Cr oss-countr y a verage 0.12 (0.01) 0.15 (0.01) 0.20 (0.01) 0.24 (0.01) 0.25 (0.01) 0.26 (0.01) 0.30 (0.01) 0.31 (0.01) 0.34 (0.01) 0.36 (0.01) Standar d er
rors appear in par
en
thesis
* V
ar
iables included in model: M
odel 1: BCBG03A; M
odel 2: BCBG03A, BCBG03B; M
odel 3: BCBG03A, BCBG03B
, BCBG11D; M
odel 4: BCBG03A, BCBG03B
, BCBG11D
, BCBG11H; M
odel 5: BCBG03A, BCBG03B
, BCBG11D
,
BCBG11H, BCBG11E; M
odel 6: BCBG03A, BCBG03B
, BCBG11D
, BCBG11H, BCBG11E
, BCBG11F
; M
odel 7: BCBG03A, BCBG03B
, BCBG11D
, BCBG11H, BCBG11E
, BCBG11F
, BCBG05B; M
odel 8: BCBG03A, BCBG03B
, BCBG11D
,
BCBG11H, BCBG11E
, BCBG11F
, BCBG05B
, BCBG05A; M
odel 9: BCBG03A, BCBG03B
, BCBG11D
, BCBG11H, BCBG11E
, BCBG11F
, BCBG05B
, BCBG05A, BCBG12AB; M
odel 10: BCBG03A, BCBG03B
, BCBG11D
, BCBG11H, BCBG11E
,
BCBG11F
, BCBG05B
, BCBG05A, BCBG12AB
Table 5 PIRLS gr ade 4— explained v arianc e of scho ol ‑a ver aged r eading sc or e b y mo del and c oun tr y Coun tr y M odel 1* M odel 2* M odel 3* M odel 4* M odel 5* M odel 6* M odel 7* M odel 8* M odel 9* M odel 10* M odel 11* R
2 (adj
.)
R
2 (adj
.)
R
2 (adj
.)
R
2 (adj
.)
R
2 (adj
.)
R
2 (adj
.)
R
2 (adj
.)
R
2 (adj
.)
R
2 (adj
.)
R
2 (adj
.)
R
2 (adj
.) A ustralia 0.32 (0.09) 0.40 (0.07) 0.40 (0.08) 0.41 (0.08) 0.41 (0.08) 0.42 (0.09) 0.52 (0.06) 0.52 (0.06) 0.52 (0.06) 0.51 (0.07) 0.52 (0.06) A ustr ia 0.08 (0.05) 0.08 (0.05) 0.10 (0.05) 0.14 (0.05) 0.14 (0.06) 0.14 (0.05) 0.14 (0.06) 0.14 (0.06) 0.18 (0.06) 0.30 (0.06) 0.37 (0.05)
Republic of A
zer baijan 0.02 (0.05) 0.02 (0.07) 0.05 (0.08) 0.07 (0.08) 0.12 (0.06) 0.14 (0.08) 0.14 (0.08) 0.15 (0.09) 0.18 (0.08) 0.17 (0.15) 0.18 (0.15) Belg ium (F rench) 0.28 (0.07) 0.30 (0.05) 0.32 (0.05) 0.32 (0.05) 0.32 (0.06) 0.32 (0.06) 0.35 (0.06) 0.36 (0.06) 0.40 (0.06) 0.50 (0.05) 0.55 (0.06) Botswana 0.28 (0.08) 0.40 (0.07) 0.47 (0.07) 0.57 (0.08) 0.58 (0.08) 0.58 (0.08) 0.60 (0.08) 0.61 (0.08) 0.62 (0.08) 0.62 (0.08) 0.58 (0.08) Bulgar ia 0.06 (0.07) 0.09 (0.09) 0.15 (0.07) 0.25 (0.07) 0.27 (0.08) 0.28 (0.09) 0.28 (0.09) 0.28 (0.10) 0.30 (0.09) 0.37 (0.08) 0.37 (0.08) Canada 0.11 (0.03) 0.11 (0.03) 0.13 (0.03) 0.14 (0.03) 0.15 (0.03) 0.19 (0.04) 0.22 (0.04) 0.22 (0.04) 0.22 (0.04) 0.23 (0.04) 0.23 (0.05) Canada ( Alber ta) 0.27 (0.08) 0.30 (0.09) 0.31 (0.09) 0.33 (0.09) 0.34 (0.09) 0.34 (0.09) 0.35 (0.09) 0.36 (0.09) 0.37 (0.10) 0.38 (0.10) 0.37 (0.10) Canada ( Ontar io) 0.11 (0.05) 0.11 (0.05) 0.12 (0.05) 0.14 (0.07) 0.15 (0.07) 0.27 (0.07) 0.28 (0.08) 0.28 (0.08) 0.28 (0.08) 0.27 (0.08) 0.25 (0.08) Canada ( Quebec) 0.06 (0.06) 0.05 (0.06) 0.07 (0.08) 0.08 (0.10) 0.08 (0.10) 0.12 (0.10) 0.13 (0.11) 0.14 (0.12) 0.14 (0.14) 0.12 (0.16) 0.11 (0.16) Chinese T aipei 0.40 (0.08) 0.40 (0.08) 0.54 (0.09) 0.61 (0.09) 0.61 (0.09) 0.62 (0.10) 0.73 (0.08) 0.73 (0.08) 0.73 (0.08) 0.75 (0.08) 0.77 (0.08) Colombia 0.00 (0.02) 0.02 (0.04) 0.22 (0.09) 0.22 (0.09) 0.24 (0.09) 0.31 (0.12) 0.38 (0.11) 0.40 (0.10) 0.40 (0.10) 0.48 (0.12) 0.51 (0.12) Cr oatia 0.10 (0.06) 0.09 (0.06) 0.27 (0.09) 0.30 (0.10) 0.30 (0.10) 0.30 (0.10) 0.30 (0.10) 0.31 (0.09) 0.33 (0.09) 0.35 (0.09) 0.36 (0.10) Cz ech R epublic 0.11 (0.07) 0.11 (0.08) 0.14 (0.07) 0.16 (0.07) 0.16 (0.07) 0.17 (0.07) 0.17 (0.07) 0.23 (0.07) 0.23 (0.07) 0.24 (0.07) 0.27 (0.08) D enmar k 0.14 (0.05) 0.15 (0.05) 0.16 (0.06) 0.18 (0.06) 0.18 (0.06) 0.18 (0.06) 0.21 (0.05) 0.21 (0.05) 0.22 (0.06) 0.24 (0.06) 0.25 (0.06) England 0.27 (0.07) 0.32 (0.07) 0.31 (0.08) 0.35 (0.08) 0.35 (0.08) 0.39 (0.09) 0.39 (0.09) 0.39 (0.09) 0.40 (0.09) 0.50 (0.08) 0.55 (0.07) Finland 0.07 (0.05) 0.08 (0.05) 0.09 (0.05) 0.14 (0.06) 0.14 (0.06) 0.15 (0.07) 0.16 (0.07) 0.21 (0.09) 0.21 (0.09) 0.24 (0.09) 0.28 (0.10) France 0.25 (0.06) 0.25 (0.06) 0.26 (0.06) 0.25 (0.06) 0.25 (0.06) 0.26 (0.06) 0.30 (0.06) 0.36 (0.06) 0.37 (0.06) 0.37 (0.07) 0.38 (0.07) G eor gia 0.00 (0.01) 0.00 (0.01) 0.08 (0.05) 0.08 (0.05) 0.08 (0.05) 0.15 (0.05) 0.15 (0.06) 0.16 (0.06) 0.17 (0.06) 0.16 (0.05) 0.17 (0.06) G er man y 0.08 (0.05) 0.19 (0.10) 0.19 (0.10) 0.19 (0.10) 0.21 (0.09) 0.32 (0.10) 0.45 (0.06) 0.46 (0.06) 0.46 (0.06) 0.47 (0.06) 0.54 (0.07)
Republic of Honduras
Table 5 c on tinued Coun tr y M odel 1* M odel 2* M odel 3* M odel 4* M odel 5* M odel 6* M odel 7* M odel 8* M odel 9* M odel 10* M odel 11* R
2 (adj
.)
R
2 (adj
.)
R
2 (adj
.)
R
2 (adj
.)
R
2 (adj
.)
R
2 (adj
.)
R
2 (adj
.)
R
2 (adj
.)
R
2 (adj
.)
R
2 (adj
.)
R
2 (adj
.)
Islamic R
epublic of I
ran 0.06 (0.04) 0.08 (0.04) 0.32 (0.05) 0.32 (0.05) 0.33 (0.05) 0.36 (0.05) 0.39 (0.06) 0.40 (0.06) 0.42 (0.06) 0.43 (0.06) 0.43 (0.06) Ireland 0.06 (0.05) 0.09 (0.07) 0.12 (0.08) M odels w er
e not comput
ed because questions A
CBG16A and A
CBG16B w
er
e not administ
Standar
d er
rors appear in par
en
thesis
* V
ar
iables included in model: M
odel 1: A
CBG05C; M
odel 2: A
CBG05C, A
CBG13AB; M
odel 3: A
CBG05C, A
CBG13AB
, A
CBG05A; M
odel 4: A
CBG05C, A
CBG13AB
, A
CBG05A, A
CBG16B; M
odel 5: A
CBG05C, A CBG13AB , A CBG05A, ACBG16B , A CBG16A; M
odel 6: A
CBG05C, A CBG13AB , A CBG05A, A CBG16B , A CBG16A, A CBG12F ; M
odel 7: A
CBG05C, A CBG13AB , A CBG05A, A CBG16B , A CBG16A, A CBG12F , A CBG12E; M
odel 8: A
CBG05C, A CBG13AB , ACBG05A, A CBG16B , A CBG16A, A CBG12F , A CBG12E , A CBG12H; M
odel 9: A
CBG05C, A CBG13AB , A CBG05A, A CBG16B , A CBG16A, A CBG12F , A CBG12E , A CBG12H, A CBG12D; M
odel 10: A
CBG05C, A CBG13AB , A CBG05A, ACBG16B , A CBG16A, A CBG12F , A CBG12E , A CBG12H, A CBG12D , A CBG03B; M
odel 11: A
CBG05C, A CBG13AB , A CBG05A, A CBG16B , A CBG16A, A CBG12F , A CBG12E , A CBG12H, A CBG12D , A CBG03B , A CBG03A Coun tr y M odel 1* M odel 2* M odel 3* M odel 4* M odel 5* M odel 6* M odel 7* M odel 8* M odel 9* M odel 10* M odel 11* R
2 (adj
.)
R
2 (adj
.)
R
2 (adj
.)
R
2 (adj
.)
R
2 (adj
.)
R
2 (adj
.)
R
2 (adj
.)
R
2 (adj
.)
R
2 (adj
.)
R
2 (adj
.)
R
2 (adj
.) Spain 0.29 (0.06) 0.30 (0.07) 0.31 (0.07) 0.34 (0.07) 0.34 (0.07) 0.34 (0.07) 0.35 (0.06) 0.36 (0.06) 0.36 (0.06) 0.39 (0.07) 0.39 (0.08) Spain ( Andalucía) 0.31 (0.07) 0.31 (0.07) 0.30 (0.07) 0.32 (0.07) 0.34 (0.08) 0.37 (0.08) 0.38 (0.08) 0.40 (0.08) 0.40 (0.08) 0.38 (0.08) 0.43 (0.08) Sw eden 0.10 (0.08) 0.10 (0.08) 0.10 (0.08) 0.13 (0.06) 0.14 (0.07) 0.15 (0.07) 0.16 (0.07) 0.19 (0.07) 0.21 (0.08) 0.20 (0.08) 0.25 (0.08) Tr inidad And T obago 0.12 (0.06) 0.14 (0.07) 0.17 (0.08) 0.17 (0.08) 0.17 (0.08) 0.18 (0.08) 0.21 (0.08) 0.22 (0.08) 0.21 (0.07) 0.23 (0.08) 0.21 (0.08) Unit
ed Arab Emirat
es 0.03 (0.02) 0.07 (0.03) 0.10 (0.04) 0.13 (0.05) 0.13 (0.05) 0.13 (0.04) 0.17 (0.04) 0.20 (0.05) 0.20 (0.05) 0.19 (0.05) 0.21 (0.04) Unit
ed Arab Emirat
es ( Abu Dhabi) 0.01 (0.02) 0.04 (0.03) 0.08 (0.04) 0.17 (0.05) 0.16 (0.05) 0.17 (0.05) 0.17 (0.05) 0.18 (0.05) 0.18 (0.05) 0.17 (0.07) 0.26 (0.08) Unit
ed Arab Emirat
administer these questionnaires, ensuring that the participation in the actual survey is not jeopardized. Methodological and financial considerations will determine whether a standard approach (one standardized questionnaire for all affected countries) or a tai-lored approach (country-specific questionnaires) is more efficient. Further investiga-tions are needed to show whether the presented approach of developing nonresponse questionnaires is also applicable to other large-scale assessments and if nonresponse questionnaires for individuals could be developed in similar ways. Moreover, a study on the feasibility of the practical application is pending. Careful consideration is needed to optimally integrate the administration of such questionnaires in the tight schedule of large-scale assessments. High participation rates would be needed to ensure the usability of this instrument. In this sense, short questionnaires might be favorable, while another option would be to administer full school questionnaires. The latter would simplify data processing and operations, but also be beneficial regarding the quality of the nonre-sponse bias analysis.
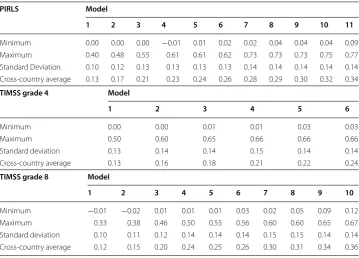
Table 6 Descriptive statistics of R2 (explained variance of achievement score) across coun‑
tries by model and study
PIRLS Model
1 2 3 4 5 6 7 8 9 10 11
Minimum 0.00 0.00 0.00 −0.01 0.01 0.02 0.02 0.04 0.04 0.04 0.09 Maximum 0.40 0.48 0.55 0.61 0.61 0.62 0.73 0.73 0.73 0.75 0.77 Standard Deviation 0.10 0.12 0.13 0.13 0.13 0.13 0.14 0.14 0.14 0.14 0.14 Cross-country average 0.13 0.17 0.21 0.23 0.24 0.26 0.28 0.29 0.30 0.32 0.34 TIMSS grade 4 Model
1 2 3 4 5 6
Minimum 0.00 0.00 0.01 0.01 0.03 0.03
Maximum 0.50 0.60 0.65 0.66 0.66 0.66
Standard deviation 0.13 0.14 0.14 0.15 0.14 0.14
Cross-country average 0.13 0.16 0.18 0.21 0.22 0.24
TIMSS grade 8 Model
1 2 3 4 5 6 7 8 9 10
Minimum −0.01 −0.02 0.01 0.01 0.01 0.03 0.02 0.05 0.09 0.12
Maximum 0.33 0.38 0.46 0.50 0.55 0.56 0.60 0.60 0.65 0.67
Standard deviation 0.10 0.11 0.12 0.14 0.14 0.14 0.15 0.15 0.14 0.14 Cross-country average 0.12 0.15 0.20 0.24 0.25 0.26 0.30 0.31 0.34 0.36
Table 7 R2 (explained variance of achievement score) by country (PIRLS)
Standard errors appear in parenthesis
Country Participation rate of schools (before
replacement) (%) Standard model Country‑specific modelR2 (adj.) R2 (adj.)
Belgium (French) 77 0.55 (0.06) 0.51 (0.08)
England 75 0.55 (0.07) 0.55 (0.07)
Netherlands 68 0.32 (0.09) 0.47 (0.07)
Northern Ireland 62 0.43 (0.09) 0.57 (0.17)
Table
8
PIRLS
—v
ariables included in the standar
d and the c
oun
tr
y‑
sp
ecific mo
dels (5 c
oun
tries)
Name
Label
Variables used in standar
d
model
Variables used in c
oun tr y‑ specific models Belg ium (F rench) England Netherlands Nor thern Ir eland Nor w ay A CBG02
What is the t
otal enr
ollment of <f
our
th-grade> students in y
our school as of <first da
y of month PIRLS/
TIMSS t esting beg ins , 2010/2011>? X A CBG03A Appr oximat
ely what per
centages of students in y
our school ha
ve the f
ollo
wing back
gr
ounds? (
Come
from economically affluent homes)
X X X A CBG03B Appr oximat
ely what per
centages of students in y
our school ha
ve the f
ollo
wing back
gr
ounds? (
Come
from economically disadvantaged homes)
X X X A CBG04 Appr oximat
ely what per
centages of students in y
our school ha
ve <language of t
est> as their nativ
e language? X A CBG05A Ho w man
y people liv
e in the cit
y, t
own, or ar
ea wher
e y
our school is locat
ed?
X
X
A
CBG05C
Which best charac
ter
iz
es the a
verage income le
vel of the school
’s immediat e ar ea? X X A CBG06A Ho w man y da
ys per y
ear is y
our school open f
or instruc tion? X X A CBG06BA
What is the t
otal instruc
tional time
, ex
cluding br
eaks
, in a t
ypical da y? X A CBG09B Appr oximat ely ho w man
y titles of magazines and other per
iodicals does y
our school librar
y ha ve? X A CBG10AD Ho
w much is y
our school ’s capacit y t o pr ovide instruc tion aff ec ted b
y a shor
tage or inadequac
y of the
follo wing? ( G eneral S chool R esour
ces: Heating/cooling and lighting syst
ems)
X
A
CBG10AF
Ho
w much is y
our school ’s capacit y t o pr ovide instruc tion aff ec ted b
y a shor
tage or inadequac
y of the
follo wing? ( G eneral S chool R esour ces: Technolog ically compet ent staff ) X A CBG10A G Ho
w much is y
our school ’s capacit y t o pr ovide instruc tion aff ec ted b
y a shor
tage or inadequac
y of the
follo wing? ( G eneral S chool R esour ces: C omput ers f or instruc tion) X A CBG10BD Ho
w much is y
our school ’s capacit y t o pr ovide instruc tion aff ec ted b
y a shor
tage or inadequac
y of the
follo wing? ( A udio -visual r esour ces f or r eading instruc tion) X A CBG10CA Ho
w much is y
our school ’s capacit y t o pr ovide instruc tion aff ec ted b
y a shor
tage or inadequac
y of the
follo
wing? (
Teachers with a specialization in mathematics)
X
A
CBG10CB
Ho
w much is y
our school ’s capacit y t o pr ovide instruc tion aff ec ted b
y a shor
tage or inadequac
y of the
follo wing? ( Comput er sof twar e f
or mathematics instruc
tion) X A CBG10C C Ho
w much is y
our school ’s capacit y t o pr ovide instruc tion aff ec ted b
y a shor
tage or inadequac
y of the
follo wing? (Librar y mat er ials r ele vant t
o mathematics instruc
tion)
Table 8 c on tinued Name Label
Variables used in standar
d
model
Variables used in c
oun tr y‑ specific models Belg ium (F rench) England Netherlands Nor thern Ir eland Nor w ay A CBG10CE Ho
w much is y
our school ’s capacit y t o pr ovide instruc tion aff ec ted b
y a shor
tage or inadequac
y of the
follo
wing? (
Calculat
ors f
or mathematics instruc
tion) X A CBG10D A Ho
w much is y
our school ’s capacit y t o pr ovide instruc tion aff ec ted b
y a shor
tage or inadequac
y of the
follo
wing? (
Teachers with a specialization in science)
X
A
CBG11AA
Ho
w of
ten does y
our school do the f
ollo
wing f
or par
ents concer
ning individual students? (I
nf
or
m
par
ents about their child
’s lear ning pr og ress) X X A CBG11AB Ho w of
ten does y
our school do the f
ollo
wing f
or par
ents concer
ning individual students? (I
nf
or
m
par
ents about the beha
vior and w
ell-being of their child at school)
X A CBG11A C Ho w of
ten does y
our school do the f
ollo
wing f
or par
ents concer
ning individual students? (Discuss
par
ents
’ concer
ns or wishes about their child
’s lear ning) X A CBG11BA Ho w of
ten does y
our school ask par
ents t
o do the f
ollo
wing? (
Volunt
eer f
or school pr
ojec ts , pr og rams , and tr ips) X X A CBG11BB Ho w of
ten does y
our school ask par
ents t
o do the f
ollo
wing? (S
er
ve on school committ
ees) X A CBG11CB Ho w of
ten does y
our school do the f
ollo
wing f
or par
ents in general? (I
nf
or
m par
ents about school
accomplishments ( e.g ., t our nament r esults , facilit y impr ov ements)) X X A CBG11C C Ho w of
ten does y
our school do the f
ollo
wing f
or par
ents in general? (I
nf
or
m par
ents about the educa
-tional goals and pedagog
ic pr
inciples of the school)
X A CBG12B Ho w w ould y ou charac ter iz
e each of the f
ollo
wing within y
our school? (
Teachers
’ understanding of the
school ’s cur ricular goals) X A CBG12D Ho w w ould y ou charac ter iz
e each of the f
ollo
wing within y
our school? (
Teachers ’ expec tations f or student achie vement) X A CBG12E Ho w w ould y ou charac ter iz
e each of the f
ollo
wing within y
our school? (P
ar ental suppor t f or student achie vement) X A CBG12F Ho w w ould y ou charac ter iz
e each of the f
ollo
wing within y
our school? (P
ar
ental in
volv
ement in school
ac tivities) X A CBG12G Ho w w ould y ou charac ter iz
e each of the f
ollo
wing within y
our school? (Students
Table 8 c on tinued Name Label
Variables used in standar
d
model
Variables used in c
oun tr y‑ specific models Belg ium (F rench) England Netherlands Nor thern Ir eland Nor w ay A CBG12H Ho w w ould y ou charac ter iz
e each of the f
ollo
wing within y
our school? (Students
’ desir
e t
o do w
ell at school) X X X A CBG13AA
To what deg
ree is each of the f
ollo
wing a pr
oblem among <f
our
th-grade> students in y
our school?
(Ar
riving lat
e at school)
X
A
CBG13AB
To what deg
ree is each of the f
ollo
wing a pr
oblem among <f
our
th-grade> students in y
our school? (Unjustified absent eeism) X A CBG13A C
To what deg
ree is each of the f
ollo
wing a pr
oblem among <f
our
th-grade> students in y
our school? (Classr oom distur bance) X A CBG13A J
To what deg
ree is each of the f
ollo
wing a pr
oblem among <f
our
th-grade> students in y
our school?
(Intimidation or v
er
bal abuse of t
eachers or staff (including t
ex ting , emailing , et c.)) X A CBG13BB
To what deg
ree is each of the f
ollo
wing a pr
oblem among t
eachers in y
our school? (
Absent eeism) X A CBG14A In y our school , ar e an
y of the f
ollo
wing used t
o e
valuat
e the prac
tice of <f
our th-grade> t eachers? (Obser vations b
y the pr
incipal or senior staff
) X X A CBG14C In y our school , ar e an
y of the f
ollo
wing used t
o e
valuat
e the prac
tice of <f
our th-grade> t eachers? (Student achie vement) X A CBG15C Dur
ing the past y
ear
, appr
oximat
ely ho
w much time ha
ve y
ou spent on the f
ollo
wing school leader
-ship ac
tivities in y
our r
ole as a school pr
incipal? (M
onit
or
ing t
eachers
’ implementation of the school
’s
educational goals in their t
eaching)
X
A
CBG15D
Dur
ing the past y
ear
, appr
oximat
ely ho
w much time ha
ve y
ou spent on the f
ollo
wing school leader
-ship ac
tivities in y
our r
ole as a school pr
incipal? (M onit or ing students ’ lear ning pr og ress t o ensur e
that the school
’s educational goals ar
e r eached) X A CBG15G Dur
ing the past y
ear
, appr
oximat
ely ho
w much time ha
ve y
ou spent on the f
ollo
wing school leader
-ship ac
tivities in y
our r
ole as a school pr
incipal? (
A
ddr
essing disruptiv
e student beha
vior)
X
A
CBG15H
Dur
ing the past y
ear
, appr
oximat
ely ho
w much time ha
ve y
ou spent on the f
ollo
wing school leader
-ship ac
tivities in y
our r
ole as a school pr
incipal? (
Cr
eating a climat
e of trust among t
eachers) X X A CBG15K Dur
ing the past y
ear
, appr
oximat
ely ho
w much time ha
ve y
ou spent on the f
ollo
wing school leader
-ship ac
tivities in y
our r
ole as a school pr
incipal? (
Visiting other schools or att
Name
Label
Variables used in standar
d
model
Variables used in c
oun
tr
y‑
specific models
Belg
ium
(F
rench)
England
Netherlands
Nor
thern
Ir
eland
Nor
w
ay
A
CBG16A
About ho
w man
y of the students in y
our school can do the f
ollo
wing when the
y beg
in pr
imar
y/
elementar
y school? (R
ecog
niz
e most of the lett
ers of the alphabet)
X
A
CBG16B
About ho
w man
y of the students in y
our school can do the f
ollo
wing when the
y beg
in pr
imar
y/
elementar
y school? (R
ead some w
or
ds)
X
A
CBG17G
A
t which g
rade do the f
ollo
wing r
eading sk
ills and strat
eg
ies first r
eceiv
e a major emphasis in instruc
-tion in y
our school? (Identifying the main idea of a t
ex
t)
X
A
CBG17N
A
t which g
rade do the f
ollo
wing r
eading sk
ills and strat
eg
ies first r
eceiv
e a major emphasis in instruc
-tion in y
our school? (D
et
er
mining the author
’s perspec
tiv
e or int
ention)
X
A
CBG18C
Compar
ed with other ar
eas of the cur
riculum (
e.g
., mathematics and science), ho
w much emphasis
does y
our school place on t
eaching the f
ollo
wing language and lit
erac
y sk
ills t
o students in <g
rades
1–4>? (Speak
ing/list
ening (
oral language)
X
A
CBG19
For students in <f
our
th g
rade> and belo
w
, does y
our school mak
e pr
ovisions f
or r
eading instruc
tion in
mother t
ongue f
or students whose mother t
ongue is not <language of t
est>?
X
X
Table
8
c
on
Authors’ contributions
SM developed the research questions and design, supervised data compilation, conducted major parts of the statistical analysis and interpretation of results and drafted major parts of the manuscript. DC conducted parts of the statistical analysis, drafted minor parts of the manuscript and critically revised all other parts of the manuscript. ST was responsible for data compilation and merging, preparation of data analysis, drafting all tables, and manuscript revision. All authors have given final approval of the manuscript version to be published and agree to be accountable for all aspects of the work in ensuring that questions related to the accuracy or integrity of any part of the work are appropriately investigated and resolved.
Author details
1 IEA Data Processing and Research Center, Hamburg, Germany. 2 Johannes-Gutenberg-University, Mainz, Germany. Acknowledgements
The authors are thankful to Marc Joncas and Plamen Mirazchiyski and two peer reviewers for their very useful comments. Competing interests
The authors declare to have no competing interests. Received: 21 September 2015 Accepted: 16 January 2017
References
Baker, D. P., Goesling, B., & Letendre, G. K. (2002). Socioeconomic status, school quality, and national economic develop-ment: A cross-national analysis of the “Heyneman-Loxley effect” on mathematics and science achievement. Com-parative Education Review,46(3), 291–312.
Bethlehem, J. G., & Kersten, H. M. P. (1985). On the treatment of nonresponse in sample surveys. Journal of Official Statis-tics,1(3), 287–300.
Caldas, S. J., & Bankston, C. (1997). Effect of school population socioeconomic status on individual academic achieve-ment. Journal of Educational Research,90(5), 269–277.
Fuller, Bruce. (1987). What school factors raise achievement in the Third World. Review of Educational Research,37, 255–293. Grace, K., & Thompson, J. S. (2003). Racial and ethnic stratification in Educational Achievement and Attainment. Annual
Review of Sociology,29, 417–442.
Helmschrott, S., & Martin, S. (2014). Nonresponse in PIAAC Germany. Methods, Data, Analysis I,8(2), 243–266. Koretz, D., McCaffrey, D., & Sullivan, T. (2001). Predicting variations in mathematics performance in four countries using
TIMSS. Education Policy Analysis Archives, 9(34). Retrieved on 08/27/2009 from http://epaa.asu.edu/epaa/v9n34/. Lamb, S., & Fullarton, S. (2001). Classroom and school factors affecting mathematics achievement: A comparative study of
the US and Australia using TIMSS. Trends in International Mathematics and Science Study (TIMSS), TIMSS Australia Monograph Series, Australian Council for Educational Research.
Lepidus Carlson, B. & Williams, S. (2001). A comparison of two methods to adjust weights for non-response: propensity modelling and weighting class adjustments. In Proceedings of the annual meeting of the American Statistical Associa-tion, August 5–9, 2001.
Lynn, P. (2003). PEDAKSI: Methodology for collecting data about survey nonrespondents. Quality & Quantity,37, 239–261. Martin, M. O., & Mullis, I. V. S. (Eds.). (2013). Methods and procedures in TIMSS and PIRLS 2011. Chestnut Hill, MA: Lynch
School of Education, Boston College.
Matsuo, H., Billiet, J., Loosvelt, G., & Kleven, O. (2010). Measurement and adjustment of nonresponse bias based on nonre-sponse surveys: The case of Belgium and Norway in the European Social Survey Round 3. Survey Research Methods, 4(3), 165–178.
Meinck, S. (2015). Computing sampling weights in large-scale assessments in education. Survey insights: Methods from the field, weighting: Practical issues and ‘how to’ approach. Retrieved from http://surveyinsights.org/?p=5353.
Meinck, S., & Cortes, D. (2015). Sampling weights, nonresponse adjustments and participation rates. In: Fraillon, J., Schulz, W., Friedman, T., Ainley, J., & Gebhardt, E. (Eds.), International computer and information literacy study 2013 technical report. Amsterdam: International Association for the Evaluation of Educational Achievement (IEA).
Mohadjer, L., Krenzke, T., & van de Kerchhove, W. (2013). Indicators of the quality of the sample data. In: Kirsch I., & Thorn, W. (Eds), Technical report of the survey of adult skills (PIAAC). Paris, France: Organization for Economic Co-operation and Development (OECD).
Mullis, I. V. S., Martin, M. O., Foy, P., & Arora, A. (2012a). TIMSS 2011 international results in mathematics. Boston: TIMSS & PIRLS International Study Center, Boston College.
Mullis, I. V. S., Martin, M. O., Foy, P., & Drucker, K. T. (2012b). PIRLS 2011 international results in reading. Boston: TIMSS & PIRLS International Study Center, Boston College.
OECD (2013). OECD skills outlook 2013: First results from the survey of adult skills. New York: OECD Publishing. doi:10.1787/9789264204256-en
OECD (2014). TALIS 2013 results: An international perspective on teaching and learning. New York: OECD Publishing. Schulz, W., Ainley, J., & Fraillon, J. (Eds.). (2011). ICCS 2009 technical report. Amsterdam: The International Association for the
Evaluation of Educational Achievement.
Stoop, I. A. L. (2004). Surveying nonrespondents. Field Methods,16(1), 23–54.