RESEARCH ARTICLE
The examination of Van Gogh’s chrome
yellow pigments in ‘Field with Irises near Arles’
using quantitative SEM–WDX
Muriel Geldof
1*, Inez Dorothé van der Werf
1and Ralph Haswell
2Abstract
In this paper we present the results of quantitative measurements on the pigment chrome yellow (PbCr1−xSxO4 with 0 ≤ x ≤ 0.8) using scanning electron microscopy-wavelength dispersive X-ray analysis (SEM–WDX). Traditionally, Opti-cal Microscopy (OM) in combination with scanning electron microscopy-energy dispersive X-ray analysis (SEM–EDX) is used for the identification of many pigments in paint cross-sections based on their particle characteristics and elemental composition. However, in the case of chrome yellow, the lead (Pb) and sulphur (S) peaks overlap, which makes quantitative analysis unreliable. SEM–WDX does not suffer from this problem and we have demonstrated that this technique can distinguish different types of chrome yellow based on the quantification of the sulphur-content of the pigment. This identification can be performed on paint cross-sections, allowing for distinction between chrome yellows in different paint layers. In addition, our study showed that the different types of chrome yellow can still be identified even in low concentrations. Van Gogh made wide use of different hues of chrome yellow. Using this method, we have identified the types of chrome yellow he used in Field with Irises near Arles, which we have been able to correlate with the information in his letters. Raman spectroscopy of the same samples confirmed the SEM–WDX results, but evidenced a higher sensitivity of the latter technique in revealing small amounts of sulphur-rich PbCr1−
xSxO4 in mixtures with PbCrO4. SEM–WDX is also more accurate, because it allows the lead(II) sulphate fraction to be
determined within 1 mol% absolute, whereas with Raman spectroscopy only relatively broad ranges can be defined. The on-going research of Van Gogh’s paintings as part of a cataloguing project—a collaboration between the Van Gogh Museum, the Cultural Heritage Agency of the Netherlands and Shell—opens the way for a comprehensive comparison of the chrome yellows used by Van Gogh using SEM–WDX.
Keywords: SEM, EDX, WDX, Raman, Van Gogh, Pigments, Chrome yellow
© The Author(s) 2019. This article is distributed under the terms of the Creative Commons Attribution 4.0 International License (http://creat iveco mmons .org/licen ses/by/4.0/), which permits unrestricted use, distribution, and reproduction in any medium, provided you give appropriate credit to the original author(s) and the source, provide a link to the Creative Commons license, and indicate if changes were made. The Creative Commons Public Domain Dedication waiver (http://creativecommons.org/ publicdomain/zero/1.0/) applies to the data made available in this article, unless otherwise stated.
Introduction
Chrome yellow pigments were invented in the early nine-teenth century, with hues ranging from lemon-yellow to deep orange-yellow depending on the composition and crystal structure of the pigment [1, 2]. Chrome yellow can be denoted with the general formula PbCr1−xSxO4 (0 ≤ x ≤ 0.8). Chrome yellows that do not contain any sul-phate (x = 0) are medium yellow in colour and have a mon-oclinic crystal structure, while the more orange-yellow
varieties contain some chrome orange (Pb2CrO5) in addi-tion [3]. The lighter varieties show variable amounts of sulphate and might exist in both the monoclinic and orthorhombic crystal structure, the latter becoming favorable when higher amounts of sulphate are present [4].
Van Gogh made use of these different hues of chrome yellow. His letters to his brother Theo include lists of paints that he wanted his brother to buy on his behalf. In these paint orders, he requests three different hues of chrome yellow: Chrome 1, Chrome 2 and Chrome 3, described as the lemon, the yellow and the orange.1
Open Access
*Correspondence: m.geldof@cultureelerfgoed.nl
1 Cultural Heritage Agency of the Netherlands, Hobbemastraat 22, 1071
ZC Amsterdam, The Netherlands
Full list of author information is available at the end of the article
1 Letter 595, from Vincent van Gogh to Theo van Gogh, Arles, on or about
Chemical analysis of paint samples has, indeed, shown the presence of different types of chrome yellow in his paintings [5, 6].
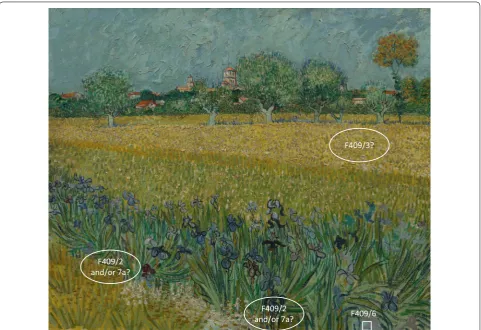
Field with Irises near Arles (F409) was painted by Van Gogh in May 1888, just a few months after his arrival in Arles in February 1888 (Fig. 1). He had probably brought some paints with him from Paris, where he had lived before he came to Arles, but started to look for a good local supplier soon after his arrival. When he failed to find one to his satisfaction, he decided to order his paints from his former dealers Tasset et L’Hôte and Tanguy via his brother Theo in Paris. He placed his first order for paints, including the three types of chrome yellow mentioned above, in a letter of 5 April 1888,2 which he received from Tasset et L’Hôte soon afterwards.3
It is known from literature that chrome yellow oil paint is prone to darkening or browning due to photo-reduc-tion of the chromate ions to chromium(III)-compounds. This concerns especially the sulphate-rich, orthorhom-bic variety of the pigment; the monoclinic lead chro-mate variety appears to be much more lightfast [1, 7–9], although Otero et al. have demonstrated that the pres-ence of calcium carbonate and/or gypsum—materials often encountered in Van Gogh’s chrome yellow paints [10, 11]—in chrome yellow oil paint enhances the reac-tivity of the latter variety [12]. Indeed, paints containing this supposed more stable variety are often in a deterio-rated and vulnerable condition and show darkening as well. In Field with Irises near Arles, the colour change of the assumed pure lead chromate paint is probably caused by external influences—like deposition of material on the surface—rather than deterioration of the pigment itself [13, 14].
The Van Gogh Museum, the Cultural Heritage Agency of the Netherlands and Shell collaborated in several pro-jects on the painting materials and techniques of Van
F409/2
and/or 7a? F409/6
F409/2 and/or 7a?
F409/3?
Fig. 1 Vincent van Gogh, Field with Irises near Arles (F409), 1888, Van Gogh Museum, Amsterdam (Vincent van Gogh Foundation). Locations where the samples were taken are indicated. For samples F409/2, 3 and 7a there are no records of the sampling locations; therefore, it is only possible to determine a likely area in the painting from which the samples were taken based on the paint layer structure and composition
2 Letter 593, from Vincent van Gogh to Theo van Gogh. Arles, on or about
Thursday, 5 April 1888.
3 Letter 595, from Vincent van Gogh to Theo van Gogh, Arles, on or about
Gogh. Currently, approximately eighty paintings that Van Gogh painted in Arles, Saint-Rémy-de-Provence and Auvers-sur-Oise (1888–1890) are being examined in the Van Gogh Museum as part of a cataloguing project per-formed by these research partners. In these projects hun-dreds of paint cross-sections have been examined, mostly using optical microscopy and scanning electron micros-copy (SEM) in combination with energy dispersive X-ray analysis (EDX) [10, 11]. This technique is widely used to study paint samples from works of art and provides reli-able qualitative and semi-quantitative compositional results [15–18]. It does, however, have some limitations, particularly regarding overlapping peaks due to its rela-tively low energy resolution. In the case of chrome yellow, optical microscopy in combination with SEM–EDX can provide an indication of the type of chrome yellow used based on the morphology and hue of the chrome yellow pigment, but it does not allow for proper identification of the variety of chrome yellow, since Pb-Mα and S-Kα lines overlap in the SEM–EDX spectrum. In order to distin-guish between the different types of chrome yellow, addi-tional analysis is needed. X-ray diffraction (XRD) is most commonly applied to identify these crystalline com-pounds [19]. This technique generally requires a loose paint sample, but synchrotron based XRD has success-fully been applied on paint cross-sections [6]. Alterna-tively, Fourier Transform Infrared Spectroscopy (FTIR) or Raman-analysis can be used to differentiate between the types of chrome yellow used in a painting [6–8]. Also, the development of non-invasive, in situ XRD and Raman analysis have made it possible to differentiate between types of chrome yellow without sampling [20–22], but these techniques are not very widespread.
One way to overcome the limitation of SEM–EDX regarding overlapping peaks is to use Wavelength Dis-persive X-ray analysis (WDX), which is known to have a much higher energy resolution than SEM–EDX. In the field of conservation this technique has been used to study ancient glass and glazes in ceramics [23–26], but only sporadically in the research of historic paints [27]. In this paper we explore the application of SEM–WDX on paint cross-sections taken from Field with Irises near Arles. Because of its higher energy resolution it should resolve the overlap issue between lead and sulphur, which would allow for the distinction of different varieties of chrome yellow. Micro-Raman spectroscopy was used for comparison and validation of the SEM–WDX results.
Experimental Standards
To determine how accurately SEM–WDX can measure the composition of chrome yellow, two types of standards
were prepared, namely: known mixtures of lead(II) sul-phate and lead(II) chromate in order to test how accu-rately the lead to sulphur ratio could be determined; and mixtures of lead(II) chromate sulphate (PbCr0.5S0.5O4) in lead white, which were used to test to what extent it was possible to still measure the chrome yellow composition when the pigment has been mixed with lead white.
The standards were prepared as follows: for the deter-mination of the lead to sulphur ratio lead(II) sulphate 98% (Aldrich) and lead(II) chromate ≥ 98% (Aldrich) were weighed and mixed thoroughly in a mortar, resulting in 5, 14, 27, 49 and 77 mol% mixtures of lead(II) sulphate to lead(II) chromate. For the determination of sulphate-rich chrome yellow in lead white, primrose chrome yellow was used. This was prepared by Vanessa Otero (Univer-sidade NOVA de Lisboa) according to the Winsor and Newton manufacturing process (Pr1b_2, correspond-ing to PbCr0.5S0.5O4) [3, 28]. Mixtures of 0.1, 0.9, 4 and 10 wt% of the Pr1b_2 chrome yellow pigment were mixed with lead white, basic lead carbonate (2PbCO3·Pb(OH)2, ca. 99%, Kremer pigment), in a mortar. The mixtures, as well as the unmixed lead(II) sulphate, lead(II) chromate and lead(II) chromate sulphate (Pr1b_2 pigment), were embedded in Polypol PS230 polyester resin cubes and polished with SiC-paper (Struers and Micromesh).
Paint samples taken from Field with Irises near Arles
SEM–WDX analysis
To reduce charging in the SEM, the samples were coated with carbon. The samples were examined with an Oxford Wave WDX system mounted on a Zeiss EVO60 XVP SEM. All images were made using backscattered elec-trons. Typically, three spectra were taken from differ-ent points in each sample using an accelerating voltage of 20 kV. When selecting the regions to be measured, care was taken to only select yellow areas (visualised on images taken using OM), thus avoiding any contribu-tions to the chromium and sulphur signal from other pigments, such as viridian (transparent chromium oxide green), chrome orange (basic lead chromate) or synthetic ultramarine blue (a complex aluminium and sulphur-containing sodium-silicate). A magnification was cho-sen so that as much of the sample as possible could be measured which was typically around 1000 times. As a final check, prior to the WDX measurement, the selected area was also measured using EDX (Oxford X-max EDS-system with a 20 keV primary electron beam energy) to
confirm that the area contained no unwanted pigments or fillers, such as calcium or barium sulphate. The beam current used for the WDX measurements was typically between 10 and 15 nA and the measuring time per peak varied from 5 to 20 s. The beam current chosen is larger than is typically used for SEM–EDX, but was needed in order to measure the spectra in a reasonable time and thus avoid experimental artefacts that might arise due to, for example, sample and beam current drift. The WDX peak height was used for the quantification with the background subtracted. After SEM–WDX analysis the carbon coating was removed by polishing and the paint cross-sections were re-examined by OM. No dam-age of the paint cross-sections was visible under these circumstances.
Micro‑Raman spectroscopy
The micro-Raman spectra were obtained with a Per-kin-Elmer Raman Micro 300 (Raman microscope) and a Raman Station 400F (Raman spectrometer) with a
F
F409/2
F409/7a F409/6
F409/3
light medium
dark
diode laser (λ0= 785 nm), in combination with a Olym-pus BX51M microscope. Exposure time, laser power and accumulations were selected for each measurement to obtain optimal spectra. The laser spot has a diameter of ca. 20 µm (50× objective) or 10 µm (100× objective) and the laser power (10–100%) varies in the range of 7–70 mW (50× objective) and 4–40 mW (100× objec-tive) with a 600 lines/mm grating. Raman scattering is fil-tered with a double holographic notch filter system and is detected with an air-cooled charge coupled device (CCD) detector. The Raman spectra were processed with Origin 8.0 software.
Results and discussion
SEM–WDX has a resolution of around 10 eV compared to around 130 eV for EDX. The difference this makes becomes apparent when the EDX and WDX spectra from the same region of the 49% lead(II) sulphate to lead chro-mate standard are shown overlaid (Fig. 3). The sulphur peak is clearly visible in the WDX spectrum, but not in the EDX measurement. This illustrates one of the main advantages of WDX over EDX in that it can clearly meas-ure both the lead and sulphur peaks and thus unambigu-ously confirm the presence of both elements. This is not the case in EDX. Although peak fitting routines can be employed to determine the amount of sulphur and lead, this can lead to greater uncertainty, especially when the concentration of sulphur is low. As WDX does not suf-fer from any peak overlap, the limit of detection is simply related to the sensitivity of the WDX detector itself.
To test the sensitivity of the WDX detector, a series of standards which contained known amounts of lead(II)
sulphate and lead(II) chromate were measured: the results are shown in Fig. 4. Examination of these results reveals a positive, linear correlation between the amount of lead(II) sulphate and the sulphur signal measured with WDX. We used these results to determine a conversion factor to convert the sulphur measured with the WDX into the fraction of lead(II) sulphate. This was done by using a linear extrapolation of the data in Fig. 4 with the intercept set to zero. The R2 value was 0.9886, which sug-gests that this gives a reliable fit.
To test the detection limit of WDX, we measured a series of standards where primrose chrome yellow pig-ment was mixed with lead white. The pure primrose chrome yellow pigment contained around 50 mol% lead(II) sulphate (hence PbCr0.5S0.5O4) as determined by WDX. This is in good agreement with results from FTIR- and Raman-measurements in literature [28] and performed in our laboratory. All spectral features of PbCr0.5S0.5O4 [5, 14] could be clearly observed: the Raman signals of the ν1(SO42−) mode at 973 cm−1, the ν1(CrO42−) mode at 843 cm−1 and the five modes in the Cr–O bending region at 405, 377, 358, and 337, 325 cm−1. With WDX the sulphur from the standards containing more than 5 wt% of the lead chromate sul-phate pigment could be detected, as defined by the height of the sulphur peak being at least three times the back-ground signal. This suggests that the detection limit for this WDX method is around this level.
PbCr0.5S0.5O4 could still be observed for the 5 wt% of the lead chromate sulphate pigment. At lower concentrations (1 wt% and 0.1 wt%) the characteristic peaks in the Cr–O bending region are very low and broad. So, comparable detection limits as with WDX were obtained.
To determine the amount of lead(II) sulphate in the chrome yellow pigment we used the ratio of the sulphur signal to the sum of the chromium and sulphur signals. Figure 5 shows the results of this ratio from the meas-urements of the 27, 49 and 77 mol% mixtures standards of lead(II) sulphate to lead(II) chromate as well as of the unmixed lead(II) sulphate and lead(II) chromate. From these data, a conversion factor was also determined using linear extrapolation with the intercept set to zero. The R2 value was 0.9818. Although this is not as good as the lead versus sulphur plot, as this is lead independent, it is our preferred method of determining the lead(II) sulphate fraction in chrome yellow. To test the accuracy of the conversion factor two additional standards with 14 mol% and 5 mol% lead(II) sulphate mixed with lead(II) chro-mate were analysed. For the 14 mol% nominal standard 14.0 was measured with a 95% confidence of ± 0.58; the expected value was 14.4. For the 5 mol% nominal stand-ard 5.1 was measured with a 95% confidence of ± 0.51; the expected value was 5.1. One sample t-tests showed that the measured value is not significantly different from
the expected value at an alpha of 0.05 for both standards. These results indicate that the WDX can determine the lead(II) sulphate fraction to within approximately 1 mol% absolute.
The results from the measurements on the various standards show that we can use WDX to determine the fraction of lead(II) sulphate in both pure chrome yel-low pigment as well as in mixtures of this pigment in lead white. This now makes it possible to determine the fraction of lead(II) sulphate in chrome yellow in paint samples from actual paintings. As an example, we have measured the composition of chrome yellow containing paint samples taken from Van Gogh’s Field with Irises near Arles. A summary of the results of the SEM–WDX analysis and micro-Raman spectroscopy of these samples is shown in Table 1.
The chrome yellow paints in both cross-sections con-tain calcium carbonate, which was probably added by the paint manufacturer in order to obtain a lighter shade or to enhance the working properties of the paint, although it can also form as a by-product in the production of chrome yellow under certain conditions [29]. Interestingly, Otero et al. reported in their study on Winsor and Newton’s production records that the
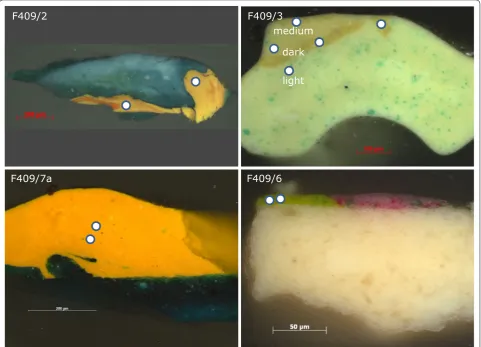
presence of calcium carbonate is characteristic of their middle chrome formulations [3]. The yellow paint layer in F409/2 is inhomogeneously mixed with the orange-red pigment orange-red lead; these orange-reddish areas were avoided in our measurements.
Examination of the SEM–WDX results shown in Table 1 reveals that the yellow paint layers in cross-sections F409/2 and F409/7a contain the same type of Fig. 5 Plot of the amount of lead(II) sulphate versus the ratio of sulphur to the sum of the chromium and sulphur measured using WDX in the lead(II) sulphate and lead(II) chromate mixtures standards
Table 1 Summary of the SEM–WDX and Raman results of chrome yellow containing paint samples taken from Field with
Irises near Arles
a Estimation based on the method described by Monico et al. [20]
b The signals in the Raman spectrum are very weak so peak assignments are uncertain
Sample ID (Probable) location SEM–WDX estimated fraction
of lead(II) sulphate in chrome yellow (mol%)
Raman estimated fraction of lead (II) sulphate in chrome yellow
(mol%)a
F409/2 Brown yellow buttercups in foreground 6 0 F409/3 dark yellow Yellow paint from the field in the
back-ground 50 50
F409/3 medium yellow Yellow paint from the field in the
back-ground 51 50
F409/3 light yellow Yellow paint from the field in the
back-ground 51 50
F409/6 Yellow green paint from the field 24–42 25–50b
chrome yellow pigment: the fraction of lead(II) sulphate being very low, around 5–6 mol%. This type of chrome yellow probably corresponds to a medium colored vari-ant of the pigment, generally assumed to contain mainly lead(II) chromate (PbCrO4), with small amounts of lead(II) chromate sulphate [1]. Monico et al. [6] identified monoclinic lead(II) chromate in another sample taken from Field with Irises near Arles. In our study micro-Raman spectroscopy was also used to analyse the yel-low paint of samples F409/2 and F409/7a (Fig. 6). Similar spectra were obtained with main peaks at 840 cm−1 and at 400, 377, 359, and 338 cm−1. No ν
1(SO42−) mode could be detected, suggesting that the relative amount of sul-phate is low. These results indicate the presence of mono-clinic PbCrO4 alone or, as suggested by the SEM–WDX results, in a mixture with very small amounts of lead(II) chromate sulphate. According to Monico et al. [20], it is difficult to detect small amounts of sulphur-rich PbCr1− xSxO4 if mixed with relatively high amounts of monoclinic PbCrO4. In this study the superior sensitivity of SEM– WDX was capable of detecting 5–6 mol% of sulphate.
Cross-section F409/3 consists of three paint layers containing chrome yellow mixed with lead white and, in addition, some emerald green in the bottom and top layer (Fig. 2). This paint sample was possibly taken from the yel-low paint in the field in the background. The bottom paint layer is the lightest in colour, followed by a darker yel-low layer and, finally, a medium yelyel-low layer. SEM–WDX analysis showed that in all three layers the chrome yellow is of the same sulphur-rich type with a fraction of approx-imately 50% of lead(II) sulphate. The differences in hue of the yellow layers was in this case accomplished by varying the amount of lead white, and is not related to the type
of chrome yellow used. The chrome yellow present in this cross-section differs from the one identified in F409/2 and F409/7a. It corresponds to a lighter variety of the pigment, probably sold as primrose or lemon yellow.
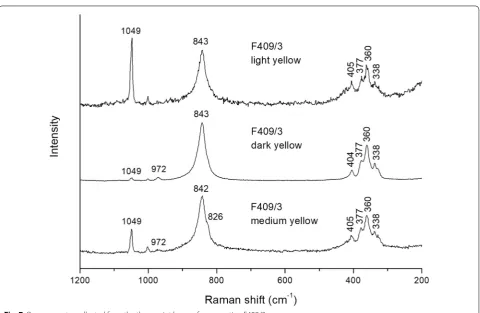
Raman measurements of cross section F409/3 show that the yellow pigments in the three layers yield similar spectra with bands at 972, 842/843, 404/405, 377, 360, and 338 cm−1 (Fig. 7). The same spectral features were observed for the pure primrose chrome yellow pigment and indicate the presence of monoclinic PbCr1−xSxO4 with x ~ 0.5. This seems to be confirmed by the absence of signals at 450 and 438 cm−1 (sulphate bending modes), suggesting a S-rich coprecipitate with x < 0.75 [20]. As expected, the relative amount of lead white (1049 cm−1) is highest in the light yellow and lowest in the dark yellow paint layers. In the medium yellow layer some chrome orange is also present, as indicated by the shoulder at 826 cm−1. A mixture of chrome orange and PbCr1
−xSxO4 with x > 0.4 was also found in two regions of the sun-flower petals with an orange-yellow tone in the Sunflow-ers owned by the Van Gogh Museum [30].
The cross-section from a sample taken from one of the irises (F409/6) in the foreground includes the yellow-green paint of the vegetation (Fig. 2). This paint contains a mixture of the pigments emerald green and chrome yel-low and the fillers barium sulphate and calcium carbon-ate. The presence of the sulphur from barium sulphate complicates the analysis of the chrome yellow. In order to correct for the sulphur from the barium sulphate, we used the barium to sulphur ratio from a barium sulphate crystal in the layer and then used the barium signal from the regions of interest to estimate the associated sulphur signal. This signal was then subtracted from the over-all signal in order to give the amount of sulphur associ-ated with the chrome yellow. In practice, we have found that the barium to sulphur ratio varies significantly, both within one crystal as well as between different crystals. This is probably due to the small size of the crystals, which means that there is a contribution from the surround-ing region. As a result, it is not possible, at present, to give an absolute value. Instead, we estimated the fraction of lead(II) sulphate in the chrome yellow as being in the range 24 to 42 mol%. This would suggest that Van Gogh used yet another variety of chrome yellow in Field with Irises near Arles, which has a hue in between lemon and medium yellow. However, it could also be possible that Van Gogh mixed the two varieties of chrome yellow [31].4 Fig. 6 Raman spectrum collected from the yellow paint layer of cross
section F409/7a
4 It is clear from his letters that Van Gogh did sometimes mix his chrome
Sample F409/6 was also analyzed with micro-Raman spectroscopy. The spectrum is rather noisy and shows weak bands at ca. 841, 403, 376, 359, and 337 cm−1. These features point to PbCr1−xSxO4 with 0.25 < x < 0.5, but there is some uncertainty concerning the peak maxima. For this sample the SEM–WDX results seem to be more informative.
From our results it appears that Van Gogh used at least two different types of chrome yellow in Field with Irises near Arles: almost pure lead chromate (PbCrO4) and chrome yellow with approximately equal amounts of sulphate to chromate (PbCr0.5S0.5O4). In addition, a third variety with a fraction of lead(II) sulphate between 24 and 42 mol% might be present. Monico et al. [6] distinguished three different varieties of chrome yellow in the paintings that Van Gogh made in Arles: monoclinic PbCrO4, mon-oclinic PbCr1−xSxO4 with x < 0.5 and monoclinic and possible orthorhombic PbCr1−xSxO4 with x ≥ 0.5.
On 11 April 1888, Van Gogh received three types of chrome yellow from the Paris supplier Tasset et L’Hôte: Chrome 1, Chrome 2 and Chrome 3, described as ‘lemon’, ‘yellow’ and ‘orange’ respectively.5 It is likely that Van
Gogh used these paints when creating Field with Irises near Arles in May 1888. The almost pure lead chromate probably corresponds to the yellow Chrome 2, while the sulphur-rich variety must match the lemon Chrome 1. Chrome 3, the orange variety, probably contained chrome orange [11, 31, 32]. Van Gogh also bought painting mate-rials from an Arles supplier before he started to purchase his materials via his brother Theo in Paris in April 1888. In the case that the third intermediate variety identified in Field with Irises near Arles is not a mixture of chrome yellows 1 and 2, then it might, instead, be a separate tube paint that was obtained locally.
Conclusions
Using SEM–WDX analysis, different types of chrome yellow (PbCr1−xSxO4) can be distinguished based on the quantification of the sulphur-content of the pig-ment. This identification can be performed on paint cross-sections, allowing for distinction between chrome yellows in different paint layers. Using this method, at least two different types of chrome yellow in Field with Irises near Arles were identified: almost pure lead chromate (PbCrO4) and chrome yellow with approximately equal amounts of sulphate to chromate Fig. 7 Raman spectra collected from the three paint layers of cross section F409/3
5 Letter 595 from Vincent van Gogh to Theo van Gogh, Arles, on or about
(PbCr0.5S0.5O4). In addition, a third variety with a fraction of lead(II) sulphate between 24 and 42 mol% might be present.
Comparison with Raman spectroscopy showed that SEM–WDX is rather more accurate, because it allows the lead(II) sulphate fraction to be determined within 1 mol% absolute, whereas with Raman spectroscopy only relatively broad ranges can be defined. The sensi-tivity of SEM–WDX seems to be comparable to Raman spectroscopy; a detection limit of around 5 wt% for lead chromate sulphate (PbCr0.5S0.5O4) in lead white was determined for both techniques. According to Monico et al. [20] using Raman spectroscopy the detection of sulphur-rich PbCr1−xSxO4 in mixtures with monoclinic PbCrO4 is only possible if the former is present in suf-ficiently high concentrations. On the contrary, SEM– WDX is capable of detecting sulphur in such mixtures with low concentrations of lead chromate sulphate. In mixtures the result is an average of the sulphur-con-tent and therefore, the technique can not differentiate between the varieties of chrome yellow present. Also other sulphur-containing pigments or fillers, such as barium sulphate, might contribute to the sulphur-signal detected with SEM–WDX which complicates the anal-ysis. With the exception of lead(II) sulphate, the pres-ence of these materials are not expected to hinder the identification of sulphur-rich PbCr1−xSxO4 by Raman spectroscopy.
Paint cross-sections of the paintings examined in the current cataloguing project, as well as those available from previous studies, will be investigated with SEM– WDX by the authors. Van Gogh purchased his paints from several suppliers, each of which sold a number of hues of chrome yellow paint. It is expected to find differences in composition not only between the hues offered by each of them, but also between the paints sold by different suppliers. Correlation between the paint orders in Van Gogh’s letters and the chrome yel-lows identified on his paintings will provide us with information about the specific pigment compositions of these paints. Moreover, the project will give us the unique opportunity to study the relation between the variety of chrome yellow used and its degradation in situ. This degradation includes not only darkening, but also softening and loss of coherence of the paint layer.
Acknowledgements
This work was possible due to the financial support of Shell Netherlands B.V. We are particularly grateful to Vanessa Otero and Leslie Carlyle from the Uni-versidade NOVA de Lisboa for supplying the primrose chrome yellow pigment. We thank Marije Vellekoop (Head of Collections, Research and Presentation at the Van Gogh Museum) and Ella Hendriks (formerly Senior Conservator at the Van Gogh Museum) for their interest and support during this research.
RH and MG designed and run the SEM–WDX experiments, and IvdW per-formed the micro-Raman spectroscopy. All authors contributed in writing the manuscript. All authors read and approved the final manuscript.
Funding
Not applicable.
Availability of data and materials
The datasets used and/or analysed during the current study are available from the corresponding author on reasonable request.
Competing interests
The authors declare that they have no competing interests.
Author details
1 Cultural Heritage Agency of the Netherlands, Hobbemastraat 22, 1071
ZC Amsterdam, The Netherlands. 2 Shell Global Solutions International B.V.,
Grasweg 31, 1031 HW Amsterdam, The Netherlands.
Received: 30 July 2019 Accepted: 18 November 2019
References
1. Kühn H, Curran M. Chrome yellow and other chromate pigments. In: Feller RL, editor. Artists’ pigments: a handbook of their history and charac-teristics, vol. 1. London: Cambridge University Press; 1986. p. 187–204. 2. Vauquelin M. Mémoire sur la meilleure méthode pour décomposer le chrômate de fer, obtenir l’oxide de chrôme, préparer l’acide chrômique, et sur quelques combinaisons de ce dernier. Ann Chim. 1809;70:70–94. 3. Otero V, Pinto JV, Carlyle L, Vilarigues M, Cotte M, Melo MJ. Nineteenth
century chrome yellow and chrome deep from Winsor & Newton TM. Stud Conserv. 2017;62:123–49.
4. Watson V, Clay HF. The light-fastness of lead chrome pigments. J Oil Colour Chemi Assoc. 1955;38:167–78.
5. Leighton J, Reeve A, Roy A, White R. Vincent van Gogh’s ‘A Cornfield, with Cypresses’. National Gallery Technical Bulletin. 1987;11:42–60.
6. Monico L, Janssens K, Miliani C, Brunetti BG, Vagnini M, Vanmeert F, Falkenberg G, Abakumov A, Lu Y, Tian H, Verbeeck J, Radepont M, Cotte M, Hendriks E, Geldof M, van der Loeff L, Salvant J, Menu M. Degradation process of lead chromate in paintings by Vincent van Gogh studied by means of spectromicroscopic methods. 3. Synthesis, characterization, and detection of different crystal forms of the chrome yellow pigment. Anal Chem. 2013;85:851–9.
7. Monico L, Janssens K, Miliani C, Van der Snickt G, Brunetti BG, Guidi MC, et al. Degradation process of lead chromate in paintings by Vincent van Gogh studied by means of spectromicroscopic methods. 4. artificial aging of model samples of co-precipitates of lead chromate and lead sulphate. Anal Chem. 2013;85:860–7.
8. Monico L, Van der Snickt G, Janssens K, De Nolf W, Miliani C, Verbeeck J, et al. Degradation process of lead chromate in paintings by Vincent van Gogh studied by means of synchrotron x-ray spectromicroscopy and related methods. 1. Artificially aged model samples. Anal Chem. 2011;83:1214–23.
9. Monico L, Sorace L, Cotte M, de Nolf W, Janssens K, Romani A, Miliani C. Disclosing the binding medium effects and the pigment solubility in the (photo)reduction process of chrome yellows (PbCrO4/PbCr1−xSxO4). ACS
Omega. 2019;4:6607–19. https ://doi.org/10.1021/acsom ega.8b036 69. 10. Hendriks E, van Tilborgh L. Vincent van Gogh paintings, volume 2,
Ant-werp and Paris 1885–1888. New York: Van Gogh Museum and Waanders; 2011.
11. Geldof M, Megens L, Salvant J. Van Gogh’s palette in Arles, Saint-Rémy and Auvers-sur-Oise. In: Vellekoop M, Hendriks E, Jansen L, Geldof M, de Tagle A, editors. Van Gogh’s Studio Practice. Van Gogh Museum: Yale University Press; 2013. p. 238–56.
13. Kirchner E, van der Lans I, Ligterink F, Geldof M, Ness Proano Gaibor A, Hendriks E, et al. Digitally reconstructing Van Gogh’s Field with Irises near Arles, part 2: pigment concentration maps. Color Res Appl. 2017. https :// doi.org/10.1002/col.22164 .
14. Geldof M, Proano Gaibor AN, Ligterink F, Hendriks E, Kirchner E. Reconstructing Van Gogh’s palette to determine the optical character-istics of his paints. J Herit Sci. 2018;6:17. https ://doi.org/10.1186/s4049 4-018-0181-6e.
15. Burnstock A, Jones C. Scanning electron microscopy techniques for imaging materials from paintings. Radiation in art and archeometry. Amsterdam: Elsevier; 2000. p. 203–31.
16. Ajò D, Casellato U, Fiorin E, Vigat PA. Ciro Ferri’s frescoes: a study of painting materials and technique by SEM-EDS microscopy, X-ray dif-fraction, micro FT-IR and photoluminescence spectroscopy. J Cult Herit. 2004;5(4):333–48.
17. Dredge P, Wuhrer R, Phillips MR. Monet’s painting under the microscope. Microsc Microanal. 2003;9(2):139–43.
18. Haswell R, Carlyle L, Mensch CTJ. Van Gogh’s painting grounds: quantita-tive determination of bulking agents (extenders) using SEM/EDX. Micro-chim Acta. 2006;155:163–7.
19. Burnstock AR, Jones CG, Cressey G. Characterisation of artists’ chromium-based yellow pigments. Zeitschrift für Kunsttechnologie und Konservier-ung. 2003;17:74–84.
20. Monico L, Janssens K, Hendriks E, Brunetti BG, Miliani C. Raman study of different crystalline forms of PbCrO4 and PbCr1−xSxO4 solid solutions for
the noninvasive identification of chrome yellows in paintings: a focus on works by Vincent van Gogh. J Raman Spectrosc. 2014;45:1034–45. 21. Eveno M, Duran A, Castaing J. A portable X-ray diffraction apparatus for
in situ analyses of masters’ paintings. Appl Phys A. 2010;100:577–84. 22. Vanmeert F, Hendriks E, Van der Snickt G, Monico L, Dik J, Janssens K.
Chemical mapping by macroscopic X-ray powder diffraction (MA-XRPD) of Van Gogh’s Sunflowers: identification of areas with higher degradation risk. Angew Chem Int Ed. 2018;130:1–6.
23. Verita M, Basso R, Wypyski MT, Koestler RJ. X-ray microanalysis of ancient glassy materials: a comparative study of wavelength dispersive and energy dispersive techniques. Archaeometry. 1994;36:241.
24. Kuisma-Kursula P. Accuracy, precision and detection limits of SEM–WDS, SEM–EDS and PIXE in the multi-elemental analysis of medieval glass. X-Ray Spectrom. 2000;29:111–8.
25. Pawełkowicz S, Rohanová D, Svora P. Gothic green glazed tile from Malbork Castle: multi-analytical study. Herit Sci. 2017;5:27. https ://doi. org/10.1186/s4049 4-017-0141-6.
26. Molera J, Vendrell-Saz M. Chemical and textural characterization of tin glazes in Islamic ceramics from Eastern Spain. J Archaeol Sci. 2001;28:331–40.
27. Kaszowska Z, Malek K, Pańczyk M, Mikołajska A. A joint application of ATR-FTIR and SEM imaging with high spatial resolution: identification and distribution of painting materials and their degradation products in paint cross sections. Vib Spectrosc. 2013;65:1–11. https ://doi.org/10.1016/j. vibsp ec.2012.11.018.
28. Otero V. Historically accurate reconstructions of Amadeo’s chrome yel-lows: an integrated study of their manufacture and stability, Ph.D.-thesis, New University of Lisbon. 2018. http://hdl.handl e.net/10362 /59726 . 29. Otero V, Carlyle C, Vilarigues M, Melo MJ. Chrome yellow in nineteenth
century art: historic reconstructions of an artists’ pigment. RCS Adv. 2012;2:1798–805.
30. Monico L, Janssens K, Hendriks E, Vanmeert F, van der Snickt G, Cotte M, Falkenberg G, Brunetti BG, Miliani C. Evidence for degradation of the chrome yellows in Van Gogh’s sunflowers: a study using noninvasive in situ methods and synchrotron-radiation-based X-ray techniques. Angew Chem Int Ed. 2015;54:13923–7. https ://doi.org/10.1002/ ange.20150 5840.
31. Hendriks E, Geldof M, Monico L, Johnson DH, Miliani C, Romani A, Grazia C, Buti D, Brunetti BG, Janssens K, van der Snickt G, Vanmeert F. Methods and materials of the Amsterdam sunflowers. In: Hendriks E, Vellekoop M, editors. Van Gogh’s sunflower illuminated: art meets science. Amsterdam: Amsterdam University Press; 2019. p. 85–123.
32. Fiedler I, Hendriks E, Meedendorp T, Menu M, Salvant J. Van Gogh’s bed-rooms: materials, intention and evolution. In: Groom G, editor. Van Gogh’s bedrooms. Chicago: The Art Institute of Chicago; 2016. p. 72–6.
Publisher’s Note