INTRODUCTION
Belt conveyors in automated facilities, which are used in production lines, during sorting of postal items, or on airports, are specific and di -verse [1]. Reliable operation of these types of equipment is a key factor in the efficient opera -tion of company logistics [2]. Several ways of monitoring belt conveyors are described in the publications [3, 4]. Monitoring, from the point of view of its execution, is quite a difficult pro -cess. The difficulty lies in the need of monitoring several parameters which can be really compli-cated due to the length of the transport route and volume of the monitored data [5÷7]. The issues of online monitoring of belt conveyor were also described by Molnár et al. [8]. Within their re-search, benchmarking and evaluation standards, which support decision making processes in on-line monitoring, were considered.
Monitoring and evaluating operation modes are needed from the point of view of obtaining
device status information as well as predicting failures that may occur. Currently, the methods which can be used to monitor and diagnose con-veyor belts involve acoustic visualization. The advantage of these methods is the ability to moni-tor the devices remotely without any interference in them, sensor mounting, etc.
Before proposing technical measures to re-duce noise from machinery and equipment, it is necessary to know the frequency spectrum com-ponents of the sound. Currently, acoustic visu-alization techniques are clearly one of the ways to obtain relevant machines and equipment sta-tus data. Döbler and Heilmann [9] discussed the perspective of using acoustic cameras. Acoustic cameras that work on the Beamforming princi-ple, as well as concepts, techniques, and prob-lems associated with their use are described in works [10÷12].
Another important step for obtaining infor-mation from the data measured through acoustic cameras is the correct analysis of individual com-Volume 12, Issue 4, December 2018, pages 172–176
https://doi.org/10.12913/22998624/100348
Analysis and Classification of Noise Sources
of Conveyor Systems by Sound Visualizing
on the Postal Package Sorting Line
Pavol Liptai
1*, Ervin Lumnitzer
1, Marek Moravec
1, Miriama Piňosová
11 The Technical University of Košice, Faculty of Materials, Metallurgy and Recycling, Letná 9, Košice, Slovakia
* Corresponding author’s e-mail: [email protected]
ABSTRACT
Sound visualization tools are now widely used in industry. As a tool, acoustic cameras are also well- suited for
fast-er identification of fast-errors as well as individual states while opfast-erating devices. The aim of this papfast-er was to locate
and quantify noise sources on a packet sorting line using an acoustic camera and then to propose noise reduction measures. Localization of noise sources was performed by means of an acoustic camera with a microphone ring array. The result of these measurements and analyses was to sort the individual noise sources from less noisy to the noisiest, which gives a good assumption for better planning of spending on the implementation of noise reduction measures. The outputs of these measurements also give information on the character and frequency composition
of the sound of individual sources, which will help out in the design of specific noise measures.
Keywords: noise sources, sound visualization, noise location, conveyor systems.
Research Journal
Accepted: 2018.11.05ponents of mechanical and electrical equipment. Such analyses use the various approaches and methods discussed in the publications [13÷22].
MATERIALS AND METHODS
The workplace of the post where the mea-surements were carried out is aimed at sorting postal items. A specific description of the work -place is described in the article [23], which was mentioned in the previous issue of the journal and preceded this experiment. The acoustic camera which consists ring antenna with 48 microphones and camera was used for the realization of the measurements. This acoustic camera works on the beamforming principle, which is a signal pro-cessing technique used in sensor arrays for
direc-tional signal transmission or reception. The sim-plest beamforming architecture is described the Delay-Sum and is illustrated in Fig. 1. Measure-ment time record was set at 8 seconds. Data anal-ysis was realized with the NoiseImage program that is designed for processing of measured data. The outputs were generated as time sound record, spectrum, spectrogram, and sound images.
RESULTS AND DISCUSSION
The measured audio records of selected de-vices were corrected by the weighting filter A; fre -quency spectrum and acoustic images were sub-sequently generated in the NoiseImage software.
Fig. 2 shows the acoustic image of the sorting line scanner. Fig. 3 presents the A-weighted
fre-Fig. 1. Delay-Sum architecture [24]
Fig. 3. A-weighted frequency spectrum
Fig. 4. The acoustic image with localization of the prevailing sound source
quency spectrum. From the resulting frequency spectrum, the sound character of the recorded de-vice with its typical frequencies, namely 390 Hz, 530 Hz, and 660 Hz, can be seen.
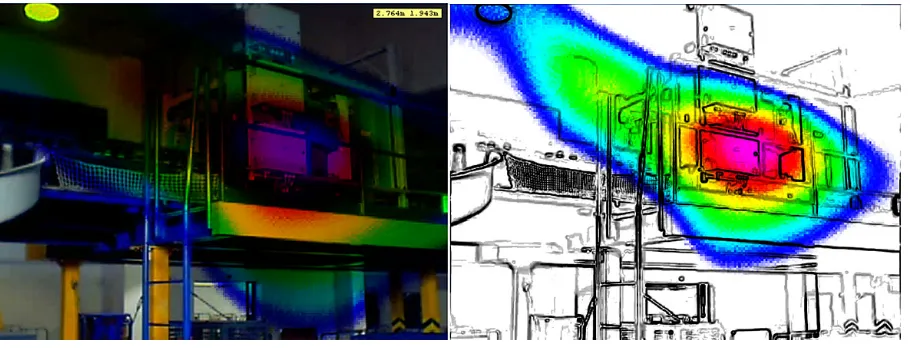
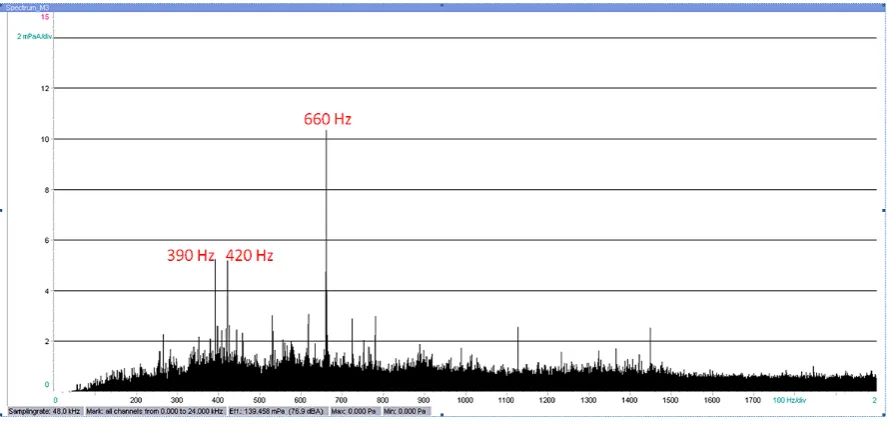
Fig. 4 shows the acoustic image of the emit-ting noise of an electric motor with chain drive which serves to drive the transport tubs of the sorting line. Fig. 5 presents the A-weighted fre-quency spectrum. From the resulting frefre-quency spectrum, the sound character of the recorded de-vice with its typical frequencies, namely 390 Hz, 420 Hz, and 660 Hz, can be seen.
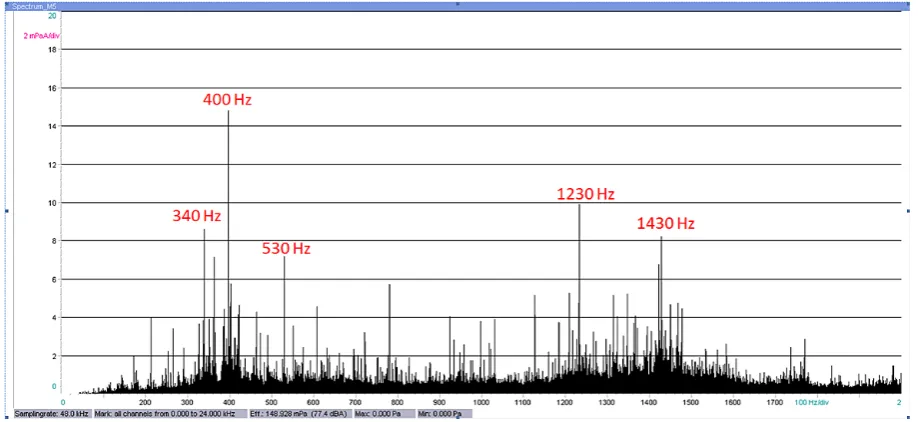
Fig. 6 depicts an acoustic image of the emit-ted noise by an electric motor with a wedge belt which serves to drive the conveyor belt of the sort-ing line. Fig. 7 shows the A-weighted frequency
spectrum. From the resulting frequency spectrum, the sound character of the recorded device with its typical frequencies, namely 340 Hz, 400 Hz, 530 Hz, 1230 Hz, and 1430 Hz, can be seen.
CONCLUSIONS
The presented work was focused on the solu-tion of noise sources in the working environment. From the point of view of reducing noise at the specific post workplace, it is necessary to focus mainly on the dominant sources of noise, in this case – the electric drives and their transmissions. Appropriate ways of reducing the noise levels in the workplace can be described as follows:
Fig. 6. The acoustic image with localization of the prevailing sound source
• targeted and repeated maintenance of the drive components,
• partial or full coverage of devices with access during repairs, maintenance, and revisions.
Other possibilities are to introduce regular vibroacoustic measurements in order to quickly identify the undesirable phenomena and machine and device failures, followed by a report on the status of the device. In addition, it is suitable for future planning of funds for the maintenance or replacement of machinery and device.
Acknowledgements
This paper was written in the frame of the work on the projects KEGA 032TUKE-4/2018 (100%).
REFERENCES
1. Mikusova N., Millo S. Modelling conveyor belt
pas-sage with a driving drum using finite element meth -ods. Adv Sci Technol Res J., 11(4), 2017, 239–246. 2. Surtees A.J. Conveyor system commissioning,
maintenance and failure analysis using black box techniques. Bulk Solids Handl., 16, 1996, 209–216. 3. Wang S., Guo W., Wen W., Chen R., Li T., Fang F.
Research on Belt Conveyor Monitoring and Control System. Inf. Comput. Appl. SE., 44, 2011, 334–339. 4. Lu Q., Wang X., Zhuang L. Research and Design
of Monitoring System for Belt Conveyor. Int. Conf. Comput. Sci. Serv. Syst., IEEE., 2012, 1943–1945. 5. Wang S., Guo W., Wen W. Based On the LM3S8962 MCU Belt Conveyor monitoring System. 2010 ETP/IITA Conf. Syst. Sci. Simul. Eng. (SSSE 2010), ETP-Engineering Technology Press, Kow-loon, 2010, 303–305.
6. Debski H., Teter A., Kubiak T., Samborski S. Lo-cal buckling, post-buckling and collapse of thin-walled channel section composite columns sub-jected to quasi-static compression. Compos Struct., 136, 2016, 593–601.
7. Garbacz T., Jachowicz T., Gajdoš I., Kijewski G.
Research on the influence of blowing agent on
selected properties of extruded cellular products. Adv Sci Technol Res J. 9(28), 2015, 81–88. 8. Molnár V., Fedorko G., Andrejiová M., Grinčová
A., Michalik P. Online monitoring of a pipe con-veyor. Part I: Measurement and analysis of selected operational parameters. Meas., J. Int. Meas. Con-fed., 94, 2016, 364–371.
9. Döbler D., Heilmann G. Perspectives of the Acous-tic Camera. In: Environmental Noise Control. The 2005 Congress and Exposition on Noise Control Engineering, 2015, 1–9.
10. Fischer S., Simmer K.U. Beamforming microphone arrays for speech acquisition in noisy environments. Speech Commun., 20(3–4), 1996, 215–227. 11. Johnson D.H., Dudgeon D.E. Array signal
process-ing: concepts and techniques. 1992, 533 p.
12. Gauthier P.A., Camier C., Pasco Y., Berry A., Chambatte E., Lapointe R. et al. Beamforming reg-ularization matrix and inverse problems applied to
sound field measurement and extrapolation using
microphone array. Journal of Sound and Vibration. 330, 2011, 5852–5877.
13. Urbanek J., Barszcz T., Zimroz R., Antoni J. Appli-cation of averaged instantaneous power spectrum for diagnostics of machinery operating under non-stationary operational conditions. Meas J Int Meas Confed., 45(7), 2012, 1782–1791.
14. Opocenska H., Hammer M. Use of technical diag-nostics in predictive maintenance. In: 17th Interna-tional Conference on Mechatronics - Mechatronika (ME). 2016, 1–6.
15. Dolnik B. Contribution to analysis of daily diagram of supply voltage in low voltage network: Working days versus non-working days. In: Proceedings of
the 2015 16th International Scientific Conference
on Electric Power Engineering. EPE 2015, VŠB-TU, 2015, 373–376.
16. Hunady R., Hagara M. A new procedure of modal pa-rameter estimation for high-speed digital image cor-relation. Mech Syst Signal Process., 93, 2017, 66–79. 17. Trebuna F., Hunady R., Bobovsky Z., Hagara M. Results and Experiences from the Application of Digital Image Correlation in Operational Modal Analysis. ACTA Polytech Hungarica., 10(5), 2013, 159–174.
18. Marton M., Ovsenik L., Huszanik T., Spes M.
Analysis of possibilities for measurement effect
of visibility in experimental FSO system. OPEN Comput Sci., 8(1), 2018, 135–141.
19. Ivaniga P., Ivaniga T. Comparison of DPSK and RZ-DPSK Modulations in Optical Channel with Speed of 10 Gbps. J Inf Organ Sci., 41(2), 2017, 185–196. 20. Grega R., Krajňák J., Žulová L. et al. Failure analy -sis of driveshaft of truck body caused by vibrations. Engineering Failure Analysis, 79, 2017, 208-215. 21. Nieszporek T., Boral P., Golebski R. An analysis of
gearing. 4th International Conference on Comput-ing and Solutions in ManufacturComput-ing EngineerComput-ing (CoSME), 94, 2017.
22. Golebski R., Ivandic Z. Analysis of Modification of Spur Gear Profile. Tehnicki Vjesnik-Technical
Gazette, 25(2), 2018, 643-648.
23. Piňosová M., Andrejiová M., Liptai P., Lumnitzer
E. Objective and subjective evaluation of the risk physical factors near to conveyor system. Adv Sci Technol Res J., 12(3), 2018.