INTRODUCTION
Lifting devices belong to the vertical trans-portation mechanisms. They are commonly used in almost all new multi-storey buildings. Despite a huge variety of available mechanisms all of them can be classified as per a couple of criteria. From the drive point of view there are lifts with the following drives:
• electrical drive (work is done by the gear), • hydraulic drive (work is done by the hydraulic
pump and the servo-motor), • other (screw propulsion).
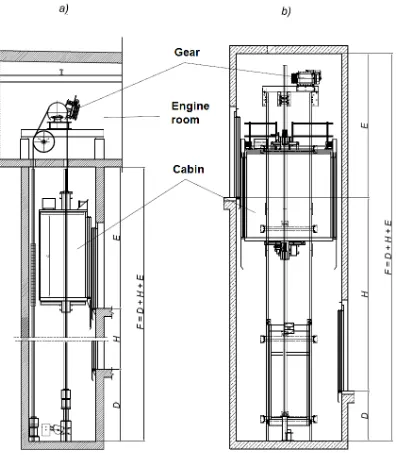
The lifts equipped with electrical drives where the drive units can be installed in a special techni-cal room professionally techni-called the engine room or directly in the shaft, must possess such a drive unit whose operation would not have the impact on deterioration of acoustic and vibration comfort both of the lift passengers and the occupants of the building where the lift is installed. Typical lift system is presented in the Fig. 1.
Mostly, the geared hoists are used in the lifts with the upper engine room. Nevertheless, the gearless hoists become very popular in the lifts without the engine room. Systems with the gear
are primarily effective in the medium height buildings for which the transportation speed is not a priority. The speed range of their move-ment is a couple of m/s at the most. Due to the gear the smaller and cheaper engines can be used. They ensure required torque at high speed. Un-fortunately, it is obtained at the expense of energy loss in the gear. The gear efficiency depends on its construction. Low efficiency, typically up to 70%, is specific to worm gears. Among others, it is influenced by the teeth inclination angle, the friction coefficient of material out of which they are made and the operation parameters. The lower the gear ratio and the higher its input speed are the bigger the efficiency is. However, the gears of that type are popular because they are silent and they absorb vibrations well. Worm gears rep-resent higher efficiency up to 90%. Unfortunately, they generate more noise and they are more ex-pensive. The energy loss in the gear is eliminated in the gearless drives whereas the requirements of cooling efficiency are lower. Generally, such systems are used in tall buildings as their speed range is typically from a couple of m/s to several m/s. Irrespective of the gear type each lift device must follow the standards referring to the noise both speaking about the lift mechanisms and the
DIAGNOSTICS OF THE PASSENGER LIFT GEAR
Kamil Szydło1, Rafał Longwic1
1 Lublin University of Technology, Department of Automotive Vehicles, 36 Nadbystrzycka St., 20-618 Lublin, Poland, e-mail: r.longwic@pollub.pl
Advances in Science and Technology Research Journal
Volume 12, Issue 1, March 2018, pages 26–35
DOI: 10.12913/22998624/76448 Research Article
ABSTRACT
The proposal of the diagnostics methodology for the passenger lift gear is presented in this article. The selected device is tested against the emitted volume of sound and vibrations observed in the regular operation (driving operation as per agreed test-ing sequence). Thermal images are prepared to catch incorrect operation of the gear mechanisms. On the basis of received measurements for the sound volume, accel-erations (vibrations), the analysis of vibrations frequency and thermal images, an at-tempt was made to diagnose the gear condition and to indicate possible reasons of the malfunctions condition.
Keywords: diagnostics, thermovision, noise, passenger lifts Received: 2017.05.10
Fig. 1. The simplified cross section of the passenger lift shaft: a) the system with the engine room, b) the system without the engine room.
residential buildings. Acceptable values of the noise level in the buildings and in the lift engine room as well as the general requirements on the protection against noise are determined in PN-87/B-02151–01/02 standard. The aspects regard -ing the analysis of vibroacoustic phenomena in lifting devices were partially touched in the avail-able literature. Mainly, it referred to:
• the volume of vibrations and noise coming from different lifting components such as the slides rollers [1, 3–4, 12–15];
• vibroinsulation methods for the lift doors power drive and the selection of vibroinsula-tion materials [9–10];
• measuring methods and reduction of acous-tic emission in the passenger lifts cabins [2, 5–8, 11].
The analysis of available literature gives the evidence on the lack of publications regarding the methods saying how to use vibroacoustic phe-nomena to evaluate technical condition of lifting devices. Herein, the technical condition is recog -nized as a set of parameters of the lift structure influencing the passengers’ comfort.
Advances in Science and Technology Research Journal Vol. 12 (1), 2018
the light of possibility to increase the construction noiselessness as well as to use them in the diag-nosis process focusing on the passengers’ comfort level monitoring.
EMPIRICAL TESTING
The subject of testing
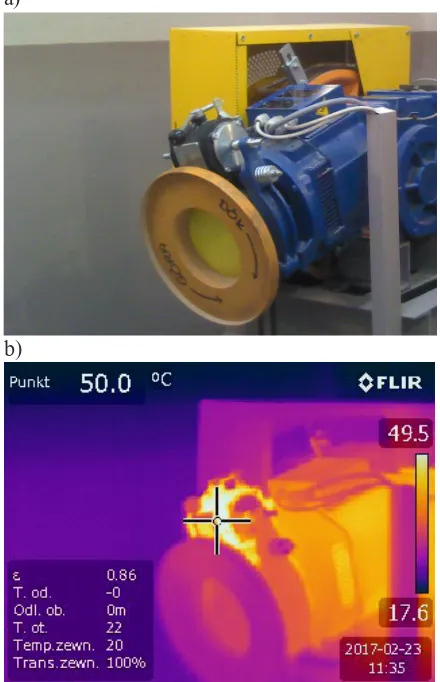
The geared gear is subject to the tests. It is installed in the residential building in Gdynia at Zbożowa Street. The mechanism parameters are presented in Table 1. The device view and the place of installation are presented in Fig. 2.
Measuring equipment
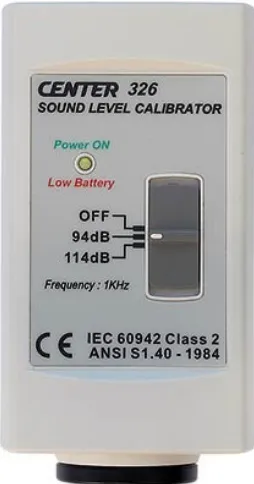
• Center 390 gauge is used to measure the level of sound volume. The measurement range is from 30 to 130 dB. The frequency of mea -sured signal is within the wave from 20 Hz to 8 kHz. The measurement accuracy is ±1,4 dB in the reference conditions when the level of sound intensity is 94 dB and the signal fre -quency equals 1 kHz. The measuring device is set at the averaging curve (SLOW) (it is prop-er when the avprop-erage level of sound emitted by source is to be measured). The measurements are done using A-weighting curve which re -flects specific features of the human ear to highest extent. Center 390 device appearance is presented in Fig. 3.
• Measurements of accelerations (vibrations) are done with Fast Tracer accelerometer by Sequoia company and dedicated FFT Analyz -er software. The application draws frequency courses from time perspective, it measures RMS values, acceleration, speed and displace-ments. Fast Tracer accelerometer is
present-ed in Fig.4. The basic data of the measuring gauge are:
− Configuration Triaxial accelerometer − Full scale ± 5 g
− Sensors Type MEMS
− Dynamic range 89 dB @ 10Hz − Bandwidth from DC to 1500 Hz − Resolution 1 mg @10Hz
− Shock: Up to 1000 g
− Sampling: 18432 sample/s; 12bit, − Dimensions: 30x55,5x15 mm, − Weight: 55g,
• Temperature is measured with a thermal-aging camera by Flir E50 company. The im-age obtained from the camera is presented in Fig. 5. The thermal-imaging camera allows to obtain temperature uniformity survey via a non-invasive test done from a certain distance. The test allows to read electromagnetic emis-sion of waves which are not visible to the na-ked eye in a range of spectral spectrum from 7.5 to 13μm. Graphic presentation of tempera -ture uniformity survey permits to detect even slight temperature changes in the places which are dangerous and unapproachable. From the received thermogram the actual temperature can be read for each point. It allows to perform detailed analysis of the saved thermal image.
Table 1. The tested object technical parameters.
Parameter Value
Producer Alberto Sassi
Type LEO 240095A
Device number 14A04697/A Diameter of the rope wheel [mm] 560
Rated current [A] 12
Rated torque [Nm] 30.6
Power [kW] 4.8
Speed [m/s] 1
Frequency [Hz] / [V] 50 / 400
Specification of Flir E50 camera is the following:
− Field of view (FOV) / Minimum focus dis-tance 25° × 19° / 0.4 m (1.31 ft.),
− Thermal sensitivity/NETD < 0.05°C @ +30°C (+86°F) / 50 mK,
− IR resolution 240 × 180 pixels,
− Object temperature range –20°C to +120°C (–4°F to +248°F) 0°C to +650°C (+32°F to +1202°F),
− MSX resolution 320 x 240 pixels,
− Image frequency 60 Hz , − Focus Manual,
− Spatial resolution (IFOV) 1.82 mrad, − Focal Plane Array (FPA) / Spectral range
Uncooled microbolometer / 7.5–13 µm.
Tests methodology
To ensure optimal conditions for measure-ments the lift mechanism is out of operation for the passengers. Once the measuring instruments
Advances in Science and Technology Research Journal Vol. 12 (1), 2018
are installed inside, the series of courses are per-formed. Tree times repetition of sequence is con-ducted – driving from the lowest stop to the high -est one and coming back to the low-est stop. The following parameters of the cabin acceleration in X, Y, Z axes are measured: the level of sound volume in the engine room as per A- weighting curve. Also, the photos of the gear with a thermal-imaging camera are taken.
Accelerations in X, Y, Z axes are measured with Sequoaia FastTracer device after its installa-tion (it is posiinstalla-tioned and leveled) on the gear body as presented in Fig. 2 and 6.
Sound volume is measured from the maxi-mum distance allowed by the lift engine room size and it is app. 3 meters from the sound source. It is reflected in Fig. 7.
Plan of tests
Tests of the body accelerations (vibrations), sound volume and the gear temperature are done to diagnose the reasons of excessive noise as per the lift passengers’ subjective opinion. The sound volume measurement is done to check if its level of intensity exceeds acceptable standards whereas the measurement of the body accelerations (vi-brations) and the gear temperature is conducted to identify possible design malfunctions that can impact the level of emitted sound volume. The measurements of accelerations and the sound vol-ume are conducted in parallel and repeated three times as per the sequence presented in Fig. 8.
ANALYSIS THE TESTS RESULTS
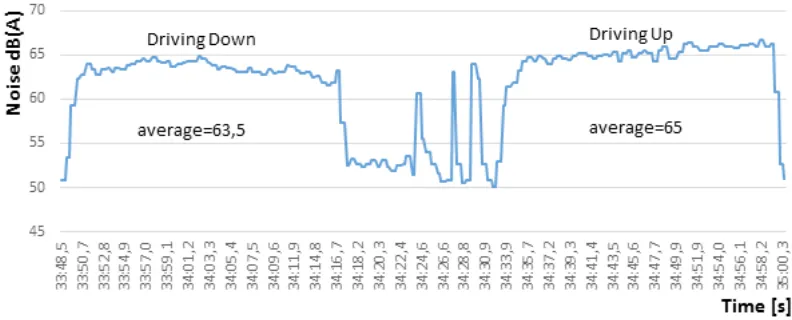
The sound volume measurements are re-corded in an engine room where the lift drive unit is installed and they are presented in Fig. 9 in a graphic way. Fig. 9 displays that when the cabin drives downwards, noticeably more silent opera-tion of the gear is observed (the value drops by 1.5 dB(A) in relation to the upwards movement). The louder operation of the gear when the cabin moves upwards can result from the fact that the counterweight, which is heavier than the empty cabin, “pulls downwards” so the gear and the
Fig. 5. Flir E50 thermal-imaging camera.
gear unit must re-brake the system. When the cabin drives downwards the heavier counter-weight is lifted as a result of which the features of operation for the machine and the gear are bet-ter. The graph also shows the moment when the system stops what results with the drop of sound volume. Peaks visible during the stop come from the operation of contractors in the control cabinet when resetting for the opposite direction (“upwards”) takes place.
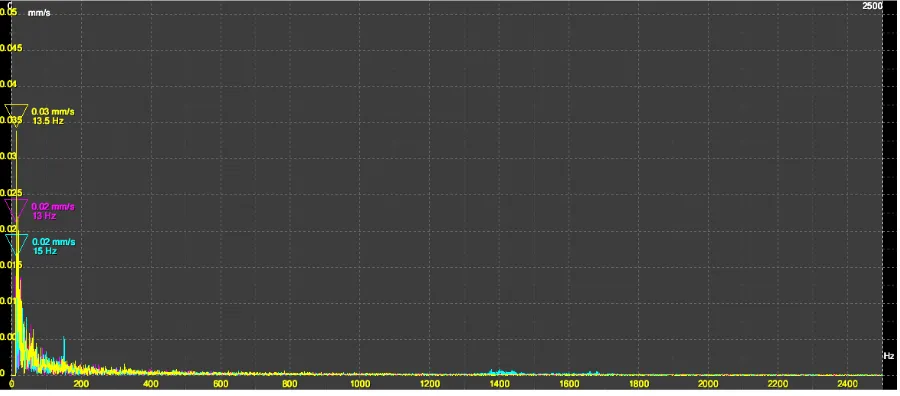
When analysing the results of obtained accel-erations presented in Fig. 10 and 11 it can be no-ticed that accelerations in Z axis in the movement downwards are slightly higher. It is a natural phe-nomenon connected with the fact that during the downwards movement of the cabin the gear must „pull” the counterweight upwards. The mass of counterweight when the cabin is empty is bigger than the frame mass with the cabin by 45%. FFT frequency analysis of displacements presented in Fig. 12, 13 as well as FFT frequency analysis of the speed presented in Fig. 14, 15 indicate that the gear and its bearings do not show any features of wear and tear which is proven by the lack of displacements at frequencies exceeding 100Hz.
It is confirmed by the test done with the ther -mal-imaging camera. The gear photos and their thermal images do not display any anomalies from the drive unit operation point of view. Ther-mal image of the gear body presented in Fig. 16 and recorded after app. 1800s of uninterrupted operation as well as the recorded maximum point of 37.4°C value indicate the normal temperature of the drive unit operation with oil lubrication applied [13]. Thermal photo clearly shows that the area around the bearing centers do not pos-sess temperature higher than the remaining parts of the body what additionally confirms the proper operation of those elements.
Fig. 7. Sound volume measured with Center 390
sonometer.
Fig. 9. Sound Emission of the gearbox in the engine room. Distance from the source – 3m. Fig. 8. Sequence of the rides during the
Advances in Science and Technology Research Journal Vol. 12 (1), 2018
Fig. 10. Axes&Modules driving down.
Fig. 11. Axes&Modules driving up.
Fig. 13. FFT displacement driving up.
Fig. 14. FFT velocity driving down.
Advances in Science and Technology Research Journal Vol. 12 (1), 2018
Thermal image of the gear brake and recorded 50°C temperature presented in Fig. 17 are also the example that the unit works properly – the raised temperature of the brake is a natural phenomenon taking place during its operation. The coil, re-sponsible for releasing the brake when the system
moves, is in the working position and it gets hot as it defeats the force of clamping springs. Ther-mal image of the gear encoder with 51°C temper-ature recorded is presented in Fig. 18. It is tem -perature higher than tem-perature typical to the regular encoder operation. While examining the encoder it is noticed that the encoder axis is not balanced. Also axial beating of the entire encoder is observed what probably can have the impact on its raised temperature.
CONCLUSIONS
The performed experimental tests provide the basis to draw the following final conclusions: • Technical condition assessment of the
passen-ger lift gear on the basis of amplitude and the character of vibrations is possible only when we possess a diagnostic model which is an im-age of the new device vibrations.
• The analysed gear is in mechanical working order and the excessive noise is not caused by the operation of mechanical system – the gear and its bearings do not indicate any signs of wear and tear what can be proven by the lack of displacements at frequency over 100Hz. Additionally, thermal analysis of the gear and temperature of the body not exceeding 40°C for which oil splash cooling is used confirm the proper work of the system.
• The gear brake and temperature exceeding 50°C presented in Fig. 17a give the evidence on its proper work – thermal energy generated during braking process is given back to the surroundings through the ribbed body of the brake.
a) b)
Fig. 16. Measurement of the gear body temperature: a) the body photo, b) thermal image of the body.
a)
b)
• High level of sound volume and audible low tones during the gear operation can come from the control system of the inverter gear – the encoder.
• Diagnostics of the passenger lift gear using the joined methods to measure the vibrations, sound volume and thermovision results with a complete image of the device technical con-dition and complement each other. It seems that diagnostics methodology of these types of mechanisms should be based on the above mentioned methods associated together.
REFERENCES
1. Burov A. A., Kosenko I. I., Troger H. On Peri -odic Motions of an Orbital Dumbbell-Shaped
Body with a Cabin-Elevator. Mechanics of Solids, 47( 3), 2012, 269–284.
2. Longwic R., Maciąg P., Szydło K. Methodology of
the noise emission measuring in the passenger lift
cabins. Logistics, 6, 2014, 6809–6817.
3. Lonkwic P., Szydło K., Molski Sz. The impact of
progressive gear geometry on the braking distance
length under changeable operating conditions. Ad -vances in Science and Technology Research
Jour-nal, 10(29), 2016, 161–167.
4. Lonkwic P. A mathematical model of CHP2000 type progressive gears. Advances in Science and Technology, 10 (32), 2016, 150–156.
5. Lonkwic P., Szydło K. Selected Parameters of the
Work of Speed Limiter Line Straining System in a
Frictional Lift. Advances in Science and Technol
-ogy, 8 (21), 2014, 73–77.
6. Lonkwic P., Szydło K., Longwic R, Maciąg
P. Method to limit the noise emission emitted
from thin-walled products. Logistics, 6, 2014, 6818–6827.
7. Lonkwic P., Szydło K. Reduction of the cabin
acoustic emission by the selection of an optimum
stiffening method for the cabin panels. Journal of Measurements in Engineering, 4(2), 2016, 95–102. 8. Lonkwic P., Szydło K., Molski Sz. Savitzky-Golay
method for the evaluation of deceleration of the
friction lift. Advances in Science and Technol
-ogy Research Journal, 11(1), 2017, 138–146 DOI: 10.12913/22998624/68459.
9. Polish Standard PN EN 81.1+A3, Safety Regula -tions Concerning the Structure and Installation of Lifts, Part I. Electric Lifts.
10. Rijanto E., Muramatsu T., Tagawa Y. Control of elevator having parametric vibration using LPV control method: Simulation study in the case of constant vertical velocity. Paper presented at the
IEEE Conference on Control Applications – Pro
-ceedings, 1, 1999, 527–532.
11. Shin B., Yoon S., Lee H. Koo, YS. Jeong Y. Kang
I. Mechanical Properties and Molecular Structure
of Rubber Materials with Different Hardnesses for Vibration Isolation of Elevator Cabins. Kore
-an Journal of Metals -and Materials, 51(10), 2013, 713–718.
12. Sound Intensity Software BZ 7205 Technical Doc
-umentation, Bruel&Kjaer Sound & Vibration Mea
-surement A/S 1997.
13. Szydło K., Maciąg P. Longwic R. Lotko M. Analy -sis of vibroacoustic signals recorded in the
passen-ger lift cabin. Advances in Science and Technol
-ogy Research Journal, 10(30), 2016, 193–201. 14. Szydło K., Longwic R., Maciąg P. Analysis of the
noise emission sources recorded in the passenger lift cabin. Rail Transportation Technique, 12, 2015,
2154–2158.
15. Zdziennicka A., Szymczyk K., Jańczuk B., Long
-wic R, Sander P. Adhesion of canola and diesel oils
to some parts of diesel engine in the light of sur-face tension components and parameters of these substrates. International Journal of adhesion and
adhesives, 60, 2015, 23–30.
a) b)