R E S E A R C H
Open Access
Query-by-Example Spoken Term Detection
ALBAYZIN 2012 evaluation: overview, systems,
results, and discussion
Javier Tejedor
1*, Doroteo T Toledano
2, Xavier Anguera
3, Amparo Varona
4, Lluís F Hurtado
5,
Antonio Miguel
6and José Colás
1Abstract
Query-by-Example Spoken Term Detection (QbE STD) aims at retrieving data from a speech data repository given an acoustic query containing the term of interest as input. Nowadays, it has been receiving much interest due to the high volume of information stored in audio or audiovisual format. QbE STD differs from automatic speech recognition (ASR) and keyword spotting (KWS)/spoken term detection (STD) since ASR is interested in all the terms/words that appear in the speech signal and KWS/STD relies on a textual transcription of the search term to retrieve the speech data. This paper presents the systems submitted to the ALBAYZIN 2012 QbE STD evaluation held as a part of ALBAYZIN 2012 evaluation campaign within the context of the IberSPEECH 2012 Conferencea. The evaluation consists of retrieving the speech files that contain the input queries, indicating their start and end timestamps within the appropriate speech file. Evaluation is conducted on a Spanish spontaneous speech database containing a set of talks from MAVIR workshopsb, which amount at about 7 h of speech in total. We present the database metric systems submitted along with all results and some discussion. Four different research groups took part in the evaluation. Evaluation results show the difficulty of this task and the limited performance indicates there is still a lot of room for improvement. The best result is achieved by a dynamic time warping-based search over Gaussian posteriorgrams/posterior phoneme probabilities. This paper also compares the systems aiming at establishing the best technique dealing with that difficult task and looking for defining promising directions for this relatively novel task.
Keywords: Query-by-example; Spoken term detection; International evaluation; Search on spontaneous speech
Introduction
The ever-increasing volume of heterogeneous speech data stored in audio and audiovisual repositories promotes the development of efficient methods for retrieving the stored information. Much work has addressed this issue by means of spoken document retrieval (SDR), keyword spotting, spoken term detection (STD), query-by-example (QbE) or spoken query approaches.
Spoken term detection aims at finding individual words or sequences of words within audio archives. Therefore, it relies on a text-based input, commonly the phone
*Correspondence: [email protected]
1Human Computer Technology Laboratory (HCTLab), Universidad Autónoma de Madrid, Madrid 28049, Spain
Full list of author information is available at the end of the article
transcription of the search term. STD systems are typi-cally composed of three different stages: first, the audio is decoded in terms of word/sub-word lattices from an automatic speech recognition subsystem. Next, a term detection subsystem employs the phone transcription cor-responding to the search term to find the term within those word/sub-word lattices and hence to hypothe-size detections. And finally, confidence measures can be applied to output reliable detections.
Query-by-example can be defined as ‘a method of searching for an example of an object or a part of it in other objects’. QbE has been widely used in audio applica-tions like sound classification [1-3], music retrieval [4,5], and spoken document retrieval [6]. In QbE STD, we con-sider the scenario where the user has found some inter-esting data within a speech data repository (for example,
by random browsing or some other method). His/her pur-pose is to find similar data within the repository. In doing so, the user selects one or several speech cuts containing the term of interest (henceforth, query) and the system outputs him/her other putative hits from the repository (henceforth, utterances). Another scenario for QbE STD considers one or several user speech recordings of the term of interest. Therefore, QbE STD differs from the STD defined previously, the so-calledtext-based STD, in that the former uses an acoustic query as input, instead of a text-based representation of the term. This, on one hand, offers a big advantage for devices without text-based capabilities, which can be effectively used under the QbE STD paradigm. On the other hand, QbE STD can be also employed for building language-independent STD sys-tems [7,8], which is mandatory when no or very limited training data are available to build a reliable speech recog-nition system, sincea priori knowledge of the language involved in the speech data is not necessary.
QbE STD has been addressed in the literature from two different points of view:
1. Methods based on phonetic transcription of the query speech signal [7,9-17], for which the text-based STD technology can be next applied. Therefore, these methods decode the query with an automatic speech recognizer to get its word/sub-word representation which can be next employed to hypothesize detections in a text-based STD-like system.
2. Methods based on the template matching of features extracted from the query/utterance speech signal [7,8,17-29]. They usually borrow the idea from dynamic time warping (DTW)-based speech recognition and were found to outperform phonetic transcription-based techniques on QbE STD [18].
Given the high amount of information stored in speech format, automatic systems that are able to provide access to this content are necessary. In this direction, several evaluations including SDR, STD, and QbE STD have been proposed recently [30-36]. Taking into account the increasing interest in the QbE STD evaluation around the world, we organized an international evaluation of QbE STD in the context of ALBAYZIN 2012 evalua-tion campaign. This campaign is an internaevalua-tionally open set of evaluations supported by the Spanish Network of Speech Technologies (RTTHc) and the ISCA Special
Interest Group on Iberian Languages (SIG-IL) every 2 years from 2006. The evaluation campaigns provide an objective mechanism to compare different systems and to promote research on different speech technologies such as speech segmentation [37], speaker diarization [38], language recognition [39], and speech synthesis [40] in the ALBAYZIN 2010 evaluation campaign. This year,
this campaign has been held during the IberSPEECH 2012 Conferenced, which integrated the ‘VII Jornadas
en Tecnología del Habla’ and the ‘III Iberian SLTech Workshop’.
The rest of the paper is organized as follows: the next section presents the QbE STD evaluation that includes an evaluation description, the metric used, the database released for experimentation, a comparison with previous evaluations, and the participants involved in the evalu-ation. Next, we present the different systems submitted to the evaluation. Results along with some discussion are presented in Section ‘Results and discussion’ and the work is concluded in the last section.
Query-by-Example Spoken Term Detection evaluation
Evaluation description and metric
This evaluation involves searching for audio content withinaudio contentusingan audio content query. There-fore, this is suitable for groups working on speech index-ing and retrieval and on speech recognition as well. In other words, this task focuses on retrieving the appro-priate audio files, with the occurrences and timestamps, which contain any of those queries. Therefore, the input to the system is an acoustic example per query, and hence prior knowledge of the correct word/phone transcription corresponding to each query cannot be used.
Participants could submit a primary system and up to two contrastive systems. No manual intervention is allowed for each system developed to generate the final output file and hence, all the developed systems must be fully automatic. Listening to the test data, or any other human interaction with the test data, is forbidden before all the results have been submitted. The standard XML-based format corresponding to the NIST STD 2006 eval-uation [31] has been used for building the system output file.
In QbE STD, a hypothesized occurrence is called a detection; if the detection corresponds to an actual occur-rence, it is called ahit, otherwise it is afalse alarm(FA). If an actual occurrence is not detected, this is called a miss. The actual term weighted value (ATWV) [31] has been used as metric for the evaluation. This integrates the hit rate and false alarm rate of each query term into a single metric and then averages over all search query terms:
ATWV= 1 ||
K∈
NhitK NtrueK −β
NFAK T−NtrueK
(1)
of query termK, andNtrueK is the number of actual occur-rences ofK in the audio.T denotes the audio length in seconds, andβis a weight factor set to 999.9 [41].
ATWV represents the term weighted value (TWV) for the threshold set by the QbE STD system (usually tuned on development data). An additional metric, called maxi-mum term weighted value (MTWV) [31], can be also used to evaluate the performance of the QbE STD system. This MTWV is the maximum TWV achieved by a given QbE STD system and does not depend on the tuned threshold. Although it was not used for the evaluation, results based on this metric are also presented to evaluate the threshold selection in the submitted systems.
In addition to ATWV and MTWV, NIST also proposed a detection error tradeoff (DET) curve [42] to evaluate the performance of the QbE STD system working at various miss/FA ratios. Although DET curves were not used for the evaluation itself either, they are also presented in this paper for system comparison.
Database
The database used for the evaluation consists of a set of talks extracted from the Spanish MAVIR workshopse held in 2006, 2007, and 2008 (Corpus MAVIR 2006, 2007, and 2008) corresponding to Spanish language that con-tain speakers from Spain and South America (henceforth MAVIR database).
This MAVIR database includes ten spontaneous speech files, each containing different speakers, which amount at about 7 h of speech and are further divided into train-ing/development and test sets. There are 20 male and 3 female speakers in the database. The data were also manually annotated in an orthographic form, but times-tamps were set only for phrase boundaries. To prepare the data for the evaluation, we manually added the times-tamps for the roughly 2, 000 occurrences used in the training/development and test parts of the database.
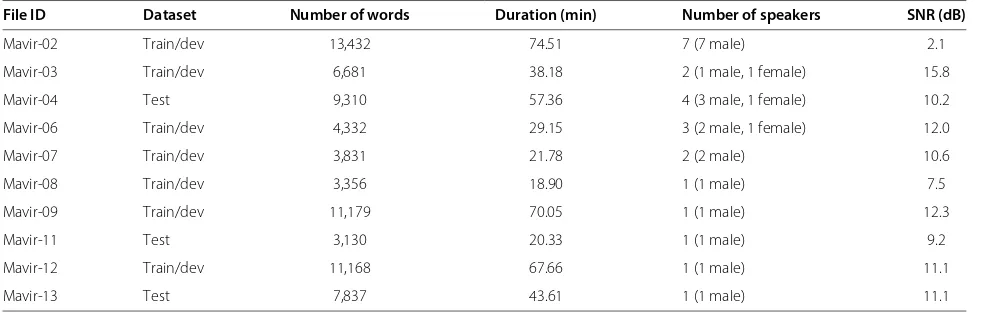
The speech data were originally recorded in several audio formats [pulse-code modulation (PCM) mono and stereo, MP3, 22.05 kHz, 48 kHz, etc.]. All data were converted to PCM, 16 kHz, single channel, and 16 bits per sample using Sox toolf in order to unify the for-mat for the participants. Recordings were made with the same equipment, a digital TASCAM DAT model DA-P1 (TEAC Corporation, Tokyo, Japan), except for one record-ing. Different microphones were used for the different recordings. Most of them were tabletop or floor stand-ing microphones, but in one case a lavalier microphone was used. The distance from the mouth of the speaker to the microphone varies and was not particularly con-trolled, but in most cases the distance was smaller than 50 cm. All the speech contains real and spontaneous speech of MAVIR workshops in real setting. Thus, the recordings were made in large conference rooms with capacity for over a hundred people and a large amount of people in the conference room. This poses additional chal-lenges including background noise (particularly babble noise) and reverberation. The realistic settings and the dif-ferent nature of the spontaneous speech in this database make it appealing and challenging enough for our evalua-tion and definitely for further work. Table 1 includes some database features, such as the number of words, dura-tion, and signal-to-noise ratio (SNR) [43] of each speech file.
Training/development data amount at about 5 h of speech extracted from seven out of ten speech files of the MAVIR database and contained 15 male and 2 female speakers. However, there is no constraint in the amount of training/development data beyond the MAVIR cor-pus that can be employed to build the systems. The training/development list consists of 60 queries, which were chosen based on their occurrence rate in the train-ing/development speech data. Each query is composed of a single word whose length varies between 7 and 16 single
Table 1 MAVIR database characteristics
File ID Dataset Number of words Duration (min) Number of speakers SNR (dB)
Mavir-02 Train/dev 13,432 74.51 7 (7 male) 2.1
Mavir-03 Train/dev 6,681 38.18 2 (1 male, 1 female) 15.8
Mavir-04 Test 9,310 57.36 4 (3 male, 1 female) 10.2
Mavir-06 Train/dev 4,332 29.15 3 (2 male, 1 female) 12.0
Mavir-07 Train/dev 3,831 21.78 2 (2 male) 10.6
Mavir-08 Train/dev 3,356 18.90 1 (1 male) 7.5
Mavir-09 Train/dev 11,179 70.05 1 (1 male) 12.3
Mavir-11 Test 3,130 20.33 1 (1 male) 9.2
Mavir-12 Train/dev 11,168 67.66 1 (1 male) 11.1
Mavir-13 Test 7,837 43.61 1 (1 male) 11.1
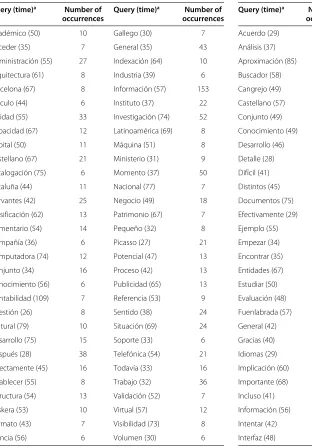
graphemes. Ground truth labels and evaluation tools were provided to the participants by the date of the release. There are 1, 027 occurrences of those queries in the training/development data. Table 2 includes information related to the training/development queries.
Test data amount at about 2 h of speech extracted from the other three speech files not used as train-ing/development data and contained five male and one female speakers. The test list consists of 60 queries, which were chosen based on their occurrence rate in the test speech data. Each query is composed of a single word whose length varies between 7 and 16 single graphemes.
Table 2 Training/development queries with the time length per query and number of occurrences in training/development data
Query (time)a Number of Query (time)a Number of
occurrences occurrences
Académico (50) 10 Gallego (30) 7
Acceder (35) 7 General (35) 43
Administración (55) 27 Indexación (64) 10
Arquitectura (61) 8 Industria (39) 6
Barcelona (67) 8 Información (57) 153
Cálculo (44) 6 Instituto (37) 22
Calidad (55) 33 Investigación (74) 52
Capacidad (67) 12 Latinoamérica (69) 8
Capital (50) 11 Máquina (51) 8
Castellano (67) 21 Ministerio (31) 9
Catalogación (75) 6 Momento (37) 50
Cataluña (44) 11 Nacional (77) 7
Cervantes (42) 25 Negocio (49) 18
Clasificación (62) 13 Patrimonio (67) 7
Comentario (54) 14 Pequeño (32) 8
Compañía (36) 6 Picasso (27) 21
Computadora (74) 12 Potencial (47) 13
Conjunto (34) 16 Proceso (42) 13
Conocimiento (56) 6 Publicidad (65) 13
Contabilidad (109) 7 Referencia (53) 9
Cuestión (26) 8 Sentido (38) 24
Cultural (79) 10 Situación (69) 24
Desarrollo (75) 15 Soporte (33) 6
Después (28) 38 Telefónica (54) 21
Directamente (45) 16 Todavía (33) 16
Establecer (55) 8 Trabajo (32) 36
Estructura (54) 13 Validación (52) 7
Euskera (53) 10 Virtual (57) 12
Formato (43) 7 Visibilidad (73) 8
Francia (56) 6 Volumen (30) 6
aIn hundredth of seconds.
No ground truth labels corresponding to the test data were given to the participants until all the systems were submitted to the evaluation. There are 892 occurrences of those queries in the test data. Table 3 includes information related to the test queries.
Comparison to other evaluations
In the last years, several evaluations in the field of spo-ken term detection have taspo-ken place. In this section, we review the former evaluations mainly to highlight the differences with the evaluation presented in this article.
Table 3 Test queries with the time length per query and number of occurrences in test data
Query (time)a Number of Query (time)a Number of
occurrences occurrences
Acuerdo (29) 7 Lenguaje (39) 6
Análisis (37) 18 Mecanismo (47) 7
Aproximación (85) 7 Metodología (81) 10
Buscador (58) 7 Motores (34) 6
Cangrejo (49) 7 Necesario (65) 6
Castellano (57) 9 Normalmente (32) 6
Conjunto (49) 7 Obtener (38) 9
Conocimiento (49) 6 Orientación (60) 6
Desarrollo (46) 6 Parecido (40) 6
Detalle (28) 7 Personas (54) 6
Difícil (41) 12 Perspectiva (49) 7
Distintos (45) 21 Porcentaje (66) 8
Documentos (75) 7 Precisamente (68) 6
Efectivamente (29) 10 Presentación (58) 15
Ejemplo (55) 54 Primera (29) 19
Empezar (34) 7 Principio (48) 9
Encontrar (35) 19 Propuesta (44) 19
Entidades (67) 28 Realidad (27) 10
Estudiar (50) 7 Reconocimiento (66) 6
Evaluación (48) 15 Recurso (52) 7
Fuenlabrada (57) 15 Referencia (47) 13
General (42) 11 Resolver (42) 6
Gracias (40) 13 Segunda (52) 8
Idiomas (29) 27 Seguridad (35) 6
Implicación (60) 31 Siguiente (37) 11
Importante (68) 19 Simplemente (65) 8
Incluso (41) 12 También (24) 93
Información (56) 92 Textual (59) 15
Intentar (42) 13 Trabajar (38) 39
Interfaz (48) 10 Utilizar (50) 15
The most similar evaluations to our evaluation are the MediaEval 2011 and 2012 Search on Speech evaluations [33,34]. The task of MediaEval and our evaluation is the same: a Query-by-Example Spoken Term Detection eval-uation in which participants search for audio content within audio content using an audio content query. How-ever, our evaluation differs from MediaEval evaluations in different ways.
The most important difference is the nature of the audio content used for the evaluation. In MediaEval evalua-tions all speech is telephone speech, either conversational or read and elicited speech. In our evaluation, the audio contains microphone recordings of real talks in real work-shops, on large conference rooms with public. Micro-phones, conference rooms, and even recording conditions change from one recording to another. Microphones are not close-talking microphones but mainly tabletop and ground standing microphones. This difference in the eval-uation conditions makes our evaleval-uation to pose differ-ent challenges, and makes it difficult to compare the results obtained in our evaluation to previous MediaEval evaluations.
The evaluation presented here is, to the best of our knowledge, the first QbE STD evaluation that deals with Spanish language. This makes our evaluation different in another way to MediaEval 2011 and 2012 evaluations, which dealt with Indian and African languages. In addi-tion, participants of our evaluation could make use of the language knowledge (i.e., Spanish) when building their system/s.
Besides the MediaEval Search on Speech Evaluations, the National Institute of Standards and Technology (NIST) of the USA organized in 2006 the NIST STD evalu-ation [31]. In this case, the evaluevalu-ation proposed a different task: searching spoken terms using a textual query com-posed of one or several words. The data contained speech on English, Mandarin Chinese, and Modern Standard and Levantine Arabic. Again, none of these languages was Spanish. In this case, the nature of the speech included conversational telephone speech (CTS), broadcast news (BNews) speech, and speech recorded in roundtable meet-ing rooms (RTMeet) with distantly placed microphones (this last type is used only for English). Of the three dif-ferent types of speech, the last one is more similar to the nature of the speech in our evaluation, although there are still differences as to the size of the room, larger in our case, which is very important for reverberation; also the use of amplification of the audio in the conference rooms is not present in the case of a roundtable meeting.
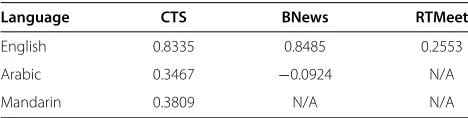
The NIST STD 2006 evaluation results are publicly availablegand are a very interesting result to analyze the influence of the language and the nature of speech on STD results. Table 4 presents the best results obtained for each condition by the teams participating in the evaluation.
Table 4 Best performance obtained by different
participants of the NIST STD 2006 evaluation in different conditions
Language CTS BNews RTMeet
English 0.8335 0.8485 0.2553
Arabic 0.3467 −0.0924 N/A
Mandarin 0.3809 N/A N/A
Best performance (in terms of actual term weighted value, ATWV) obtained by the different participants of the NIST STD 2006 evaluation in the different conditions. CTS, conversational telephone speech; BNnews, broadcast news; RTMeet, speech recorded in roundtable meeting rooms; N/A, not applicable.
With respect to the type of speech, it is clear from Table 4 that results using microphone speech, particu-larly distant microphones, in less controlled settings than audiovisual studios (such as in broadcast news) or close-talking conversational telephone data are definitely much more limited. Taking this into account and the very chal-lenging nature of the database used in our evaluation, per-haps even more challenging than the roundtable meeting recordings used in NIST STD 2006 evaluation, we should not expect a very high performance in our evaluation.
With respect to the language, English is the language with more resources and for which more research has been done. When applying the similar technology to lan-guages with fewer resources or for which less specific research has been devoted, performance decreases are observed. In the case of the NIST STD 2006 evaluation, very important performance decreases are observed when moving from English to other languages. In the case of our evaluation, we should not expect important decreases due to the use of Spanish since we are conducting a query-by-example evaluation in which language resources are less important and the technology is relatively more language independent. However, we will probably lose some perfor-mance due to using a query-by-example setting. In fact, we see that this happens in the particular setting of our evaluation by comparing results of the query-by-example systems with the performance obtained by a text-based spoken term detection system that is more compara-ble to the systems participating in the NIST STD 2006 evaluation.
Finally, NIST has recently conducted a new evaluation called NIST Open Keyword Search evaluation [36] that is very similar to the former NIST STD 2006 evaluation. This new evaluation was only conducted on CTS data on a surprise language that was announced only 4 weeks before the evaluation. At the time of writing this article, there are no publicly available results of this evaluation.
Participants
2012 Query-by-Example Spoken Term Detection eval-uation. In addition, one additional research group sub-mitted a system (named text-based STD system in this paper) that is capable of text-based STD. This system will be used in this paper as a reliable baseline to be com-pared with the systems submitted to the main QbE STD evaluation. Participants are listed in Table 5. About 3 months were given to the participants for system design-ing. Training/development data were released at the end of June 2012; test data were released at the beginning of September 2012; and the final system submission was due at the end of September 2012.
Systems
In this section, the systems that are submitted for the evaluation are described. The systems appear in the same order that they are ranked in Tables 6 and 7. A full descrip-tion of the systems can be found in IberSPEECH 2012 online conference proceedings [44].
System 1
The system is based on a DTW zero-resource match-ing approach. The system architecture is depicted in Figure 1. First, acoustic features (13 Mel frequency cep-stral coefficients (MFCCs) along with their first and sec-ond derivatives) were extracted from the speech signal for each frame. To solve the speaker-dependent issue that these features suffer from [8], these MFCC features are used to train a posterior Gaussian Mixture Model (GMM). This GMM is trained from a combination of expectation-maximization andK-means algorithms aim-ing at maximizaim-ing the discovery and separation of auto-matically derived acoustic regions in the speech signal, as described in [45]. Finally, Gaussian posteriorgram fea-tures are extracted from this model as final feafea-tures. Next, a GMM-based speech/silence detector is applied to fil-ter out non-speech segments. The resulting features (i.e., those corresponding to speech segments) are next sent to the subsequence-DTW (SDTW) [46] matching algo-rithm, which hypothesizes query detections within the utterances. The minus logarithm of the cosine distance has been employed as similarity measure between each query frame and each utterance frame. This SDTW algo-rithm allows any query to appear at any time within the
Table 5 Participants in the Query-by-Example Spoken Term Detection ALBAYZIN 2012 evaluation
Team ID Research institution
TID Telefonica Research, Barcelona, Spain
GTTS University of the Basque Country, Bilbao, Spain
ELiRF Politechnical University of Valencia, Spain
VivoLab University of Zaragoza, Spain
Table 6 Results of the QbE STD ALBAYZIN 2012 evaluation on training/development data
System ID MTWV ATWV p(FA) p(miss)
System 1 0.0455 0.0455 0.00002 0.930
System 2a 0.0128 0.0128 0.00000 0.986
System 2b 0.0092 0.0092 0.00000 0.990
System 3a 0.0000 −1.6144 0.00000 1.000
System 3b (late submission) 0.0000 0.0000 0.00000 1.000
System 4a 0.0000 −0.1490 0.00000 1.000
System 4b (late submission) 0.0612 0.0612 0.00005 0.893
Text-based STD system 0.1134 0.1134 0.00003 0.855
Systems 1 to 4 are on QbE STD and text-based STD system is on STD.
utterance. After the matching algorithm returns all pos-sible detections and their scores, an overlap detection algorithm is executed where all those matches that overlap with each other more than 50% of the detection time are post-processed by keeping the detection with the highest score (i.e., the lowest distance) in the output file along with the non-overlapped detections. It must be noted that this system can be considered language independent, since it does not make use of the target language and can be effectively used for building language-independent STD systems. A full system description can be found in [47].
System 2
This system looks for an exact match of the phone sequence output by a speech recognition process given a spoken query, within the phone lattices corresponding to the utterances. Brno University of Technology phone decoders for Czech, Hungarian, and Russian have been employed [48]. In this way, this system does not make use of prior knowledge of the target language (i.e., Spanish) and hence, as the previous system, is language indepen-dent and suitable for building a language-indepenindepen-dent STD system.
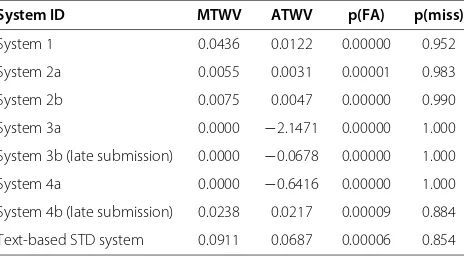
Table 7 Results of the QbE STD ALBAYZIN 2012 evaluation on test data
System ID MTWV ATWV p(FA) p(miss)
System 1 0.0436 0.0122 0.00000 0.952
System 2a 0.0055 0.0031 0.00001 0.983
System 2b 0.0075 0.0047 0.00000 0.990
System 3a 0.0000 −2.1471 0.00000 1.000
System 3b (late submission) 0.0000 −0.0678 0.00000 1.000
System 4a 0.0000 −0.6416 0.00000 1.000
System 4b (late submission) 0.0238 0.0217 0.00009 0.884
Text-based STD system 0.0911 0.0687 0.00006 0.854
Figure 1Architecture of system 1.Blocks of the system 1 architecture. DTW, dynamic time warping.
The system, whose architecture is depicted in Figure 2, integrates different stages as follows: first, Czech, Hungarian, and Russian phone decoders have been used to produce phone lattices both for queries and utterances. Then, the phone transcription corresponding to each query is extracted from the phone lattice by taking the highest likelihood phone sequence using thelattice tool of SRILM [49]. Next, Lattice2Multigram tool [50-52]h has been used to hypothesize detections that perform an exact match of the phone transcription of each query within each utterance. In this way, three different output files that contain the detections from each phone decoder are obtained. The score given by theLattice2Multigram tool for each detection is normalized by the length of the detection (in number of frames) and by all the detections found within the phone lattices except the current one. Overlapped detections that are hypothe-sized by two or more phone decoders are merged so that the most likely detection (i.e., the one with the highest score) remains along with the non-overlapped detections. As a post-process, just the best K hypothesis for each utterance is kept in the final output file.K was set to 50 which got the best performance on training/development data. The full system description can be found in [53].
Two different configurations for this system were sub-mitted. The first one, referred as system 2a, combines the detections from the Hungarian and Russian phone decoders, since they got the best performance in the train-ing/development data. The second one, referred as system 2b, merges the detections from all the phone decoders (i.e., Czech, Hungarian, and Russian) in the final output file.
System 3
The system, whose architecture is presented in Figure 3, is based on a search on phoneme lattices generated from a posteriori phoneme probabilities. This is composed of different stages as follows: first, these probabilities are obtained by combining the acoustic class probabilities estimated from a clustering procedure on the acoustic
space and the conditional probabilities of each acoustic class with respect to each phonetic unit [54]. The clus-tering makes use of standard GMM distributions for each acoustic class, which are estimated from the unsupervised way of the Maximum Likelihood Estimation procedure. The conditional probabilities are obtained from a coarse segmentation procedure [55]. An acoustic class repre-sents a phone in the target language (i.e., Spanish) and hence this system employs the knowledge of the tar-get language. Second, the phoneme lattices are obtained for each query and utterance from an ASR process that takes as input the phoneme probabilities computed in the previous stage. This ASR process examines if each vector of phoneme probabilities contains probabilities for each phoneme above a predefined detection threshold (tuned on training/development data) to output a spe-cific phoneme for each frame. Start and end time marks for each phoneme are assigned from backward/forward procedures that mark frames before/after the current one with a probability for that phoneme higher than an exten-sion threshold (tuned on training/development data as well) stopping when the probability is lower than this threshold to assign the corresponding start and end times-tamps. The accumulated frame phoneme probability is used as score for each phoneme in the lattice. In the third step, a search of every path in the lattice corresponding to the query within the phoneme lattice corresponding to the utterance is conducted to hypothesize detections. Substitution, deletion, and insertion errors in those query lattice paths are allowed when hypothesizing detections. The score for each detection is computed by accumulat-ing the individual score for each phoneme both in the query and the utterance lattice paths. Overlapped detec-tions are discarded in the final output file by keeping the best, and detections with a score lower than a prede-fined threshold (tuned on the training/development data) are also filtered out the final output. This threshold is query dependent since a query detection is considered a hit if its score is lower than the mean of all scores of this query minus the standard deviation of these scores computed from all occurrences of the detected query in
Figure 3Architecture of system 3.Blocks of the system 3 architecture. ASR, automatic speech recognition.
all speech files. The full system description can be found in [56].
Two different configurations were submitted. The first one, referred as system 3a, tuned all the thresholds so that at least 6% of hits on training/development data are pro-duced. The second one, referred as system 3b, is alate sub-missionand tuned the thresholds for ATWV performance. This second configuration allows a fair comparison with the rest of the systems submitted.
System 4
This system employs the same phoneme probabilities used in the first stage to build system 3 as query/utterance representation and hence it makes use of the target lan-guage. The system architecture is shown in Figure 4. To hypothesize detections, a segmental DTW search [57] is conducted with the Kullback-Leibler (KL) divergence as similarity measure between each query frame and each utterance frame. The Segmental DTW algorithm allows any query to appear at any point within the utterance. Overlapped detections found by the segmental DTW search and detections with a score lower than a predefined threshold (tuned on the training/development data) are filtered out the final output. As in system 3, this threshold is query dependent, and a query detection is considered a hit if its score is lower than the mean of all the scores of this query minus the standard deviation of these scores computed from all the occurrences of the detected query in all speech files. The full system description can be found in [56].
As in the previous system, two different configura-tions were submitted. The first one, referred as system 4a, optimizes the system so that at least 10% of hits on training/development data are produced. The second one, referred as system 4b, is a late submission, optimizes the system according to ATWV metric and hence only allows a query to have at most two detections in all the speech files. This system optimization towards the ATWV met-ric allows a fair comparison with the rest of the systems submitted.
Text-based Spoken Term Detection system
For comparison with the systems presented before, we present a system that can conduct STD which employs the phone transcription corresponding to each query to hypothesize detections. It must be noted that the correct phone transcription corresponding to each search term has been employed. The system architecture is depicted in Figure 5.
The STD system consists of four different stages: in the first stage, a phone recognition is conducted to output phone lattices based on two different speech recognizers: (1) a standard triphone context-dependent hidden Markov model (HMM) speech recognizer with mixtures of diagonal covariance Gaussians as observa-tion density funcobserva-tions in the states and (2) a biphone context-dependent HMM speech recognizer where the observation probabilities are obtained from a multilayer perceptron (MLP). In the second stage, a STD subsys-tem hypothesizes detections from each speech recognizer. The 1-best output of each phonetic recognizer is used as source text for an edit distance search. In doing so, each putative detection could be any substring which has a pho-netic edit distance with the searched word of less than 50% of its length. Next, we take all the detections found from the different phonetic recognizers and merge them. For overlapped detections, the best detection (i.e., the one with the minimum edit distance) remains. In the third stage, two different confidence measures based on min-imum edit distance and lattice information are used as confidence scores for each putative detection. The former is computed from standard substitution, insertion, and deletion errors in the 1-best phone sequence given by each speech recognizer, and normalized by the length of the word. The latter is computed as follows: (1) we determined each lattice by using HLRescore from HTK [58] so that a smaller and more useful graph is used next; (2) we run thelattice-toolfrom the SRILM toolkit [49] to obtain the corresponding acoustic mesh graph; (3) the confidence calculated in the acoustic mesh graph is used in a modified edit distance algorithm where, instead of all costs equal to
Figure 5Architecture of text-based Spoken Term Detection system.Blocks of the text-based Spoken Term Detection system architecture. ASR, automatic speech recognition.
1, we simply sum the confidence of the matching phones with the searched word. Then, the score of a putative detection is the sum of the confidences through the acous-tic mesh of the searched word between the time limits where the detection resides. This score is also normalized by the length of the word. The fourth stage makes use of the Bosaris toolkitito fuse both scores obtained in the previous stage to compute the final confidence for each detection. A full system description can be found in [59].
Results and discussion
The results of the QbE STD evaluation are presented for every system submitted by the participants along with the system applied on STD in terms of MTWV and ATWV in Tables 6 and 7 for training/development and test data, respectively.
By analyzing the systems submitted for QbE STD evaluation at due time (i.e., not considering the late submissions) on test data, system 1 achieved the best performance both in terms of MTWV and ATWV. This reflects the good threshold setting approach used. It must be noted that both the difficulty of the task itself (search-ing acoustic queries on spontaneous data the type and quality of the acoustic data) and the absence of prior knowledge of the target language produce this low perfor-mance. However, this system is worse than the text-based STD system. This, as expected, is due to the use of the correct phone transcription for each query and hence the knowledge of the target language employed to build the text-based STD system.
Special mention requires the late submission corre-sponding to system 4b. Although this system perfor-mance is not the best in terms of MTWV on test data, this achieves the best ATWV. This is caused by the near MTWV and ATWV system performance which reflects the fact that the threshold tuned on the train-ing/development data performs very well on unseen (test) data. This may be due to several factors: (1) first, the two occurrences per query limitation produces less detections in the final output, which seriously limits the MTWV system performance and (2) the query-dependent thresh-old plays a very important role as score normalization. The best ATWV performance of this system may be due
to the similarity measure used to conduct the segmen-tal DTW search, being the Kullback-Leibler divergence, that perfectly fits the posterior probabilities computed in the first stage. The use of the target language to esti-mate these posterior probabilities also contributes to this. However, in case of system 1,a prioriknowledge of the target language was not applied, and the cosine distance may not fit the Gaussian posterior probabilities as well as the KL divergence, which may result in a less generaliz-able threshold setting, and hence, in a higher gap between MTWV and ATWV. Again, system 4b still underperforms the text-based STD system.
Similar trends are observed on training/development and test data. The main discrepancy lies on the best MTWV performance of the late submission correspond-ing to system 4b, which outperforms system 1 on train-ing/development data and underperforms system 1 on test data. We consider that this is due to the different set of queries in both sets of data and some overfitting to training/development data in parameter tuning (e.g., number of detections per query that limits MTWV per-formance on unseen data as explained earlier). Systems 3a and 4a achieve different MTWV and ATWV per-formance. This is because both systems were tuned to output a predefined number of hits (6% and 10% respec-tively) on training/development data. This causes a high number of FAs, leading to a negative ATWV perfor-mance. In addition, an MTWV equal to 0.0 means that the best possible performance is obtained with no output detections.
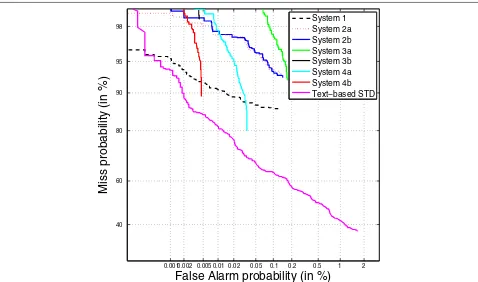
DET curves are also presented in Figures 6 and 7 for training/development and test data respectively. They show the system performance working at different miss/FA ratios. System 1 clearly outperforms the rest of the QbE STD systems for almost every operating point, except at the best operating point of system 4b, and when the miss rate is low, where system 4a performs the best. As expected from the ATWV results, by comparing the text-based STD system with the rest, the former outperforms the others except when the FA rate is low, where system 1 performs the best. Training/development and test data exhibit a similar trend.
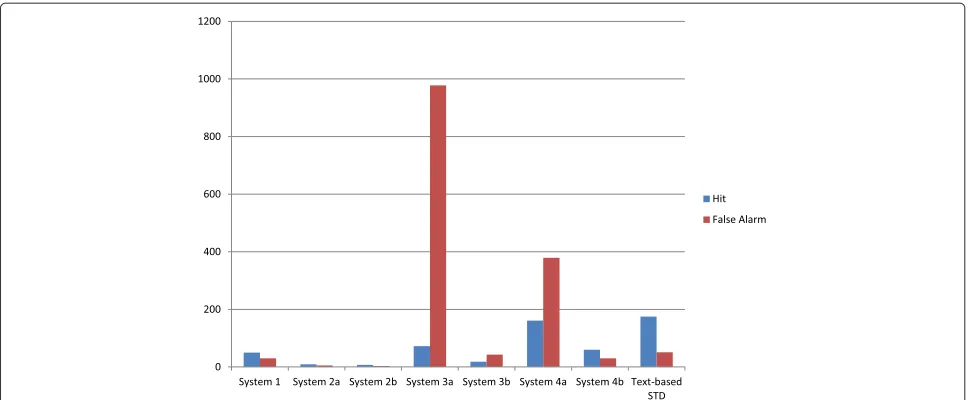
A more detailed analysis is presented in Figures 8 and 9 in terms of hit/FA performance for the different sys-tems for training/development and test data respectively. As expected from the ATWV results, the late submis-sion corresponding to system 4b achieves the best tradeoff between hits and FAs between those submitted to the QbE STD evaluation. systems 2a and 2b just output a few detections which results in bad ATWV performance. It must be noted that these two systems (2a and 2b) dra-matically increase the number of FAs as long as more detections are hypothesized, in such a way that the best ATWV result is achieved with a small number of hits
and FAs. System 3b exhibits a similar behavior on test data. Systems 3a and 4a achieve such a high number of FAs on test data that their ATWV performance decreases dramatically. This is because both systems were devel-oped by producing at least 6% and 10% coverage of hits in the training/development data, respectively, which increases both the number of hits and FAs. However, the increase in the number of FAs is much higher than the increase in the number of hits, resulting in an over-all worse ATWV performance. This is confirmed by the results of systems 3a and 4a on training/development data: to get the best performance in terms of MTWV, the high number of FAs that causes no detections are outputted in these data. System 3b confirms this on train-ing/development data. Again, system 1 achieves the best result in terms of hit/FA performance when compared with the systems submitted at due time to the main QbE STD evaluation. Looking at the performance of the text-based STD system (out of the main QbE STD eval-uation), which conducts STD and employs the correct phone transcription of the search terms when hypothesiz-ing detections, it produces the best ATWV result, since it gets quite a high number of hits and a small number of FAs.
0.001 0.002 0.005 0.01 0.02 0.05 0.1 0.2 0.5 1 2 40
60 80 90 95 98
False Alarm probability (in %)
Miss probability (in %)
System 1 System 2a System 2b System 3a System 3b System 4a System 4b Text−based STD
0.001 0.002 0.005 0.01 0.02 0.05 0.1 0.2 0.5 1 2 40
60 80 90 95 98
False Alarm probability (in %)
Miss probability (in %)
System 1 System 2a System 2b System 3a System 3b System 4a System 4b Text−based STD
Figure 7DET curves of the QbE STD ALBAYZIN evaluation systems on test data.The broken black curve represents system 1, the red dot curve represents system 2a, the dark blue curve represents system 2b, the green curve represents system 3a, the solid black curve represents system 3b, the light blue curve represents system 4a, the red curve represents system 4b and the pink curve represents the text-based STD system. Systems 3b and 4b represent late submissions. Systems 1 to 4 are on QbE STD and text-based STD is on STD.
Figure 9Hit/FA performance of the QbE STD ALBAYZIN evaluation systems on test data.The blue column represents the hit performance and the brown column represents the FA performance for ATWV. Both hit and FA values are represented as single values. Systems 3b and 4b represent late submissions. Systems 1 to 4 are on QbE STD and text-based STD system is on STD.
It should be also noted that p(FA) and p(miss) in Tables 6 and 7 do not relate to ATWV performance but to MTWV performance (i.e., with thea posterioribest deci-sion threshold). In this way, systems with MTWV= 0.0 (i.e., those that do not generate detections at best decision threshold) obtain p(FA)=0.0 and p(miss)=1.0.
Comparison to previous QbE STD evaluations
Although our evaluation results cannot be directly com-pared with those obtained in MediaEval 2011 and 2012 Search on Speech evaluations [33,34] because the database used for experimentation is different, we can mention that our results are the worst (the best perfor-mance of MediaEval 2011 is ATWV = 0.222 and that of MediaEval 2012 is ATWV = 0.740). This may be due to the generous time windows allowed in MediaEval 2011 Search on Speech Evaluation and the equal weight given to miss and FA detections when scoring MediaEval 2012 Search on Speech Evaluation systems, which got the higher ATWV performance. In our case, we have been 100% compliant with the ATWV setup, parame-ters, and scoring provided by NIST. Although the time window allowance contributes in a minor extent to the system’s performance (see Table 8), the equal weight given to misses and FAs contributes in a greater extent (see Table 9). However, these results are still far from those obtained in past MediaEval evaluations. This is due to the more complex database (different recording conditions, speakers from different countries, etc.) used in our evaluation, as explained earlier. This is confirmed by the fact that system 1 that achieves the best performance at the submission due time, being equivalent to a system
presented in MediaEval 2012 Search on Speech evaluation (which obtained an ATWV = 0.294 in that evaluation), obtains clearly the worst performance in our evaluation (ATWV = 0.0122). The time window allowance hardly contributes to improve the performance due to the small number of detections obtained by the systems when aim-ing to maximize ATWV performance. Therefore, increas-ing the time window to consider a detection as a hit does not play an important role when examining ATWV performance. For systems with more detections (e.g., sys-tems 3a, 3b, and 4b), however, an increase in the time window allowance contributes to the highest ATWV per-formance gains. The different ranking obtained in Table 9 must be noted, where a same weight is given to misses and FAs, compared to that obtained in the real evaluation (see Table 7). This does not mean that the best system of the QbE STD evaluation is not actually thebest, since the system tuning carried out on training/development data is greatly impacted by the ATWV formulation and hence by the different weight given to misses and FAs. The fast spontaneous speed, the noise background in some test queries, and the challenging acoustic conditions may be also causing the worse system performance compared to past MediaEval evaluations. A further analysis based on query length, speaking speed, and energy is presented next.
Performance analysis of the QbE STD systems based on query length
Table 8 Results of the QbE STD systems for different time window tolerance on test data
System ID Time window MTWV ATWV p(FA) p(miss)
(sec)
System 1 0.5 0.0436 0.0122 0.00000 0.952
5 0.0436 0.0194 0.00000 0.952
10 0.0436 0.0194 0.00000 0.952
30 0.0436 0.0194 0.00000 0.952
System 2a 0.5 0.0055 0.0031 0.00001 0.983
5 0.0055 0.0031 0.00001 0.983
10 0.0098 0.0075 0.00001 0.981
30 0.0098 0.0075 0.00001 0.981
System 2b 0.5 0.0075 0.0047 0.00000 0.990
5 0.0075 0.0047 0.00000 0.990
10 0.0075 0.0047 0.00000 0.990
30 0.0075 0.0047 0.00000 0.990
System 3a 0.5 0.0000 −2.1471 0.00000 1.000
5 0.0000 −2.0841 0.00000 1.000
10 0.0000 −2.0560 0.00000 1.000
30 0.0000 −1.8739 0.00000 1.000
System 3b 0.5 0.0000 −0.0678 0.00000 1.000
5 0.0000 −0.0644 0.00000 1.000
10 0.0000 −0.0610 0.00000 1.000
30 0.0000 −0.0585 0.00000 1.000
System 4a 0.5 0.0000 −0.6416 0.00000 1.000
5 0.0000 −0.5746 0.00000 1.000
10 0.0000 −0.5522 0.00000 1.000
30 0.0000 −0.4952 0.00000 1.000
System 4b 0.5 0.0238 0.0217 0.00009 0.884
5 0.0432 0.0361 0.00008 0.874
10 0.0469 0.0398 0.00008 0.873
30 0.0556 0.0438 0.00008 0.869
Table 9 Results of the QbE STD systems with equal weight to misses and FAs on test data
System ID MTWV ATWV p(FA) p(miss)
System 1 0.1226 0.0810 0.00102 0.876
System 2a 0.1234 0.0145 0.00272 0.874
System 2b 0.1504 0.0116 0.00319 0.846
System 3a 0.0980 0.0962 0.00224 0.902
System 3b 0.0328 0.0309 0.00010 0.969
System 4a 0.2282 0.2273 0.00087 0.772
System 4b 0.1154 0.0905 0.00009 0.884
shown in Table 10. Queries have been divided into three categories: short-length queries (queries shorter than 40 hundredth of seconds), medium-length queries (queries between 40 and 50 hundredth of seconds) and long-length queries (queries longer than 50 hundredth of seconds). It can be clearly seen that in general, longer queries exhibit the best performance while shorter queries obtain the worst performance. This is because short-length queries are naturally more confusable within speech data than long-length queries, which occurs in ASR systems with long-length words and short-length words.
Performance analysis of the QbE STD systems based on query speaking speed
A similar analysis based on the speaking speed of each query has been carried out for the QbE STD systems and results are presented in Table 11. Queries have been divided into three categories: slow queries with a slow pronunciation speed (above 5.90 hundredth of seconds per phone), medium queries with a medium pronunciation speed (between 5.90 and 4.82 hundredth of seconds per phone), and fast queries with a fast pronunciation speed (below 4.82 hundredth of seconds per phone). Results show that slow queries exhibit the
Table 10 Results of the QbE STD systems based on query length on test data
System ID Length MTWV ATWV p(FA) p(miss)
System 1 Short 0.0154 −0.0979 0.00001 0.977
Medium 0.0703 0.0613 0.00001 0.922
Long 0.0735 0.0648 0.00000 0.927
System 2a Short 0.0000 0.0000 0.00000 1.000
Medium 0.0106 0.0005 0.00001 0.975
Long 0.0159 0.0079 0.00001 0.978
System 2b Short 0.0028 0.0000 0.00000 0.997
Medium 0.0075 −0.0070 0.00000 0.992
Long 0.0197 0.0189 0.00001 0.974
System 3a Short 0.0000 −2.9565 0.00000 1.000
Medium 0.0080 −2.0208 0.00000 0.992
Long 0.0057 −1.5572 0.00000 0.994
System 3b short 0.0000 −0.1105 0.00000 1.000
Medium 0.0000 −0.0305 0.00000 1.000
Long 0.0000 −0.0630 0.00000 1.000
System 4a Short 0.0000 −0.8770 0.00000 1.000
Medium 0.0000 −0.6511 0.00000 1.000
Long 0.0000 −0.4300 0.00000 1.000
System 4b Short 0.0000 −0.0698 0.00000 1.000
Medium 0.0631 0.0631 0.00007 0.872
Table 11 Results of the QbE STD systems based on query speaking speed on test data
System ID Speaking MTWV ATWV p(FA) p(miss)
speed
System 1 Slow 0.0655 0.0543 0.00000 0.935
Medium 0.0560 0.0445 0.00001 0.937
Fast 0.0418 −0.0678 0.00000 0.958
System 2a Slow 0.0083 0.0054 0.00003 0.957
Medium 0.0083 0.0023 0.00000 0.992
Fast 0.0090 0.0015 0.00001 0.984
System 2b Slow 0.0121 0.0103 0.00000 0.988
Medium 0.0083 0.0023 0.00000 0.992
Fast 0.0090 0.0015 0.00001 0.984
System 3a Slow 0.0050 −1.1229 0.00000 0.995
Medium 0.0000 −2.9868 0.00000 1.000
Fast 0.0000 −2.2972 0.00000 1.000
System 3b Slow 0.0000 −0.0257 0.00000 1.000
Medium 0.0000 −0.1072 0.00000 1.000
Fast 0.0000 −0.0684 0.00000 1.000
System 4a Slow 0.0000 −0.5006 0.00000 1.000
Medium 0.0000 −0.7150 0.00000 1.000
Fast 0.0000 −0.7088 0.00000 1.000
System 4b Slow 0.0775 0.0775 0.00004 0.881
Medium 0.0000 −0.0416 0.00000 1.000
Fast 0.0330 0.0330 0.00007 0.894
best performance. We consider that this is because slow queries usually posses a clearer pronunciation, and less co-articulation, than faster (medium and fast) queries. For faster queries, however, some degree of mispronunciation (i.e., deleting phones) could appear, which affects the final performance.
Performance analysis of the QbE STD systems based on query energy
A similar analysis based on the average energy of each query has been conducted for the QbE STD systems and results are presented in Table 12. Energy has been obtained using Praat program [60]. Here, the queries have been divided into three different categories as follows: low- (below 54 dB), medium- (between 54 and 65 dB), and high-energy (above 65 dB) queries. The results show that medium energy queries posses the best performance in general. We consider this is because extreme values of energy tend to cause more errors than standard (medium) values of energy in the queries, as also shown in [61] for ASR systems. The only exception is system 1, in which the high-energy queries perform the best. We consider that this may be due to the voice activity detector (VAD)
Table 12 Results of the QbE STD systems based on query energy on test data
System ID Energy MTWV ATWV p(FA) p(miss)
System 1 Low 0.0319 −0.0231 0.00001 0.961
Medium 0.0681 0.0111 0.00000 0.932
High 0.0746 0.0486 0.00000 0.925
System 2a Low 0.0099 0.0028 0.00001 0.976
Medium 0.0152 0.0133 0.00001 0.978
High 0.0000 −0.0069 0.00000 1.000
System 2b Low 0.0008 −0.0063 0.00001 0.992
Medium 0.0297 0.0273 0.00001 0.963
High 0.0000 −0.0069 0.00000 1.000
System 3a Low 0.0000 −1.9539 0.00000 1.000
Medium 0.0000 −1.2089 0.00000 1.000
High 0.0000 −3.2785 0.00000 1.000
System 3b Low 0.0000 −0.0319 0.00000 1.000
Medium 0.0000 −0.0269 0.00000 1.000
High 0.0000 −0.1446 0.00000 1.000
System 4a Low 0.0000 −0.6440 0.00000 1.000
Medium 0.0000 −0.4045 0.00000 1.000
High 0.0000 −0.8762 0.00000 1.000
System 4b Low 0.0102 0.0102 0.00010 0.893
Medium 0.0928 0.0928 0.00003 0.873
High 0.0083 −0.0379 0.00000 0.992
included within the system that is applied both to the query and test data. VAD may be causing the clipping of queries with smaller values for energy (low and medium), which may worsen the QbE STD performance for these queries.
Performance analysis of the QbE STD systems for specific queries
in the previous analyses (medium energy queries and long-length queries).
Template matching-based versus phone transcription-based QbE STD
Systems 1 and 4a,b employ a template matching-based approach for QbE STD, whereas systems 2a,b and 3a,b employ a phone transcription-based approach for QbE STD. This means that the best overall performance is achieved by the template matching-based approach pro-posed both in systems 1 and 4. This result confirms the conclusion presented in [18] where a template matching-based approach outperformed a phone transcription-based approach for QbE STD.
Results obtained by system 2a,b suggest that building a speech recognizer on a language different from the target language to produce phoneme lattices and a next search within these phoneme lattices is not appropriate when addressing the QbE STD task, since they are not reliable enough to represent the speech content in an out-of-language setup. In addition, the query search algorithm employed in system 3a,b considers so many paths in the lattice that represents the query to hypothesize detec-tions within the utterances that many FAs are generated. A better score confidence estimation for this system is necessary to reject as many FAs as possible.
Despite the bad performance exhibited by the config-uration 4a corresponding to system 4, it must be noted that this was not optimized for the final metric (i.e., ATWV) but to get a predefined hit coverage, which greatly affects the final ATWV performance [62] and hence, a fair comparison with the rest of the systems cannot be made.
Set of features for QbE STD
Different sets of features have been employed as speech signal representation: Gaussian posteriorgrams for system 1,a posterioriphoneme probabilities for systems 3a,b and 4a,b, and three-state MLP-based phoneme probabilities for system 2a,b. Although all these features should be fed within all the search algorithms to derive a more powerful conclusion, we can observe that Gaussian posteriorgram features are suitable for speech signal representation due to the best performance of system 1 when no prior knowl-edge of the target language is used. We can also men-tion that the posterior phoneme probabilities used in the language-dependent setup corresponding to the late sub-mission of system 4b are an effective representation of the speech signal due to their best ATWV performance.
Towards a language-independent STD system
From the systems submitted to this evaluation, an analysis aiming at deciding the feasibility of a language-independent STD system can be conducted. By com-paring the best language-independent QbE STD system
(system 1) with the text-based STD system, we can claim that building a language-independent STD system is still a far milestone. This means that more research is needed in this direction to get nearer language-dependent to language-independent STD systems.
Challenge of the QbE STD task
By inspecting the results of all the systems submitted to the QbE STD evaluation, we can claim that building a reliable QbE STD system is still far from being a solved problem. The low ATWV performance exhibited by the best system (ATWV = 0.0217) confirms this. There are many issues that must be still solved in the future. First, a robust feature extraction process is necessary to represent in an accurate way the query/utterance speech content. Next, a suitable search algorithm that hypothesizes detec-tions is also necessary to output as many hits as possible while maintaining a reasonably low number of FAs. In addition, the spontaneous speech, inherent to QbE STD systems, is an important drawback since phenomena, such as disfluences, hesitations, and noises, are very difficult to deal with. Some pre-processing steps that deal with these phenomena could enhance the final performance. From the systems submitted to this evaluation, we can claim that Gaussian posteriorgrams or, generally speaking, pos-terior phoneme probabilities, as features and a subsequent DTW-based search are a reasonablegood starting point when facing QbE STD.
Conclusions
We have presented the four systems submitted to ALBAYZIN 2012 Query-by-Example Spoken Term Detection evaluation along with a system that conducts STD. Four different Spanish research groups (TID, GTTS, ELiRF, and VivoLab) took part in the evaluation. There were two different kinds of systems submitted for eval-uation: template matching-based systems and phone transcription-based systems. Systems 1 and 4a,b belong to the former group and systems 2a,b and 3a,b belong to the latter. Results show better performance of the template matching-based systems over the systems that employ the phone transcription of each query obtained from a phone decoding followed by atext-based STD-like search to hypothesize detections. The best system employs Gaussian posteriorgram/a posteriori phoneme proba-bility features and a DTW-like search to hypothesize detections.
We have also shown that QbE STD systems (systems 1 and 4b) are still far from systems that deal with text-based STD (text-text-based STD system) and that long-length, medium energy, and slow speaking speed queries con-tribute to get higher the QbE STD system performance.
for future research in this language. In addition, the spon-taneous speech database chosen for the experimentation, and in particular its realistic and challenging acoustic con-ditions, made the evaluation and the database attractive enough for future research. Results presented in this paper indicate that there is still a big room for improvement which encourages us to maintain this evaluation in the next ALBAYZIN evaluation campaigns.
Endnotes
a http://iberspeech2012.ii.uam.es/ b http://www.mavir.net
c http://www.rthabla.es/
d http://iberspeech2012.ii.uam.es/ e http://www.mavir.net
f http://sox.sourceforge.net/
ghttp://www.itl.nist.gov/iad/mig/tests/std/2006/ h http://homepages.inf.ed.ac.uk/v1dwang2/public/
tools/index.html
ihttps://sites.google.com/site/bosaristoolkit/
Competing interests
The authors declare that they have no competing interests.
Author details
1Human Computer Technology Laboratory (HCTLab), Universidad Autónoma
de Madrid, Madrid 28049, Spain.2Biometric Recognition Group - ATVS,
Universidad Autónoma de Madrid, Madrid 28049, Spain.3Telefónica Research,
Barcelona, Spain.4Working group on Software Technologies (GTTS), University
of the Basque Country (UPV/EHU), Leioa 48940, Spain.5Departament de
Sistemes Informàtics i Computació, Universitat Politècnica de València, Valencia 46022, Spain.6Voice Input Voice Output Laboratory (ViVoLab), Aragon Institute
for Engineering Research (I3A), University of Zaragoza, Zaragoza 50018, Spain.
Received: 22 March 2013 Accepted: 9 September 2013 Published: 17 September 2013
References
1. T Zhang, CCJ Kuo, inProceedings of ICASSP. Hierarchical classification of audio data for archiving and retrieving (Phoenix, 15–19 March 1999), pp. 3001–3004
2. M Helén, T Virtanen, inProceedings of ICASSP. Query by example of audio signals using Euclidean distance between Gaussian Mixture Models (Honolulu, 15–20 April 2007), pp. 225–228
3. M Helén, T Virtanen, Audio query by example using similarity measures between probability density functions of features. EURASIP J. Audio Speech Music Process.2010, 2:1–2:12 (2010)
4. G Tzanetakis, A Ermolinskyi, P Cook, inProceedings of the Third International Conference on Music Information Retrieval: ISMIR. Pitch histograms in audio and symbolic music information retrieval (Paris, 2002), pp. 31–38 5. HM Tsai, WH Wang, inProceedings of the IEEE International Conference on
Multimedia and Expo. A query-by-example framework to retrieve music documents by singer (Taipei, 27–30 June 2004), pp. 1863–1866 6. TK Chia, KC Sim, H Li, HT Ng, inProceedings of the 31st Annual International
ACM SIGIR Conference on Research and Development in Information Retrieval. A lattice-based approach to query-by-example spoken document retrieval (Singapore, 20–24 July 2008), pp. 363–370 7. J Tejedor, M Fapšo, I Szöke, H ˇCernocký, F Grézl, Comparison of methods
for language-dependent and language-independent query-by-example spoken term detection. ACM Trans. Inf. Syst.30(3), 18:1–18:34 (2012) 8. A Muscariello, G Gravier, F Bimbot, inProceedings of Interspeech.
Zero-resource audio-only spoken term detection based on a
combination of template matching techniques (Florence, 27–31 August 2011), pp. 921–924
9. H Lin, A Stupakov, J Bilmes, in9th International Speech Communication Association Annual Conference. Spoken keyword spotting via multi-lattice alignment (Brisbane, Australia, September 2008), pp. 2191–2194 10. C Parada, A Sethy, B Ramabhadran, inProceedings of ASRU.
Query-by-Example Spoken Term Detection for OOV terms (Merano, 13-17 December 2009), pp. 404–409
11. W Shen, TJ White, CM Hazen, inProceedings of Interspeech. A comparison of Query-by-Example methods for Spoken Term Detection (Brighton, September 2009), pp. 2143–2146
12. H Lin, A Stupakov, J Bilmes, inProceedings of ICASSP. Improving multi-lattice alignment based spoken keyword spotting (Taipei, 19–24 April 2009), pp. 4877–4880
13. E Barnard, M Davel, C van Heerden, N Kleynhans, K Bali, inProceedings of MediaEval. Phone recognition for spoken web search (Pisa, 1–2 September 2011), pp. 5–6
14. A Buzo, H Cucu, M Safta, B Ionescu, C Burileanu, inProceedings of MediaEval. ARF@MediaEval 2012: a Romanian ASR-based approach to spoken term detection (Pisa, 4–5 October 2012), pp. 7–8
15. A Abad, RF Astudillo, inProceedings of MediaEval. The L2F spoken web search system for MediaEval 2012 (Pisa, 4–5 October 2012), pp. 9–10 16. A Varona, M Penagarikano, L Rodríguez-Fuentes, L Bordel, M Diez, in
Proceedings of MediaEval. GTTS system for the spoken web search task at MediaEval 2012 (Pisa, 4–5 October 2012), pp. 13–14
17. I Szöke, M Fap˘so, K Veselý, inProceedings of MediaEval. BUT2012 Approaches for spoken web search - MediaEval 2012 (Pisa, 4-5 October 2012), pp. 15–16
18. W Hazen, TJ Shen, CM White, inProceedings of ASRU. Query-by-Example spoken term detection using phonetic posteriorgram templates (Merano, 13–17 December 2009), pp. 421–426
19. Y Zhang, JR Glass, inProceedings of ASRU. Unsupervised spoken keyword spotting via segmental DTW on Gaussian Posteriorgrams (Merano, 13–17 December 2009), pp. 398–403
20. C Chan, L Lee, inProceedings of Interspeech. Unsupervised spoken-term detection with spoken queries using segment-based dynamic time warping (Makuhari, 26–30 September 2010), pp. 693–696
21. X Anguera, R Macrae, N Oliver, inProceedings of ICASSP. Partial sequence matching using an unbounded dynamic time warping algorithm (Dallas, 14–19 March 2010), pp. 3582–3585
22. X Anguera, inProceedings of MediaEval. Telefonica system for the spoken web search Task at Mediaeval 2011 (Pisa, 1–2 September 2011), pp. 3–4 23. A Muscariello, G Gravier, inProceedings of MediaEval. Irisa MediaEval 2011
spoken web search system (Pisa, 1–2 September 2011), pp. 9–10 24. I Szöke, J Tejedor, M Fap˘so, J Colás, inProceedings of MediaEval.
BUT-HCTLab approaches for spoken web search - MediaEval 2011 (Pisa, 1–2 September 2011), pp. 11–12
25. H Wang, T Lee, inProceedings of MediaEval. CUHK System for the spoken web search task at Mediaeval 2012 (Pisa, 4–5 October 2012), pp. 3–4 26. C Joder, F Weninger, M Wöllmer, M Schuller, inProceedings of MediaEval.
The TUM cumulative DTW approach for the Mediaeval 2012 spoken web search task (Pisa, 4–5 October 2012), pp. 5–6
27. J Vavrek, M Pleva, J Juhár, inProceedings of MediaEval. TUKE MediaEval 2012: spoken web search using DTW and unsupervised SVM (Pisa, 4–5 October 2012), pp. 11–12
28. A Jansen, P Durme, BV Clark, inProceedings of MediaEval. The JHU-HLTCOE spoken web search system for MediaEval 2012 (Pisa, 4–5 October 2012), pp. 17–18
29. X Anguera, inProceedings of MediaEval. Telefonica Research System for the spoken web search task at Mediaeval 2012 (Pisa, 4–5 October 2012), pp. 19–20
30. NIST, The Ninth Text REtrieval Conference (TREC 9) (2000). http://trec.nist.gov. Accessed 16 September 2013
31. NIST, The Spoken Term Detection (STD) 2006 Evaluation Plan. 10 (National Institute of Standards and Technology (NIST), Gaithersburg, 2006). http://www.nist.gov/speech/tests/std. Accessed 16 September 2013 32. T Sakai, H Joho, inProceedings of NTCIR-9 Workshop. Overview of NTCIR-9,
(2011), pp. 1–7
34. F Metze, E Barnard, M Davel, C van Heerden, X Anguera, G Gravier, N Rajput, inProceedings of MediaEval. Spoken web search (Pisa, 4–5 October 2012), pp. 1–2
35. Tokyo University of Technology, Evaluation of information access technologies: information retrieval, question answering and cross-lingual information access (2013). http://research.nii.ac.jp/ntcir/ntcir-10/. Accessed 16 September 2013
36. NIST, The OpenKWS13 evaluation plan. 1, (National Institute of Standards and Technology (NIST), Gaithersburg, 2013). http://www.nist.gov/itl/iad/ mig/openkws13.cfm. Accessed 16 September 2013
37. B Taras, C Nadeu, Audio segmentation of broadcast news in the Albayzin-2010 evaluation: overview, results, and discussion. EURASIP J. Audio Speech Music Process.1, 1–10 (2011)
38. M Zelenák, H Schulz, J Hernando, Speaker diarization of broadcast news in Albayzin 2010 evaluation campaign. EURASIP J. Audio Speech Music Process.19, 1–9 (2012)
39. LJ Rodríguez-Fuentes, M Penagarikano, A Varona, M Díez, G Bordel, in Proceedings of Interspeech. The Albayzin 2010 language recognition evaluation (Florence, 27–31 August 2011), pp. 1529–1532
40. F Méndez, L Docío, M Arza, F Campillo, inProceedings of FALA. The Albayzin 2010 text-to-speech evaluation (Vigo, November 2010), pp. 317–340 41. JG Fiscus, J Ajot, JS Garofolo, G Doddington, inProceedings of SIGIR
Workshop Searching Spontaneous Conversational Speech. Results of the 2006 spoken term detection evaluation (Rhodes, 22–25 September 2007), pp. 45–50
42. A Martin, G Doddington, T Kamm, M Ordowski, M Przybocki, in Proceedings of Eurospeech. The DET curve in assessment of detection task performance (Rhodes, 22-25 September 1997), pp. 1895–1898 43. NIST, NIST Speech Tools and APIs: 2006 (National Institute of Standards
and Technology (NIST), Gaithersburg, 1996). http://www.nist.gov/speech/ tools/index.htm. Accessed 16 September 2013
44. Iberspeech 2012, VII Jornadas en Tecnología del Habla and III Iberian SLTech Workshop. http://iberspeech2012.ii.uam.es/
IberSPEECH2012_OnlineProceedings.pdf. Accessed 16 September 2013 45. X Anguera, inProceedings of ICASSP. Speaker independent discriminant
feature extraction for acoustic pattern-matching (Kyoto, 25–30 March 2012), pp. 485–488
46. X Anguera, M Ferrarons, inProceedings of ICME. Memory efficient subsequence DTW for Query-by-Example spoken term detection, (2013). www.xavieranguera.com/papers/sdtw_icme2013.pdf
47. X Anguera, inProceedings of IberSPEECH. Telefonica Research System for the Query-by-example task at Albayzin 2012 (Madrid, Spain, 21–23 November 2012), pp. 626–632
48. P Schwarz, Phoneme recognition based on long temporal context. PhD Thesis, FIT, BUT, Brno, Czech Republic (2008)
49. A Stolckem, inProceedings of Interspeech. SRILM - an extensible language modeling toolkit (Denver, 2002), pp. 901–904
50. D Wang, S King, J Frankel, Stochastic pronunciation modelling for out-of-vocabulary spoken term detection. IEEE Trans. Audio Speech Language Process.19(4), 688–698 (2011)
51. D Wang, J Tejedor, S King, J Frankel, Term-dependent confidence normalization for out-of-vocabulary spoken term detection. J. Comput. Sci. Technol.27(2), 358–375 (2012)
52. D Wang, S King, J Frankel, R Vipperla, N Evans, R Troncy, Direct posterior confidence for out-of-vocabulary spoken term detection. ACM Trans. Inf. Syst.30(3), 1–34 (2012)
53. A Varona, M Penagarikano, LJ Rodríguez-Fuentes, G Bordel, M Diez, in Proceedings of IberSPEECH. GTTS systems for the query-by-example spoken term detection task of the Albayzin 2012 search on speech evaluation (Madrid, Spain, 21–23 November 2012), pp. 619–625 54. J Gómez, E Sanchis, M Castro-Bleda, inProceedings of the Joint IAPR
International Conference on Structural, Syntactic, and Statistical Pattern Recognition. Automatic speech segmentation based on acoustical clustering, (2010), pp. 540–548
55. J Gómez, M Castro, inProceedings of the joint IAPR International Workshop on Structural, Syntactic, and Statistical Pattern Recognition. Automatic segmentation of speech at the phonetic level, (2002), pp. 672–680 56. E Sanchis, LF Hurtado, JA Gómez, M Calvo, R Fabra, inProceedings of
IberSPEECH. The ELiRF Query-by-example STD systems for the Albayzin 2012 search on speech evaluation (Madrid, Spain, 21–23 November 2012), pp. 611–618
57. A Park, J Glass, inProceedings of ASRU. Towards unsupervised pattern discovery in speech (Cancun, 27 November to 1 December 2005), pp. 53–58
58. S Young, G Evermann, M Gales, T Hain, D Kershaw, X Liu, G Moore, J Odell, D Ollason, D Povey, V Valtchev, P Woodland,The HTK Book. (Engineering Department, Cambridge University, 2006)
59. A Miguel, J Villalba, A Ortega, E Lleida, inProceedings of IberSPEECH. Albayzin 2012 search on speech @ ViVoLab UZ (Madrid, Spain, 21–23 November 2012), pp. 633–642
60. P Boersma, D Weenink, Praat: Doing Phonetics by Computer. University of Amsterdam, Spuistraat, 210, Amsterdam, Holland (2007). http://www.fon. hum.uva.nl/praat/. Accessed 16 September 2013
61. S Goldwater, D Jurafsky, CD Maning, Which words are hard to recognize? Prosodic, lexical, and disfluency factors that increase speech recognition error rates. Speech Commun.52(3), 181–200 (2009)
62. T Mertens, R Wallace, D Schneider, inProceedings of CBMI. Cross-site combination and evaluation of subword spoken term detection systems (Madrid, 13–15 June 2011), pp. 61–66
doi:10.1186/1687-4722-2013-23
Cite this article as: Tejedor et al.: Query-by-Example Spoken Term Detection ALBAYZIN 2012 evaluation: overview, systems, results, and discussion. EURASIP Journal on Audio, Speech, and Music Processing
20132013:23.
Submit your manuscript to a
journal and benefi t from:
7Convenient online submission 7Rigorous peer review
7Immediate publication on acceptance 7Open access: articles freely available online 7High visibility within the fi eld
7Retaining the copyright to your article