R E S E A R C H
Open Access
Reassigned spectrum-based feature extraction
for GMM-based automatic chord recognition
Maksim Khadkevich and Maurizio Omologo
*Abstract
Most existing automatic chord recognition systems use a chromagram in front-end processing and some sort of classifier (e.g., hidden Markov model, Gaussian mixture model (GMM), support vector machine, or other template matching technique). The vast majority of front-end algorithms derive acoustic features based on a standard short-time Fourier analysis and on mapping energy from the power spectrum, or from a constant-Q spectrum, to chroma bins. However, the accuracy of the resulting spectral representation is a crucial issue. In fact, conventional methods based on short-time Fourier analysis involve an intrinsic trade-off between time resolution and frequency resolution. This work investigates an alternative feature set based on time-frequency reassignment, which was applied in the past to speech processing tasks such as formant extraction. As shown in the following experiments, the reassigned spectrum provides a very accurate front-end for the GMM-based chord recognition system here investigated.
Keywords: Chord recognition; Music information retrieval; Acoustic features; Hidden Markov models; Time-frequency reassignment
1 Introduction
With the rapid growth of digital media and musical col-lections that can be accessed via the Web, many new applications are presently envisaged which require the analysis of audio contents. Automatic extraction of high-level information such as rhythm, harmony, key, and melody therefore represents a primary goal and challenge in the music information retrieval (MIR) research com-munity. In particular, automatic chord recognition has always been of great interest, since a chord sequence can act as a robust mid-level representation for a vari-ety of MIR tasks such as cover song identification, music classification, and retrieval [1]. The majority of chord recognition systems proposed in the literature rely on two basic steps, namely feature extraction and classification.
Feature extraction analyzes the waveform and converts it into a set of acoustic feature vectors, which efficiently characterize the input signal in time and frequency [2]. Historically, studies on feature extraction for chord recog-nition started with the introduction of chroma features,
*Correspondence: [email protected]
Fondazione Bruno Kessler-irst, via Sommarive 18, Povo 38050, Italy
a.k.a., pitch class profiles, in 1999 by Fujishima [3]. A chroma vector represents the power spectrum distribu-tion over the 12 semitone pitch classes for a given time interval. It is generally computed by transforming the sig-nal from the time domain into the frequency domain, with the help of a short-time Fourier transform (STFT) [4,5] or of a constant-Q transform [6,7], and then mapping the energy from spectral bins to chroma bins.
Similarly to the spectrogram for speech analysis, the chromagram (i.e., a sequence of chroma vectors) is one of the most effective signal representations for music anal-ysis and chord recognition. Different ways of computing chroma features and chromagrams are reported in the literature [8,9]. In particular, much attention has been devoted to the problem of higher harmonics and to their impact on chroma vectors. Several works proposed the use of some sort of harmonic analysis in order to reveal the presence of higher harmonic components [10-12]. In all these approaches, spectral analysis is performed on a frame-by-frame basis, in order to find all the pitches that occur at each time instant.
In the work of Mauch and Dixon [10], an approximate note transcription procedure was applied before calcula-tion of a wrapped chromagram. Their technique proved to
be more advantageous when considering ‘difficult’ chords. Ueda et al. [13] showed the importance of the ‘harmonic filtering’ step for feature extraction. Their chord recog-nition system was based on harmonic/percussive sound separation, which led to the best result in the MIREX 2008
evaluation campaign (http://www.music-ir.org/mirex/
2008/index.php/Audio_Chord_Detection_Results). In most of the above-mentioned techniques, a power or magnitude spectrum (regardless of the related phase information) is restructured into a 12-chroma feature rep-resentation which depends on the frequency resolution of the STFT applied to the given music signal sequence. The central assumption of the STFT is that of station-arity, i.e., the spectral content of the analyzed frame is assumed to be constant. In general, small deviations from this theoretical assumption introduce tolerable artifacts. However, music is a non-stationary process, sometimes characterized by sudden changes (e.g., in the onset of a note or in attack transients of a percussive instrument) which require a high time resolution, or by quasi steady-state sequences embedding important small fluctuations (e.g., vibrato) for which a high frequency resolution would be necessary.
To increase frequency resolution enough to properly represent the harmonic contents of the signal, one should adopt a long analysis window, which introduces draw-backs due to the increased probability of having a chord change, or some note transitions, inside it. On the other hand, reducing the analysis window size does not allow for a reasonable frequency resolution. As a result, in the liter-ature, the most widely used frame sizes to derive chroma vectors range from 180 to 740 ms [4,6,7,14-16]. To pro-vide smoothed feature sequences, a high overlap ratio (i.e., from 50% to 90%), with subsequent median filtering or averaging, is generally applied. As an alternative approach, Rocher et al. [17] proposed multi-resolution STFT analy-sis to estimate chords and tonality at the same time. In that work, window sizes of 800, 200, and 100 ms were jointly used to derive three versions of a chromagram.
Such techniques and related window sizes, however, are often not sufficient to avoid the above-mentioned problems. In other words, a chromagram for music sig-nal asig-nalysis, like a spectrogram for speech asig-nalysis, is a time-frequency representation with a given uncertainty due to the adopted windowing operation, as discussed in depth in [18,19]. Using other time-frequency analysis techniques [20], this ‘resolution trade-off ’ between time and frequency can be addressed to reduce uncertainty in the resulting representation.
In particular, a very accurate description of the time-frequency structure for a music signal sequence can be obtained through the reassigned spectrogram repre-sentation, which derives from the time-frequency reas-signment (TFR) technique [20] initially proposed by
Kodera et al. [21]. In practice, TFR remaps the spec-tral energy corresponding to a spectrogram cell into another time-frequency point, which is closest to the true region of support of the analyzed signal. The result-ing reassigned spectrogram has already been investigated for different tasks, such as sinusoidal synthesis [22], and cover song identification [23]. Hainsworth and Wolfe [24] showed the importance of TFR to segment a monophonic piano melody and locate partials of individual notes. As shown in this paper, TFR can also be applied effec-tively to enhance chroma features for chord recognition, due to its capability to highlight the energy of harmonic components.
The second main processing component of an auto-matic chord recognition system is classification. Possible classification approaches can here be divided in two cat-egories: template matching [25,26] and machine learn-ing [4,14,27], with hidden Markov models (HMM) belearn-ing the most popular approach in, e.g., speech processing. Although the focus of this paper is on feature extraction, our work also investigates different ways of combining the HMM framework with the proposed front-end pro-cessing. In particular, in the following, we investigate the use of HMMs [28] and Gaussian mixture models (GMM). Note that the latter can be seen as a specific case of HMMs [29] and that they have already been adopted for automatic chord recognition [30].
The structure of the paper is as follows: in Section 2, the formulation of the time-frequency reassignment tech-nique is introduced. Sections 3 and 4 describe the chord recognition system and the adopted evaluation met-rics, respectively. Experimental results are then given in Section 5. Section 6 will provide a final discussion and draw some conclusions.
2 Reassigned spectrum-based chromagram
Letx(n)be a discrete-time signal sampled atFssampling
rate. At a given samplel, the STFT is applied tox(n) as follows:
X(l,k)=N−1
n=0 h(n)x(n+l)e
−j2πnk/N, (1)
whereh(n)is the discrete version of the continuous win-dow functionh(t)whilekandNdenote a bin number and the window size, respectively.
In the following, we will use the magnitude spectrum
|X(l,k)|deriving from Eq. (1). The majority of chroma-gram extraction techniques use this representation to map spectral energies to chroma bins, based on:
d(k)=mod(12log2
fk
fref
+69, 12), (2)
wherefrefdenotes the reference frequency of the ‘A4’ tone whilefk = kFNs andd(k)are thek-th frequency analyzed
index, respectively. An evident drawback of a process-ing based on this representation is that it neglects phase information.
On the other hand, the resulting STFT X(l,k) can be formulated as:
X(l,k)= |X(l,k)|ejφ(l,k), (3)
whereφ (l,k)is the phase spectrum.
Now, let us denote the angular frequency of f as
ω = 2πf. As shown in [18] and [31], starting from a generic time-frequency point (t,ω) where STFT was com-puted, the reassigned time-frequency coordinates (ˆt,ω)ˆ
can be derived in different ways.
An efficient computation of ˆt(t,ω) and ω(ˆ t,ω) in the discrete-time domain was proposed by Auger and Flan-drin [32] and takes the following form:
ˆ
t(t,ω)=t−
XTh(t,ω)X∗(t,ω)
|X(t,ω)|2
(4)
ˆ
ω(t,ω)=ω+
XDh(t,ω)X∗(t,ω)
|X(t,ω)|2
, (5)
where XDh is the STFT obtained using a
frequency-weighted window functionhD(n)that is a discrete version ofhD(t) = dtdh(t) andXThis the STFT obtained using a time-weighted window functionhT(n)that is a discrete version ofhT(t)=th(t)[18]. Reallocating spectral energy from spectrogram cell(t,ω)to(ˆt,ω)ˆ concludes the reas-signment operation. As a result, more precise estimates of spectral energy distribution are obtained.
The principle of the reassignment technique is to real-locate energy from the geometrical center of the analysis window to the ‘center of gravity’ of the spectral com-ponent this energy belongs to. However, the reassigned spectrogram can be noisy.
The signal has a meaningful output only in the neigh-borhood of an impulsive or harmonic component. In contexts for which there is no component of significant amplitude, the time-frequency reallocations can become random [33] and a large energy reassignment is generally observed. In order to obtain a better spectral represen-tation, keeping the energy of harmonic components and deemphasizing that of noisy and impulsive components, the following condition should be met [34]:
∂2∂φ (t∂ωt,ω) +1<A, (6) where Ais the tolerance factor, which defines the max-imum deviation of the acceptable spectral component from a pure sinusoid.
It is worth noting that there is not an optimal value for
A. It depends on the task and, in general, it must be deter-mined empirically. Fulop and Fitz reported in [33] that values ranging from 0.1 to 0.2 are reasonable thresholds
for speech signals. Nelson [34] reports on higher values but, in fact, the application of this theory to music signal processing requires a specific investigation, as addressed in Section 5.5. Efficient computation of ∂φ∂t∂ω2(t,ω)is given in [18] and can be expressed as follows:
∂2φ (t,ω) ∂t∂ω =
XT Dh(t,ω)X∗(t,ω)
|X(t,ω)|2
−
XTh(t,ω)XDh(t,ω)
X2(t,ω)
,
(7)
where XT Dh(t,ω) is the STFT obtained using a
time-frequency-weighted window function hT D(n) that is a discrete version ofhT D(t)=tdtdh(t)[18].
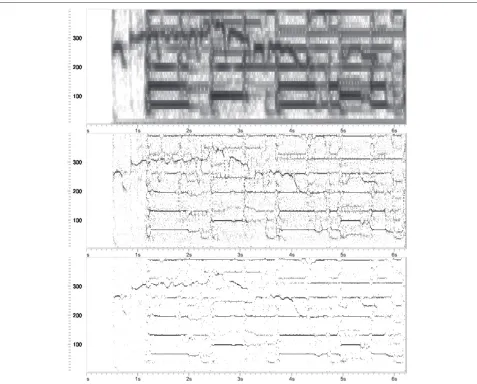
A comparison between a spectrogram, reassigned spec-trogram, and ‘refined’ reassigned specspec-trogram, for an excerpt from ‘Girl’ (by The Beatles) is provided in Figure 1. All spectrograms are computed using Hanning window of 192 ms with 90% overlapping. The figure shows how much ‘sharper’ the reassigned spectrogram representation is, when compared to the original ‘blurred’ spectrogram. This sharpness is due both to the benefits introduced by the application of Eqs. (6) and (7) (see Figure 1c) and to the fact that a substantial amount of energy has been reallo-cated to different chroma bins, as shown in Figure 1b (see also the results reported in Section 5.2).
3 Chord recognition system
This section introduces the basic components of the chord recognition system under study.
The first processing step aims to solve a possible prob-lem of mis-tuning in the audio input, by estimating the reference frequency then used to extract acoustic features. This problem is here addressed by applying a method that is very similar to that discussed in our previous work [35] and in [8,36].
Feature extraction is then applied to produce feature vector streams which represent the input for training or classification purposes.
Finally, the chord output sequence is produced by the decoding step, relying on an HMM framework which is addressed in the following, along with model topology and training.
3.1 Feature vector extraction
Figure 1Time-frequency representation of an excerpt from ‘Girl’ (by The Beatles).From top to bottom: spectrogram, reassigned spectrogram, and harmonic reassigned spectrogram with tolerance factor set to 0.4. All spectrograms are computed using a Hanning window of 192 ms with 90% overlapping.
the distribution histogram indicates the deviation (mea-sured in cents) of the estimated reference frequency from 440 Hz.
Once the reference frequency is estimated, the input waveform is converted to the frequency domain by the STFT, as described in Section 2. The STFT analysis is characterized both by the size of the window applied to each analysis frame and by the overlap factor. In this work, the latter is 50%, while window size ranges from 43 to 384 ms, according to the selected feature type.
Direct folding of spectral energy to semitone pitch scale values using Eq. (2) produces standard chroma (STD) features. Applying the time-frequency reassignment tech-nique before this procedure results in a reassigned chroma (RC) feature set. Note that only frequencies that corre-spond to a MIDI range between 54 (185 Hz) and 96 (2,093 Hz) notes are used. Harmonic reassigned chroma
(HRC) calculation is then based on the reassigned spec-trum obtained when fulfilling the condition introduced in Eq. (6). The influence of the tolerance factor on system performance is investigated in Section 5.5.
3.2 HMMs and GMMs
In general, an HMM is characterized by a number of hidden states and a model topology. Each state is then assigned a mixture density Gaussian distribution that characterizes the statistical behavior of the feature vectors within that state of the model. In this work, feature vec-tor components are assumed to be uncorrelated with one another, which means that the covariance matrix has a diagonal form. Finally, probabilities of self-transitions and jump-transitions between states complete the statistical characterization for a model.
As regards model topology, an HMM in which a tran-sition is allowed between any possible pair of states is referred to as an ergodic HMM. A GMM can be viewed as a single-state HMM with a Gaussian mixture observa-tion density, or an ergodic Gaussian observaobserva-tion HMM with fixed, equal transition probabilities [38]. Section 3.4 will further discuss the adoption of this model topology in automatic chord recognition.
The experimental activity reported in the following con-cerns the use of HMMs and GMMs, combined with TFR-based features in different ways. Figures 2 and 3 show the two main phases of the chord recognition task, i.e., train-ing and decodtrain-ing, respectively. In both cases, we assume that the input audio signal has been initially transformed into a stream of feature vectors.
3.3 Model training
Training of acoustic models is a fundamental step in the realization of a chord recognition system. In the liter-ature, different approaches are proposed [14,27], where a chord is represented as a hidden state of an ergodic HMM. Similarly to the approaches of Peeters [39] and Papadopoulos et al. [5], in this work, only one model is created for each ‘chord type’ from the predefined dictio-nary. A chord type represents chords with a given set of
Chord sequence labels
C:maj G:maj … F:maj ... A:min E:maj … D:min
Chord Models Chord type
models
Ba
u
m
-W
el
c
h
C
ir
cul
ar
pe
rm
u
ta
ti
o
n
C:maj C#:maj
D:maj D#:maj
E:maj … B:min
N-gram estimation Maj Min
N-grams ...
Training feature vector streams
...
Figure 2Description of the training phase.The Baum-Welch algorithm is used for acoustic model training. Training of n-gram models relies on ground-truth labels.
Viterbi decoder
Lattice
Lattice rescoring
Chord Models
C:maj C#:maj
D:maj D#:maj
E:maj … B:min Test feature
vector streams
...
N-grams
Output labels
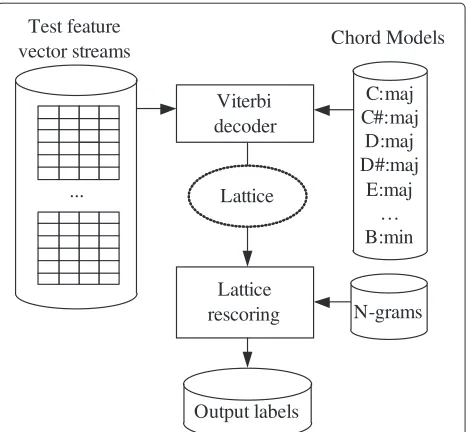
Figure 3Block diagram of the decoding system.
intervals between constituent notes regardless of the root note. In this work, two chord types are used, i.e., major and minor. An advantage of this approach is in terms of its flexibility when combined with a language modeling operation in a separate layer.
The final target of training is to produce 24 acous-tic models (i.e., 12 for each chord type). In general, the training is based on the application of the Baum-Welch algorithm, as depicted in Figure 2.
In order to generate training material, the sequence of feature vectors is first segmented according to the ground-truth labels so that each segment contains one chord. The circular permutation [39] procedure is then applied in order to discard root information. Here, all major chords are transposed to C major, and all minor chords are trans-posed to C minor. For example, given chroma vectors corresponding to the A minor ground-truth chord, a cir-cular shift by three bins is applied. A number of feature vector sequences are collected and subsequently used to train the corresponding acoustic model. Finally, in order to obtain model parameters for all possible chords related to a given chord type, another circular permutation is applied on mean vectors and the covariance matrix of multivariate Gaussians. More details on circular permuta-tion of chroma vectors as well as on processing of means and covariance matrices are reported in [5].
probability distribution for the next chord is influenced by the one or two preceding chords.
3.4 Model topology
The model topology is an important choice in speech pro-cessing applications based on HMMs. The most common approach to continuous speech recognition is to select a number of context-dependent (or independent) phone models, characterized by a left-to-right topology and a limited number of states. For instance, a three-state model is often used, in which the first state refers to the begin-ning of the phone, the second state refers to the heart of the phone, and the third state refers to the end of the phone. The basic assumption is that the sound to model is characterized by an underlying temporal structure and that each state is assigned a Gaussian mixture observation density characterizing a specific sub-phone unit.
However, when a clear temporal structure is not evi-dent in the speech sound to model, or when one needs to model an underlying set of hidden classes (e.g., speaker properties in the case of speaker identification), a GMM can represent a better solution. Indeed, GMMs are more commonly used than HMMs in speaker identification, as discussed in [38], and in acoustic event classification [40]. As regards chord recognition, a chord can be defined as ‘a combination of notes that sound simultaneously or nearly simultaneously’ [41]. However, in pop music, this concept is rather vague. Score transcription of a song is typically characterized by a compact representation consisting of a limited number of chords, each of them often corresponding to a segment in which the singer and instruments produce sequences of notes, in a non-simultaneous way, primarily related to that chord, but with major deviations with respect to the ideal case out-lined by the above-mentioned definition of chord. In this context, one cannot rely on the existence of an evident temporal structure related to the physical process charac-terizing all the realizations of a given chord, as is done with phone modeling for speech recognition.
As shown in Section 5.3, in the chord recognition task here addressed, no advantage is observed when using more than one state, i.e., a GMM with a given number of Gaussian mixture densities outperforms an HMM that consists of two or more states and is characterized by the same number of Gaussians.
3.5 Decoding step
In the decoding step, the Viterbi algorithm uses trained models that are connected in a chord loop network, as shown in Figure 4. An insertion penalty is introduced to influence the transition probability between chords. Varying the insertion penalty allows label sequences to be obtained with different degrees of fragmentation, as typically done in speech recognition tasks. As shown in
Cmaj
Begin End
Bmag C#maj
Dmaj
Bmin
Insertion penalty
Figure 4Chord loop grammar for the decoding step.
[15], the insertion penalty (or self-transition probability in [30]) can have a significant impact on the overall perfor-mance. For this reason, every experimental result reported in the following is based on a preliminary step with which we derived the optimal insertion penalty that maximized chord recognition performance.
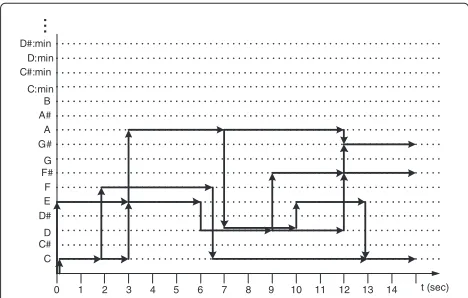
As in speech recognition systems based on multiple-pass decoding [42], the decoding procedure here consists of two steps. In the first step, an efficient bigram language model is applied in the Viterbi decoding, which produces a lattice. This lattice can be represented by a directed graph, where nodes denote time instants, while arcs represent different chord hypotheses. A sample lattice representa-tion is shown in Figure 5. In the second step, the lattice obtained is rescored by applying a more sophisticated trigram language model on the reduced search space.
4 Evaluation methodology and datasets
4.1 Recognition rate
The main goal of this work is to evaluate the effective-ness of the proposed acoustic features in carrying relevant information for chord discrimination. Two chord recogni-tion tasks are addressed in the following secrecogni-tions.
A simplified version of the chord recognition task is introduced in Section 5.1, where the chord loop pre-sented in Figure 4, without transition from ‘end’ to ‘start’ states, is adopted. This means that for a given input, the recognizer outputs one of the chords included in the loop. In this case, language modeling is omitted.
C C# D D# E F F# G G# A A# B C:min C#:min D:min D#:min
...
t (sec) 0 1 2 3 4 5 6 7 8 9 10 11 12 13 14
For this preliminary evaluation, we used a large set of recordings of individual notes collected at the Univer-sity of Iowa (http://theremin.music.uiowa.edu/MIS.html). This dataset contains high-quality note samples recorded from different instruments. Evaluation is performed based on recognition rate (RR), in this case, computed as the total duration of correctly classified chords divided by the total duration of chords, as reported in the following:
RR= |recognized_chords| ∩ |ground−truth_chords|
|ground−truth_chords| .
(8)
Another recognition task is then addressed in the suc-cessive sections, which also includes the application of language modeling. In order to evaluate the chord recog-nition performance based on the given chroma feature sets, in this case, a threefold cross validation was accom-plished on the commonly used Beatles dataset enriched with 38 songs of Queen and Zweieck. The distribution of songs into the three folds was accomplished on a ran-dom basis. The corresponding labels were kindly provided by C. Harte [43] and M. Mauch [44]. The RR measure expressed in terms of percentage is utilized as an evalu-ation metric. Predefined chord set consists of major and minor chord classes, resulting in 24 different chords. The 7th, min7, maj7, minmaj7, min6, maj6, 9, maj9, and min9 chords are merged to their root triads. Suspended aug-mented and diminished chords are discarded from this evaluation task.
4.2 Other metrics
Concerning the experiments on the simplified chord recognition task described in Section 5.1, in order to investigate more in-depth the properties of the proposed features, two additional criteria are used, i.e.,ratio (R) and
cosine measure (CM), which are computed as proposed in [45].
Letc(n)be an unwrapped chroma vector extracted from a chord sample that was generated from a set of notese. TheRestimate is the ratio of the power in the expected semitone bins, over the total power of that analysis frame. The expected semitone bins include the fundamentals and three partials for every note from sete.
To estimate CM, a chroma template y(n) is built so that its values are set to 1 in the chroma bins that cor-respond to the fundamentals and to [0.66 0.33 0.16] in the chroma bins that correspond to the first three over-tones, respectively. The CM estimate is then computed as CM= yy·cc, where·is the inner product and·is the
L2 norm.
5 Experimental results
In this section, we describe a series of experiments that show the convenience of using HRC features in the front-end processing. In Section 5.1, we start this study by comparing the impact of STD, RC, and HRC fea-tures on chord recognition performance in a task for which we minimize possible problems related to tempo-ral structure, as discussed in Section 3.4. The following sections provide experimental results using the Beatles corpus, for which the latter problems generally hold. We progressively analyze different aspects that influence the behavior of the system under study, starting from the impact of TFR processing in terms of energy real-location. Chord recognition performance is then inves-tigated when different model topologies and window lengths are chosen, as well as when the tuning operation is performed.
Finally, Section 5.5 aims to confirm the superiority of HRC features over STD and RC ones, providing experi-mental results obtained both on the Beatles corpus and on the RWC data set.
5.1 Chroma quality analysis
In this preliminary analysis, in order to generate chord waveforms, we used the dataset of the University of Iowa that was mentioned in Section 4.1. For a given chord type, the recordings of three constituent notes are chosen from three random instruments. All the note onsets were synchronized with each other. If a note of a given instrument has a duration of more than 2 s, everything that is after the 2nd second is discarded. Then, these samples are mixed together, producing a waveform of 2-s duration. The proposed schema for generating data results in 200 waveforms with the corresponding ground-truth information on the notes.
The obtained material is then used to evaluate the qual-ity of different chroma features as described in the pre-vious section. For the RR measure, half of the generated material was used as training set, and the other half was used for testing purposes. Chroma features were extracted with 192-ms window lengths, an overlapping factor of 90% and Hanning windowing.
The evaluation results for the three given chroma fea-tures are reported in Figure 6. In all the cases, HRC
andRCsignificantly outperform STDfeature. In
partic-ular, when comparing STD and HRC features, relative
improvements of 18.7%, 6.2%, and 3.5% are observed in terms ofR, CM, and RR, respectively. Moreover, theratio
measurements prove the ability of HRC to
deempha-size noise and impulsive components, which frequently occur during the note onsets. In fact, a relative
improve-ment of 5.4% in terms of Ris observed comparing RC
R CM RR 0.6
0.65 0.7 0.75 0.8 0.85 0.9 0.95
Measure STD
RC HRC
Figure 6Chroma quality estimates.R, CM, and RR normalized values between 0 and 1 for STD, RC, and HRC features.
5.2 Energy allocation in time-frequency
In order to estimate the impact of the time-frequency reassignment operation, statistical information on the energy reallocation distance in time-frequency coordi-nates from the Beatles corpus was also extracted. For
window length of 96 ms, f and t distributions have
zero-mean and standard deviations of 15.68 Hz and 14.3 ms, respectively. The statistics of the frequency reas-signments that lead to energy moving to another semitone bin are given in Table 1. This table shows that about 9.7% of all the reassignments result in moving energy to an adjacent semitone bin, which makes an impact on the chroma energy distribution. Indeed, reallocating a substantial amount of energy between different chroma components can improve the performance of a chord recognition system.
5.3 Number of states
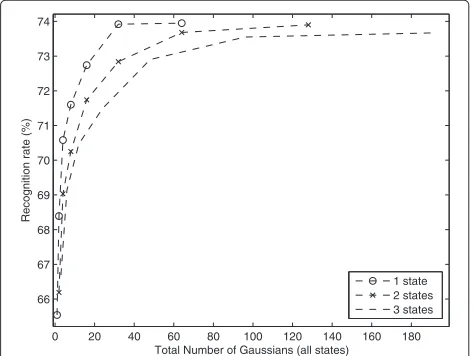
The first chord recognition experiments on the Beat-les dataset regarded the analysis of performance when varying the number of states. RR, as a function of the total number of Gaussians for a different number of hid-den states, is presented in Figure 7. The total number of
Table 1 Semitone change distribution, when using the reassigned spectrum, where frequency shift is expressed in terms of semitones
Frequency shift Energy reassignments (%)
−3 0.14
−2 0.43
−1 4.28
0 90.23
1 4.33
2 0.37
3 0.19
Gaussians, which can be calculated as number of Gaus-sians per state multiplied by the number of states, repre-sents the model complexity. Experimental results showed that using a one-state model leads to the highest RR for a given model complexity. Given this, all the next exper-iments will be conducted using a GMM, i.e., a one-state HMM topology. For a detailed analysis on the applica-tion of more complex HMM and GMM models, including full covariance matrices, one can refer to the work of Cho et al. [30], which also shows a limited advantage in using statistical models with higher complexity.
5.4 Influence on performance of tuning and window length
As mentioned in the previous sections, an important step in the feature extraction process is the estimation of the deviation of the A4 note from 440 Hz and subsequent compensation for mis-tuning [35]. Results with STD, RC,
0 20 40 60 80 100 120 140 160 180
66 67 68 69 70 71 72 73 74
Total Number of Gaussians (all states)
Recognition rate (%)
1 state 2 states 3 states
and HRC features, with and without tuning, are provided in Table 2.
These experimental results show that the tuning operation plays an important role and leads to an increase in performance for all the features. Moreover, the results show the advantage of adopting HRC features, which will be investigated in more detail in the following section.
Since the time-frequency reassignment technique used here includes the application of windowing, the impact of different window types on the performance was also investigated. Here, we will only report on the influ-ence of window length on chord recognition rate, since preliminary experiments using different window types (i.e., Hanning, Hamming, Kaiser, and Blackman) had showed that no significant difference in performance is observed for any of the investigated features, i.e., STD, RC, and HRC. Similar results were obtained in [35]. Given this experimental evidence, a Hanning window is adopted in all the following experiments.
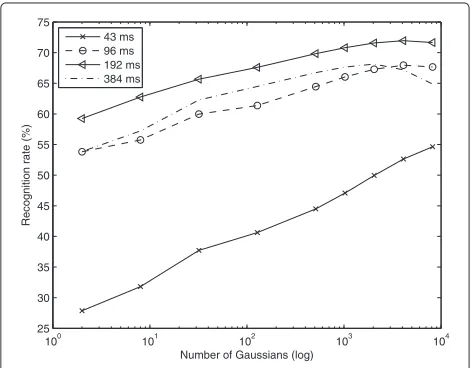
Figures 8 and 9 report on recognition rates using RC and STD features with different window lengths and numbers of Gaussians. For each configuration, the performance was derived using the best insertion penalty, as outlined in Section 3.5. These results show that an optimal win-dow length for the RC feature set is 96 ms, as opposed to the STD feature, for which such a short window length would provide a much lower performance. This fact is coherent with a more accurate energy localization in time for the TFR-based features. For the sake of conciseness, a similar figure regarding the use of HRC is not reported, since the recognition rate is always higher than the cor-responding one reported in Figure 8 for the RC feature. In other words, the trend of performance is similar for any of the selected window lengths, suggesting that it should be set to 96 ms also when RC features are used.
5.5 Harmonic reassigned chroma
As shown in Table 2, adopting HRC features improves the chord recognition rate. The purpose of this section is to provide more details on this experimental evidence.
First of all, the impact of the tolerance factorA intro-duced in Eq. (6) was investigated, as shown in Figure 10. The optimal value of Afor this chord recognition task turns out to be 0.4, with a recognition rate of 78.28%, although small deviations from this setting have a minor impact in terms of loss of performance.
Table 2 Influence of tuning on chord recognition performance, using STD and RC features
STD RC HRC
No tuning 70.33 76.70 77.59
Tuning 71.29 77.29 78.28
100 101 102 103 104
58 60 62 64 66 68 70 72 74 76 78
Number of Gaussians (log)
Recognition rate (%)
43 ms 96 ms 192 ms 384 ms
Figure 8Recognition rates using RC features for different window lengths and Gaussian numbers.
The next set of experiments aimed to compare HRC, RC, and STD features when varying the complexity and accuracy of the models. Figure 11 depicts recognition rates for different numbers of Gaussians. In all three cases, the results indicate that 2,048 is a good choice in terms of number of Gaussians. Higher values would not bring significant improvements and would increase the compu-tational load. This experimental evidence, however, may depend on the task and, in particular, on the size of the training material.
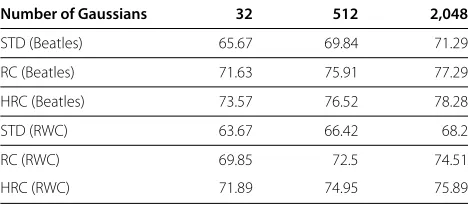
In order to understand the impact of the training mate-rial on the result, another set of experiments was carried out using the RWC dataset [46], which consists of 100 pop songs. The RWC dataset was used for training, while the same Beatles dataset was used for testing. Table 3
100 101 102 103 104
25 30 35 40 45 50 55 60 65 70 75
Number of Gaussians (log)
Recognition rate (%)
43 ms 96 ms 192 ms 384 ms
0.05 0.1 0.15 0.2 0.25 0.3 0.35 0.4 0.45 0.5 76
76.5 77 77.5 78 78.5
Tolerance factor
Recognition rate (%)
Figure 10Recognition rate for HRC as a function of the tolerance factor.
reports on recognition rates for 32, 512, and 2,048 Gaus-sians taken from results presented in Figure 11, as well as results obtained by training models on the RWC dataset.
Note that in speech recognition, a mismatch between training and testing conditions often leads to a signif-icant loss of performance. Our experiments show that performance is obviously lower when chord models are trained on the RWC dataset. However, the loss of per-formance due to this mismatch is not substantial (i.e., a reduction of about 2% to 3%), which confirms that the proposed system seems to be quite robust to different possible choices of training material.
Moreover, it is worth noting that the advantage of using TFR over STD features is confirmed when models are trained on the RWC dataset. Also in this case, HRC features always outperform RC ones.
6 Conclusions
This paper investigates the important role that acoustic feature extraction plays in automatic chord recognition.
100 101 102 103 104
55 60 65 70 75 80
Number of Gaussians (log)
Recognition rate (%)
STD RC HRC
Figure 11Recognition rate as a function of the number of Gaussians.Performance is shown for the three different feature sets, STD, RC, and HRC.
The chord recognition system under study is based on a probabilistic approach to statistically model sequences of chroma features.
The main focus of the work is on the reassigned spec-trogram. This time-frequency representation is here pro-posed as alternative to the standard STFT to derive a more accurate set of chroma features. Experimental results showed that better chord recognition rates can be obtained with TFR-based features, if compared to per-formance provided by traditional STFT-based chroma features. Applying harmonic component separation in the spectral domain further increases this performance. The experimental section comprises a quantitative analysis which shows the effectiveness of time-frequency reas-signment from different perspectives and with a different assignment to some key parameters.
As final result, a substantial improvement over the baseline system was obtained using the HRC feature, with a 78.28% recognition rate on a commonly used dataset. Note that an extended version of the same chord recognition system, but with additional bass chroma fea-ture and multi-stream HMMs, was then adopted in the MIREX 2011 evaluation, in which it provided one of the best performances in terms of overlap ratio, which was equal to 82.85% (http://nema.lis.illinois.edu/nema_ out/mirex2011/results/ace/).
Table 3 Recognition rates using the RWC dataset for training and the Beatles dataset for test (RWC), compared to performance obtained training on a threefold cross validation of the Beatles dataset (Beatles)
Number of Gaussians 32 512 2,048
STD (Beatles) 65.67 69.84 71.29
RC (Beatles) 71.63 75.91 77.29
HRC (Beatles) 73.57 76.52 78.28
STD (RWC) 63.67 66.42 68.2
RC (RWC) 69.85 72.5 74.51
Overall, this study also represents a starting point to explore different research topics.
Our experimental activity demonstrated that using a one-state HMM, i.e., GMM, leads to better performance than using two or more states. This fact probably depends on the characteristics of the training and testing mate-rial, in particular on its labeling. While the purpose of this work was to use an HMM as a framework to ana-lyze the convenience of using TFR features, the above-mentioned issue would definitely deserve a specific study based on a different definition of the chord recognition problem as well as on the adoption of other labeled music material.
As shown by the results of the MIREX 2011 chord detec-tion evaluadetec-tion campaign, multi-stream HMMs represent another possible area to further investigate, in order to better characterize the frequency band splitting and the related optimal weighting of each stream.
Another direction regards the introduction of rhythm analysis in the given framework. The most straightfor-ward possible improvement can be obtained by including a probabilistic modeling of the temporal structure. This can be done by embedding an additional hidden layer in HMMs, as proposed in [47], where hidden states corre-spond to different beat phases.
Finally, an interesting research issue to investigate, in order to improve the quality of feature vectors when using TFR, is the application of a more accurate analy-sis of higher harmonics. For instance, one could adopt the higher harmonic subtraction technique outlined in [10,11].
For most of the outlined directions, more complex chord recognition tasks will be addressed by both increas-ing the size of the chord set and processincreas-ing different music styles (e.g., jazz).
Abbreviations
CM: Cosine measure; GMM: Gaussian mixture model; HMM: Hidden Markov model; HRC: Harmonic reassigned chroma; MIR: Music information retrieval;R: Ratio; RC: Reassigned chromal; RR: Recognition rate; STD: Standard chroma; STFT: Short-time Fourier transform; SVM: Support vector machine; TFR: Time-frequency reassignment.
Competing interests
Both authors declare that they have no competing interests.
Received: 20 July 2012 Accepted: 10 June 2013 Published: 27 June 2013
References
1. JP Bello, inProceedings of the International Conference on Music Information Retrieval (ISMIR). Audio-based cover song retrieval using approximate chord sequences: testing shifts, gaps, swaps and beats (Philadelphia, (2007), pp. 239–244
2. LR Rabiner, RW Schafer, inIntroduction to Digital Speech Processing. Now Publishers Inc. (Hanover, 2007)
3. T Fujishima, inProceedings of the International Computer Music Conference (ICMC). Realtime chord recognition of musical sound: a system using common lisp music (Beijing, 1999), pp. 464–467
4. A Sheh, DP Ellis, inProceedings of the International Symposium on Music Information Retrieval (ISMIR). Chord segmentation and recognition using EM-trained hidden Markov models (Baltimore, 2003)
5. H Papadopoulos, G Peeters, inProceedings of the International Workshop on Content-Based Multimedia Indexing (CBMI). Large-scale study of chord estimation algorithms based on chroma representation and HMM (Bordeaux, 2007), pp. 53–60
6. M Mauch, S Dixon, inProceedings of the International Conference on Music Information Retrieval (ISMIR). A discrete mixture model for chord labelling (Philadelphia, 2008), pp. 45–50
7. H Papadopoulos, G Peeters, Joint estimation of chords and downbeats from an audio signal. IEEE Trans. Audio, Speech, Lang, Process.19, 138–152 (2011)
8. M Müller, S Ewert, inProceedings of the International Conference on Music Information Retrieval (ISMIR). Chroma toolbox: MATLAB implementations for extracting variants of chroma-based audio features (Miami, 2011) 9. M Stein, M Schubert, BM Gruhne, G Gatzsche, M Mehnert, inProceedings of
the 126th Convention of the Audio Engineering Society (AES). Evaluation and comparison of audio chroma feature extraction methods (Munich, 2009) 10. M Mauch, S Dixon, inProceedings of the International Conference on Music
Information Retrieval (ISMIR). Approximate note transcription for the improved identification of difficult chords (Utrecht, 2010), pp. 135–140 11. M Varewyck, J Pauwels, JP Martens, inProceedings of the 16th ACM
international conference on Multimedia. A novel chroma representation of polyphonic music based on multiple pitch tracking techniques (New York, 2008), pp. 667–670
12. E Gómez, P Herrera, inProceedings of the 25th International AES Conference. Automatic extraction of tonal metadata from polyphonic audio recordings (London, 2004), pp. 74–81
13. Y Ueda, Y Uchiyama, T Nishimoto, N Ono, S Sagayama, inProceedings of the IEEE International Conference on Acoustics, Speech and Signal Processing (ICASSP). HMM-based approach for automatic chord detection using refined acoustic features (Dallas, 2010), pp. 5518–5521
14. K Lee, M Slaney, Acoustic chord transcription and key extraction from audio using key-dependent HMMs trained on synthesized audio. IEEE Trans. Audio, Speech, Lang. Process.16(2), 291–301 (2008)
15. M Khadkevich, M Omologo, inProceedings of the International Conference on Music Information Retrieval (ISMIR). Use of hidden Markov models and factored language models for automatic chord recognition (Kobe, 2009), pp. 561–566
16. M Khadkevich, M Omologo, inProceedings of the IEEE International Conference on Acoustics, Speech and Signal Processing (ICASSP). Time-frequency reassigned features for automatic chord recognition (Prague, 2011), pp. 181–184
17. T Rocher, M Robine, P Hanna, L Oudre, inProceedings of the International Conference on Music Information Retrieval (ISMIR). Concurrent estimation of chords and keys from audio (Utrecht, 2010), pp. 141–146
18. KR Fitz, SA Fulop, A unified theory of time-frequency reassignment. Comput. Res. Repository (CoRR).abs/0903.3080(2009) 19. PJ Loughlin, KL Davidson, Modified Cohen-Lee time-frequency
distributions and instantaneous bandwidth of multicomponent signals. IEEE Trans. Signal Process.49(6), 1153–1165 (2001)
20. SA Fulop (Ed),Speech Spectrum Analysis. (Springer, Heidelberg, 2011) 21. K Kodera, R Gendrin, C Villedary, Analysis of time-varying signals with small
BT values. IEEE Trans Acoustics, Speech Signal Process.26, 64–76 (1978) 22. T Abe, M Honda, Sinusoidal model based on instantaneous frequency
attractors. IEEE Trans. Audio, Speech Lang, Process.14(4), 1292–1300 (2006)
23. DPW Ellis, GE Poliner, inProceedings of the IEEE International Conference on Acoustics, Speech and Signal Processing (ICASSP). Identifying ‘Cover Songs’ with chroma features and dynamic programming beat tracking (Honolulu, 2007), pp. 1429–1432
24. SW Hainsworth, PJ Wolfe, inProceedings of the International Computer Music Conference (ICMC). Time-frequency reassignment for music analysis (Havana, 2001), pp. 14–17
25. L Oudre, Y Grenier, C Févotte, inProceedings of the International Conference on Music Information Retrieval (ISMIR). Template-based chord recognition: influence of the chord types (Kobe, 2009), pp. 153–158 26. C Harte, M Sandler, inProceedings of the 118th Convention of the Audio
27. H Papadopoulos, G Peeters, inProceedings of the IEEE International Conference on Acoustics, Speech and Signal Processing (ICASSP). Simultaneous estimation of chord progression and downbeats from an audio file (Las Vegas, 2008), pp. 121–124
28. L Rabiner, A tutorial on hidden Markov models and selected applications in speech recognition. Proc, IEEE.77, 257–286 (1989)
29. DA Reynolds, RC Rose, Robust text-independent speaker identification using Gaussian mixture speaker models. IEEE Trans. Speech Audio Process.3, 72–83 (1995)
30. T Cho, RJ Weiss, JP Bello, inProceedings of the Sound and Music Computing Conference (SMC). Exploring common variations in state of the art chord recognition systems (Barcelona, 2010), pp. 1–8
31. SW Hainsworth, MD Macleod, Time frequency reassignment: a review and analysis Technical report, Cambridge University Engineering Department, CUED/F-INFENG/TR, 459 (June 2003)
32. F Auger, P Flandrin, Improving the readability of time-frequency and time-scale representations by the reassignment method. IEEE Trans, Speech Audio Process.5(43), 1068–1089 (1995)
33. SA Fulop, K Fitz, Separation of components from impulses in reassigned spectrograms. J. Acoust. Soc. Am.121(3), 1510–1518 (2007)
34. DJ Nelson, Instantaneous higher order phase derivatives. Digit Signal Process.12(2–3), 416–428 (2002)
35. M Khadkevich, M Omologo, inProceedings of the International Conference on Digital Audio Effects DAFx. Phase-change based tuning for automatic chord recognition (Como, 2009), pp. 506–509
36. E Gómez, Tonal description of music audio signals. PhD thesis, Universitat Pompeu Fabra (2006)
37. K Lee, inPhD thesis, Center for Computer Research in Music and Acoustics (CCRMA). A system for acoustic chord transcription and key extraction from audio using hidden Markov models trained on synthesized audio (Department of Music, Stanford University, 2008)
38. DA Reynolds, Speaker identification and verification using Gaussian mixture speaker models. Speech Commun.17(91–108) (1995) 39. G Peeters, inProceedings of the International Conference on Digital Audio
Effects DAFx. Musical key estimation of audio signal based on HMM modeling of chroma vectors (McGill, 2006), pp. 127–131 40. C Zieger, M Omologo, inProceedings of Interspeech. Acoustic event
classification using a distributed microphone network with a GMM/SVM combined algorithm (Brisbane, 2008), pp. 115–118
41. A Klapuri, M Davy (eds.),Signal Processing Methods for Music Transcription (Springer, New York, 2006)
42. D Jurafsky, JH Martin (eds.),Speech and Language Processing: An Introduction to Natural Language Processing Computational Linguistics, and Speech Recognition(Prentice Hall Upper Saddle River, 2000)
43. C Harte, M Sandler, inProceedings of the International Conference on Music Information Retrieval (ISMIR). Symbolic representation of musical chords: a proposed syntax for text annotations (London, 2005), pp. 66–71 44. M Mauch, S Dixon, Simultaneous estimation of chords and musical
context from audio. IEEE Trans. Audio, Speech, Lang, Process.18(6), 1280–1289 (2010)
45. C Joder, S Essid, G Richard, inProceedings of the IEEE International Conference on Acoustics, Speech and Signal Processing (ICASSP). A comparative study of tonal acoustic features for a symbolic level music-to-score alignment (Dallas, 2010), pp. 409–412 46. M Goto, H Hashiguchi, T Nishimura, R Oka, inProceedings of the
International Conference on Music Information Retrieval (ISMIR). RWC music database: popular, classical, and jazz music databases (Paris, 2002), pp. 287–288
47. M Khadkevich, T Fillon, G Richard, M Omologo, inProceedings of the IEEE International Conference on Acoustics, Speech and Signal Processing (ICASSP). A probabilistic approach to simultaneous extraction of beats and downbeats (Kyoto, 2012), pp. 445–448
doi:10.1186/1687-4722-2013-15
Cite this article as:Khadkevich and Omologo:Reassigned spectrum-based
feature extraction for GMM-based automatic chord recognition.EURASIP
Journal on Audio, Speech, and Music Processing20132013:15.
Submit your manuscript to a
journal and benefi t from:
7Convenient online submission
7Rigorous peer review
7Immediate publication on acceptance
7Open access: articles freely available online
7High visibility within the fi eld
7Retaining the copyright to your article